ISSN 1549-3636
© 2011 Science Publications
Corresponding Author: S. Kavitha, Department of ECE, Nandha Engineering College, Erode-638 052, India
Adaptive Neuro-Fuzzy Inference System
Approach for the
Automatic Screening of Diabetic Retinopathy in Fundus Images
1
S. Kavitha and
2K. Duraiswamy
1
Department of ECE, Nandha Engineering College, Erode-638 052, India
2
K.S. Rangasamy College of Technology, Tiruchengode, India
Abstract:Problem statement: Diabetic retinopathy is one of the most significant factors contributing to blindness and so early diagnosis and timely treatment is particularly important to prevent visual loss. Approach: An integrated approach for extraction of blood vessels and exudates detection was proposed to screen diabetic retinopathy. An automated classifier was developed based on Adaptive Neuro-Fuzzy Inference System (ANFIS) to differentiate between normal and nonproliferative eyes from the quantitative assessment of monocular fundus images. Feature extraction was performed on the preprocessed fundus images. Structure of Blood vessels was extracted using Multiscale analysis. Hard Exudates were detected using CIE Color channel transformation, Entropy Thresholding and Improved Connected Component Analysis from the fundus images. Features like Wall to Lumen ratio in blood vessels, Texture, Homogeneity properties and area occupied by Hard Exudates, were given as input to ANFIS.ANFIS was trained with Back propagation in combination with the least squares method. Proposed method was evaluated on 200 real time images comprising 70 normal and 130 retinopathic eyes. Results and Conclusion: All of the results were validated with ground truths obtained from expert ophthalmologists. Quantitative performance of the method, detected exudates with an accuracy of 99.5%. Receiver operating characteristic curve evaluated for real time images produced better results compared to the other state of the art methods. ANFIS provides best classification and can be used as a screening tool in the analysis and diagnosis of retinal images.
Key words: Monocular fundus, CIE color space, connected component analysis, Computer-Aided Diagnosis (CAD), Gabor filter, automatic exudates, optic disk, lipids leaking, blood vessel, fundus images, True Negative (TN)
INTRODUCTION
Early diagnosis and accurate staging are essential prerequisites for effective treatment of Diabetic Retinopathy and reduction of visual disability risk. Diabetic Retinopathy can lead to several abnormalities like micro aneurysms, hemorrhages and exudates. This work focuses on exudates detection because it provides information about early diabetic Retinopathy. Exudates manifests as hard white or yellowish localized regions with varying sizes, shapes and locations. Main cause of Exudates is proteins and lipids leaking from the blood stream into the retina via damaged blood vessels. Current methods of detection and assessment of DR is expensive and require trained ophthalmologists. In the proposed approach, automatic exudates detection is presented in order to detect and treat DR in an early stage using fundus images. Screening of diabetic patients for the development of diabetic retinopathy can potentially reduce the risk of blindness in these patients
by 50% (Ege et al., 2000; Hove et al., 2004; Hsu et al., 2001). A novel approach utilizing Shannon entropy other than the evaluation of derivates of the image is used in detecting edges in gray level images (Singh and Singh, 2008). Computer-Aided Diagnosis (CAD) (Suzuki et al., 2005) has been an active area of study in medical image analysis, because evidence suggests that CAD can help improve the diagnostic performance of clinicians in their image interpretations. The major blood vessels are detected first and intersection of this is used to find the approximate location of the optic disk and localized using color properties (Ravishankar et al., 2009).
vessels (Wu et al., 2006) is done via forward detection, bifurcation Identification and backward verification. Sinthanayothin et al. (2002) reported the result of an automated detection of diabetic retinopathy on fundus images by recursive region growing segmentation algorithm. The Fuzzy C-Means (FCM) clustering algorithm is used to classify the features vectors into vessel or non-vessel based on the texture properties (Bhuiyan et al., 2007).
GUI was developed on Matlab to model laser machining process using Adaptive Network based Fuzzy Inference System (
Sivarao
et al., 2009). Optimally adjusted morphological operators are used for exudates detection on diabetic retinopathy patients with non-dilated pupils and low-contrast images (Sopharak et al., 2008). Hemorrhages and exudates were automatically detected in fundus images and blood vessel regions were eliminated by examining the structure of the blood vessels and then evaluating the length-to-width ratio (Hatanaka et al., 2007). Hard exudates extraction is carried out using two features of lesions namely color (Sanchez et al., 2004) using statistical classification and its sharp edges using edge detector. Exudates and optic disc regions are higher in intensity, so contrast enhancement technique tends to assign them the highest intensity values (Osareh et al., 2003).The sorting system is constructed based on the idea of hierarchical grading approach and the HIS with multilevel knowledge representation (Yen and Leong, 2008). Zhang and Chutatape (2005) use local contrast enhancement and fuzzy c means clustering in the LUV color space to segment candidate bright lesion areas and hierarchical SVM’s are used for classification. Features, namely intensity, standard deviation on intensity, hue and a number of edge pixels are extracted to supply as input parameters to coarse segmentation using FCM clustering method and then fine-tuned with morphological techniques to detect exudates. Blood vessels are enhanced by matched filter and filter response image is processed by a thresholding scheme in order to extract the blood vessel from the background (Quing, 2004).
ANFIS provides a method for the fuzzy modeling procedure to learn information about a dataset, in order to compute the membership function parameters that best allow the associated fuzzy inference system to track the given input/output data (Jang et al., 2004). The optimal input set is determined based on the response table and ANOVA through orthogonal array experiments and designed with ANN and fuzzy logic system to distinguish between normal and abnormal eyes (Huang et al., 2007). Adaptive-Network-based Fuzzy Inference Systems is used in the system to identify the authorized and unauthorized people for secure buildings (Wahyudi et al., 2007).
MATERIAL AND METHODS
All the digital retinal images used in this work were obtained from Topcon TRC-50 EX non mydriatic camera with a 50° field of view at Aravind Eye hospital, Madurai. The image size is 1900x1600 pixels which were digitized at 24 bits true color images. Preprocessing: Preprocessing of retinal images is the first step in the automatic diagnosis of retinal diseases. Color fundus images are resized to a standard size of 576 ×720pixels. Retinal images are filtered using a gray scale opening with disc shaped structuring element with diameter larger than maximum width of retinal vessels. The opened image is then subtracted from the original image to obtain enhanced image.
Feature extraction: Features extracted are wall to Lumen ratio of retinal arterioles in blood vessels, Area of exudates, textural and Homogeneity properties. Multiscale blood vessel extraction: Changes in retinal Blood Vessels represents progression of the disease. Multi scale techniques helps in isolating information about objects by considering geometrical features at different scales. Features are obtained by convolving the original image I (x, y) with a Gaussian kernel G(x.y):
L(x, y)=I(x, y)⊗G(x, y) (1)
Where:
2 2
2 x y
2s 2
1
G(x, y) e
2 s
− −
=
π
and s is the scale parameter.
Texture analysis: Adaptive Histogram equalization is performed on the green channel component of the fundus images. Entropy is then calculated from the preprocessed fundus images. The value of the entropy is low if the same pair of pixels appears frequently and high if all the grayscale or color levels are faintly represented.
Homogeneity: Gray Level Co-Occurrence Matrix (GLCM) is a tabulation of how often different combinations of pixel brightness values (gray levels) occur in a pixel pair in an image. Returns a value that measures the closeness of the distribution of elements in the to the GLCM diagonal. Each element (i,j) in GLCM specifies the number of times that the pixel with value i occurred horizontally adjacent to a pixel with value j. The resulting matrix was analyzed and based on the existing information, the characteristics vectors associated to the matrix was determined:
( )
i, j
P i, j 1+ −1 j
∑
(2)Each field contains a 1x p array where p is the number of gray level cooccurence matrix in GLCM.
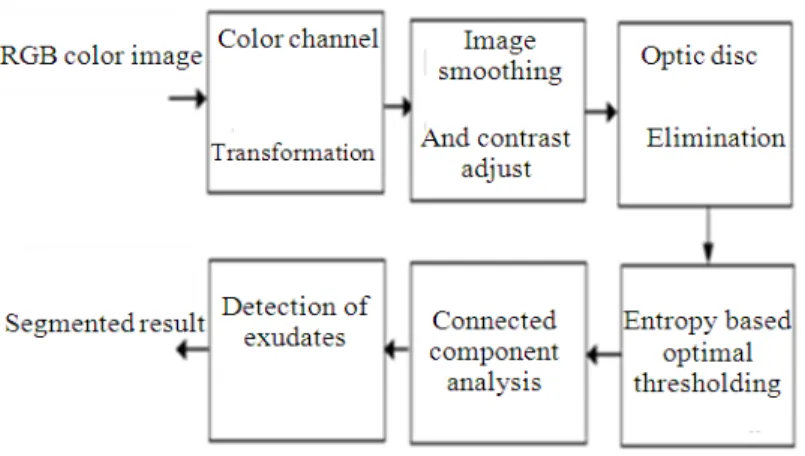
Exudates Detection: Color channel transformation: To overcome the drawback of RGB color space in high level processing and to achieve perceptual uniformity, CIE color space is used in the proposed work (Fig. 1).
Preprocessing: Retinal images were processed using a preprocessing stage. A 3×3 median filter is used to remove the noise and Contrast limited Histogram Equalization was applied for contrast enhancement in order to easily identify the exudates pixels.
Optic disc elimination: OD has similar characteristics to that of Exudates like contrast, bright intensity and sharp boundaries with the background. Optic disc detected using Region of Interest and Connected Component analysis is eliminated and it is used as a mask.
Blood vessels removal: Closing operation is performed on the color channel to eliminate the vessels that remain in the optic disc region. Closing of the image A by the structuring element B is denoted as:
A.B=[A⊕B]⊙B (3)
Closing of A by B is the dilation of A by B followed by the erosion of the result by B.
Entropy thresholding: An efficient entropy thresholding method based on gray tone spatial dependency matrix is used to find optimal threshold as it takes into account the spatial distribution of gray levels and preserves the spatial structures in threshold image. The gray level co-occurrence matrix of the image F is a M xN dimensional matrix G= [Cij]MxN gives an idea about the transition of intensities between adjacent pixels, indicating spatial structural information of an image. Depending upon the ways in which the gray level i follows gray level j, GLCM is obtained as follows:
M N
ij l 1 k 1
C
= =
=
∑∑
δ (4)Where:
f (l, k) i and f (l, k 1) j
1 if (or)
f (l, k) i and f( l 1,k ) j
= + =
δ =
= + =
δ= 0, otherwise
The probability of co-occurrence Pij of gray levels i and j can be written as:
ij ij
ij i j
C P
C
=
∑ ∑ (5)
The second order entropy of the object is given by:
g t A A
(2)
ij 2 ij
A i 0 j 0
1 (g)
H = −2∑ ∑= = P logP (6)
Similarly, the second order entropy of the background is given by:
L 1 L 1
( 2) C C
C i g 1 j t 1 ij 2 ij
1
(t) log
H 2 P P
− − = + = +
= − ∑ ∑ (7)
The total second order local entropy the object and the background is given by:
( 2) (2) (2)
T (g, t) A(g) C (t)
H =H +H (8)
Fig. 1: Block diagram for exudates detection
Table 1: Performance analysis of retinal images for exudates detection
Ground detected sensitivity specificity accuracy
Images truth pixels pixels TP FP FN TN (%) (%) (%)
G1 3750 3793 3739 54 11 225916 99.70 99.90 99.97
G2 1279 1267 1243 24 36 220810 97.18 99.98 99.97
G3 4811 4722 4673 49 338 211213 97.10 99.97 99.82
G4 4112 4213 4093 120 19 273344 99.50 99.95 99.94
G5 1320 1891 1304 587 16 269757 98.70 99.70 99.97
G6 930 1078 917 161 13 234032 98.60 99.93 99.92
G7 2315 2422 2294 128 21 245831 99.00 99.94 99.93
G8 941 1492 929 563 12 254667 98.72 99.70 99.77
G9 4634 5010 4597 413 37 235980 99.20 99.80 99.81
G10 5176 5211 5132 79 44 238872 99.10 99.96 99.94
Improved connected component labeling: Individual objects are isolated separately by using eight connected neighborhood and label propagation. In order to obtain the lesion object the holes inside the boundary are filled using the morphological filling operation on the binary image. Image obtained after closing operation is complemented and component labeling is done so as to count the number of exudates (Fig. 2) and also to find the area occupied by the exudates.
Sensitivity = TP/(TP+FN) = 99%
Specificity = TN/ (TN+FP) = 99.78% Accuracy = (TP+TN)/(TP+FP+FN+TN) = 99.5%
Performance of the method was evaluated by comparing the detection result with ophthalmologist’s hand-drawn ground truth (Table 1). True Positive (TP) is defined as the number of exudates pixels correctly classified. False Positive (FP) is the number of non-exudate pixels which are incorrectly classified as exudates pixels. False Negative (FN) is the number of exudates pixels that were not detected and True Negative (TN) is the number of non-exudates pixels correctly classified.
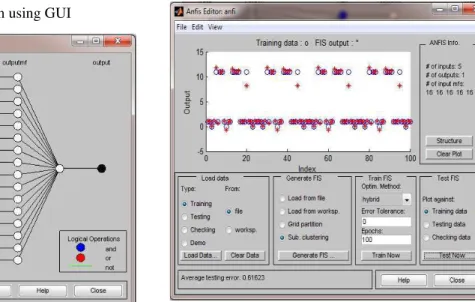
Adaptive Neuro-Fuzzy Inference System (ANFIS): ANFIS integrates the best features of Fuzzy Systems and Neural Networks and provides smoothness due to the Fuzzy control interpolation, adaptability and Neural Network Back propagation.
Design of ANFIS: ANFIS depends on the sizes of the training set and testing set. In this work training and testing set were formed by 120 and 80 data. 120 data (40 normal and 80 abnormal cases) was used for training and the remaining 80 data (30 normal and 50 with exudates) was used for testing. ANFIS was implemented with MATLAB software. Features from blood vessels, area of exudates, entropy, and Homogeneity properties were given as input to ANFIS. Classification was carried out in two steps using ANFIS: • Training
• Testing
generated from ANFIS (Fig. 4) and Membership functions are almost consistent for individual parameters before and after training in ANFIS. The train FIS optimization methods are chosen as hybrid since it includes least square type along with back propagation gradient descent algorithm which trains the membership function parameters to emulate the training data. When the training error goal is achieved, the training process stops and average training error (Fig. 5) is noted. The structure is of the FIS is created and the training data versus FIS output (Fig. 6) is plotted.
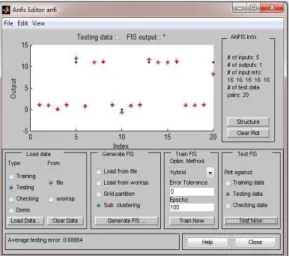
Testing: The next step is to test the created model with the help of test data. The test data is loaded from the workspace. The testing data versus FIS output (Fig. 7) gives a clear view of classification and the testing error.
Fig. 2: Steps in exudates detection using GUI
Fig 3: Generated ANFIS structure
Fig. 4: If then rules generated from ANFIS
Fig. 5: Training error
Fig. 7: Testing data versus FIS output
Fig. 8: Performance curve generated by ANFIS
The Membership functions are generated by ANFIS as per the applied input and desired output. The average training error for 100 images and testing error for 50 images are 0.61623 and 0.68864 respectively. (Fig. 8) shows the Receiver operating Characteristic curve generated by ANFIS.
RESULTS
Features from blood vessels and area occupied by exudates were the best parameters to differentiate between stages of nonproliferative diabetic retinopathy eyes as normal, mild and severe. With ANFIS technique, ROC area was increased to 0.99.
DISCUSSION
Numerous work has been reported using traditional and commonly used classification methods to help
clinical diagnosis. There are a very few researches available with ANFIS application but only with OCT images. Hence a new method has been presented for the detection of exudates with Fundus images. ANFIS was preferred since it utilizes the mathematical properties of artificial in tuning rule based systems that best approximates the way human beings process the information. Though the results are good in the work the difficulty lies in choosing the variables to be used as input to ANFIS. Clinician’s knowledge and interpretive skills are irreplaceable. ANFIS results can definitely provide assistance in making decisions on retinopathic eye diseases.
ACKNOWLEDGEMENT
The researchers would like to thank Dr. Kim, Chief Vireo retinal service and Dr. S.R. Krishnadas, Chief Medical Officer, Glaucoma services, Aravind eye hospital, Madurai for providing us the images and valuable information on Diabetic Retinopathy and Glaucoma.
CONCLUSION
An automated system has been successfully developed which is able to detect the exudates in the fundus photographs with the performance approaching that of trained clinical observers. It has been found that the exudates can be detected irrespective of the stages of its growth. The method is found to reduce the manual effort and ANFIS technique can provide assistance in making decision on exudates diagnosis.
REFERENCES
Bhuiyan, A., B. Nath, J. Chua and R. Kotagiri, 2007. Blood vessel segmentation from color retinal images using unsupervised texture classification. Proceedings of the IEEE International Conference on Image Processing, Sept. 16-19, San Antonio,
TX, pp: 521-524. DOI:
10.1109/ICIP.2007.4379880
Ege, B.M., O.K. Hejlesen, O.V. Larsen, K. Moller and B. Jenning et al., 2000. Screening for diabetic retinopathy using computer based image analysis and statistical classification. Comput. Methods Programs Biomed., 62: 165-175. PMID: 10837904 Hatanaka, Y., T. Akagawa, Y. Hayashi and Y.
Hove, M.N., J.K. Kristensen, T. Lauritzen and T. Bek, 2004. Quantitative analysis of retinopathy in type 2 diabetes: Identification of prognostic parameters for developing visual loss secondary to diabetic maculopathy, ACTA Ophthalmol. Scand., 82: 679-685. PMID: 15606463
Hsu, W., P.M.D.S. Pallawala, M.L. Lee and K.A. Eong, 2001. The role of domain knowledge in the detection of retinal hard exudates. Proceedings of the International Conference on Computer Vision and Pattern Recognition, IEEE Computer Society, Dec. 08-14, Kauai, Hawaii, pp: 246-251. ttp://doi.ieeecomputersociety.org/10.1109/CVPR.2 001.990967
Huang, M.-L., H.-Y. Chen and J.-J. Huang, 2007. Glaucoma detection using adaptive Neuro-fuzzy inference system. Expert Syst. Appli., 32: 458-468. DOI: 10.1016/J.ESWA.2005.12.010
Jang, J.S.R., C.T. Sun and E. Mizutani, 2004. Neuro-fuzzy and soft computing. Pearson Educ., 335-342. http://www.cs.rpi.edu/academics/courses/fall01/sof t-computing/pdf/jang1.pdf
Osareh. A., M. Mirmehdi, B. Thomas and R. Markham, 2003. Automated identification of diabetic retinal exudates in digital color images. Br. J.
Ophthalmol., 87: 1220-1223.
http://www.ncbi.nlm.nih.gov/pmc/articles/PMC192 0779/
Quing, Z.H., 2004. Segmentation of blood vessels in retinal images using 2-D entropies of gray level gradient co-occurrence matrix. Proceeding of the IEEE International Conference on Acoustics, Speech, Signal Processing, May 17-21, pp: 509-512. DOI: 10.1109/ICASSP.2004.1326593 Ravishankar, S., A. Jain and A. Mittal, 2009.
Automated feature extraction for early detection of diabetic retinopathy in fundus images. Proceedings of the IEEE Computer Society Conference on Computer Vision and Pattern Recognition, June 20-25, Miami, FL., pp: 210-217. DOI: 10.1109/CVPR.2009.5206763
Reza, A.W., C. Eswaran and S. Hati, 2009. Automatic Tracing of Optic Disc and Exudates from Color Fundus Images Using Fixed and Variable Thresholds. J. Med. Syst., 33, 73-80, DOI: 10.1007/s10916-008-9166-4
Sanchez, C.I., R. Hornero M.I. Lopez and J. Poza, 2004. Retinal image analysis to detect and quantify lesions associated with diabetic retinopathy. Proceedings of the 26th Annual International Conference of the IEEE Engineering in Medicine and Biology Society, Sept. 1-5, San Francisco,
CA., pp: 1624-1627. DOI:
10.1109/IEMBS.2004.1403492
Singh, B. and A.P. Singh,2008. Edge detection in gray level images based on the Shannon entropy. J.
Comput. Sci., 4: 186-191.
http://www.amazon.com/detection-level-images-shannon-entropy/dp/B001MZ0D2C
Sinthanayothin, C., J.F. Boyce, T.H. Williamson and H.L. Cook, 2002. Automated detection of diabetic retinopathy on digital fundus images. Int. J. Diabetic Med., 19: 105-112. DOI: 10.1046/j.1464-5491.2002.00613.x
Sivarao, P. Brevern and N.S.M. El-Tayeb, 2009. A new approach of adaptive network-based fuzzy inference system modeling in laser processing-a graphical user interface based. J. Comput. Sci., 5: 704-710.
http://www.scipub.org/fulltext/jcs/jcs510704-710.pdf
Sopharak, A., B. Uyyanonvara, S. Barman and T. Williamson, 2008. Automatic detection of diabetic retinopathy exudates from non-dilated retinal images using mathematical morphology methods. Comput. Med. Imag. Graphics, 32: 720-727. http://www.medicalimagingandgraphics.com/articl e/S0895-6111%2808%2900093-1/abstract
Suzuki, K., F. Li, S. Sone and K. Doi, 2005. Computer-aided diagnostic scheme for distinction between benign and malignant nodules in thoracic low-dose CT by use of massive training artificial neural network. IEEE Trans. Med. Imag., 24: 1138-1150. DOI: 10.1109/TMI.2005.852048
Wahyudi, W. Astuti and S. Mohamed, 2007. Intelligent voice-based door access control system using adaptive-network-based fuzzy inference systems for building security. J. Comput. Sci., 3: 274-280.
http://citeseerx.ist.psu.edu/viewdoc/download?doi= 10.1.1.165.8782&rep=rep1&type=pdf
Wu, D., M. Zhang, J.C. Liu and W. Bauman, 2006. On the adaptive detection of blood vessels in retinal images. IEEE Trans. Biomed. Eng., 53: 341-343. DOI: 10.1109/TBME.2005.862571
Yen, G.G. and W.-F. Leong, 2008. A sorting system for hierarchical grading of diabetic fundus images: A preliminary study. IEEE Trans. Inform. Technol.
Biomed., 12: 118-130. DOI:
10.1109/TITB.2007.910453
Zhang, X. and O. Chutatape, 2005. Top-down and bottom-up strategies in lesion detection of background diabetic retinopathy. Proceedings of the IEEE Computer Society Conference on Computer Vision and Pattern Recognition, June
20-25, pp: 422-428. DOI: