DOI: 10.1590/0004-282X20150178 ARTICLE
Corneal confocal microscopy in a healthy
Brazilian sample
Microscopia confocal em córneas de brasileiros saudáveis
Gabriela Dieckmann1,2, Camila Pupe1,2, Osvaldo J. M. Nascimento1,2
Corneal innervation, especially in the sub-basal epithelial plexus, is an important factor in the relex arc and is involved in corneal protection and corneal epithelium maintenance1,2. While
the plexus sub-basal epithelial has been studied using electron and light microscopy, these studies are hampered by the fact that corneal nerve ibers degenerate within 14 hours after death1. he
emergence of confocal microscopy adapted for in vivo use has al -lowed the study of all layers of the cornea, including its innerva -tion and its rela-tionship with Langerhans cells (LCs).
LCs are part of a main histocompatibility complex class II (MHCII) and work to transport tissue to capture, process, and present antigens3. As cells mature, they begin to have less
capacity to capture antigens and then turn into a strong stim -ulator of T lymphocytes. In general, the density changes and
number of LCs can help us understand the immune mech -anisms of the cornea4 as they are closely related to the
sub-basal epithelial plexus. hey increase in number and den -sity in inverse relation to the number and den-sity of the iber plexus in the presence of corneal infection (keratitis)5.
More recently, the assessment of LCs and unmyelinat -ed ibers in the cornea has become the subject of study for other medical specialties, particularly neurology. Corneal confocal microscopy (CCM) is a noninvasive method for di -agnosing and monitoring systemic diseases such as diabetic neuropathy6; fewer nerve bundles correlate with a loss of cor
-neal sensitivity and neuropathy severity in type 1 diabetic pa -tients. An early diagnosis of peripheral neuropathy is made by observing a reduction of sub-basal epithelial plexus ibers,
1Universidade Federal Fluminense, Programa de Pós-Graduação em Neurologia/Neurociências, Niteroi RJ, Brazil;
2Universidade Federal Fluminense, Hospital Universitário Antonio Pedro, Núcleo de Pesquisa Clínica em Neurologia e Neurociências - NeuroUPC, Niteroi RJ, Brazil.
Correspondence: Osvaldo J. M. Nascimento; Rua Siqueira Campos, 53/1204; 22031-071 Rio de Janeiro RJ, Brasil; E-mail: [email protected] Conflict of interest: There is no conlict of interest to declare.
Received 01 March 2015; Received in inal form 24 June 2015; Accepted 16 July 2015. ABSTRACT
Objective: This study aims to evaluate the characteristics of the corneal sub-basal plexus by performing in vivo confocal microscopy of healthy Brazilians to provide reference values for the Brazilian population. Method: This study is an observational, cross-sectional, descriptive study comparing corneas from 55 healthy Brazilian individuals across the age span of 20-70 years. Results: The average number of ibers was 5.35 ± 1.36, iber density was 33.4 ± 8.5 ibers per ield, and the mean number of Langerhans cells was 5.13 ± 8.10. A correlation between the average number of ibers and age showed an inverse relationship between the number and density of ibers and age for women (p < 0.05). In the multivariate analysis, each annual increase of age showed an average increase of 1.017 (95%CI: 1.008 to 1.026) in the number of Langerhans cells, adjusting for sex and thickness. Conclusion: Compared to other samples, this Brazilian population showed a higher average number of ibers, though further studies with a larger sample should be performed.
Keywords: cornea, confocal microscopy, Langerhans cells, ibers, age.
RESUMO
Objetivo: Este estudo tem como objetivo avaliar as características morfológicas do plexo sub-basal da córnea por microscopia confocal in vivo com indivíduos brasileiros saudáveis para fornecer uma referência para a população brasileira. Método: Este trabalho é um estudo observacional, descritivo, transversal comparativo com microscopia confocal de córnea a partir de 55 indivíduos brasileiros saudáveis na faixa etária de 70 ± 20 anos de idade. Resultados: Número médio de ibras foi 5,35 ± 1,36, a densidade foi de 33,4 ± 8,5 ibras por campo e de células de Langerhans foi 5,13 ± 8,10. Uma correlação entre o número médio de ibras e da idade dos indivíduos mostrou uma relação inversa entre o número e densidade de ibras, e idade para as mulheres, (p < 0,05). Na análise multivariada, cada aumento anual de idade apresentou um aumento médio de 1,017 (IC95%: 1,008-1,026) no número de células de Langerhans, ajustado para sexo e espessura. Conclusão: Em comparação com outras amostras, esta população brasileira apresentou um maior número médio de ibras embora estudos com número maior de amostras necessitem ser realizados.
which occurs even before a reduction in corneal sensitivity7.
Improved blood glucose levels in type 1 diabetic patients un -dergoing pancreas transplantation was shown to recover a number of nerve ibers.
Fabry disease also evolves with peripheral neuropathy and has been studied with CCM. It is characterized by a reduc -tion in the number and the density of nerve ibers in the plex -us sub-epithelial basement8. CCCM has also been employed
in diagnosing peripheral neuropathy in patients undergoing chemotherapy as some of these drugs can dose-dependently induce peripheral neuropathy9.
Reference levels are largely based on North American samples; it is unclear what Brazilian population values are. his study aims to evaluate the morphological character -istics of the sub-basal plexus with in vivo cornealCCM in healthy Brazilian individuals to provide reference values that may be used for comparison and future research.
METHOD
Design and study population
his was an observational, cross-sectional descriptive study conducted with a convenience sample of healthy in -dividuals referred from the Hospital Universitário Antonio Pedro (HUAP), Universidade Federal Fluminense (UFF). We included all individuals who signed the informed consent form, between 21 and 70 years of age, and of both sexes. We excluded subjects who had a history of trauma or corne -al diseases and/or peripher-al nerve disorders, had previous eye surgery, had a history of contact lens use, had more than 6 months of exposure to a potentially toxic drug to nerves and/or the cornea, or had cognitive and/or sensory deicits that would prevent them from performing the exam.
Data collection by in vivo CCM
he confocal microscope used in the study was an HRT II coupled to the cornea module from Heidelberg Engineering, Germany. he objective lenses were prepared with one drop of Vidisic® gel (Bausch Lomb), and another drop was instilled into the lower fornix of the patient’s conjunctiva. Anestalcon® (proparacaine HCl 0.5%, Alcon) anesthetic drops were in -stilled into the patient’s eye prior to initiation of the study.
he patient was positioned correctly and comfortably on the device and was oriented to ix their look for the examina -tion. he control of the central perpendicular alignment of the cornea was obtained by observing the red relex laser corneal shown on the handset screen. By identifying the well-focused epithelium in the corneal apex, images were captured at 0 microns depth for the irst picture. he focus deepened, and sequential images were recorded to the level of the posteri -or stroma. Images were acquired in sequence and separated at a distance of approximately 1 micron and a ixed ield of 0.16 mm². he same procedure was performed on both eyes.
he examination in both eyes lasted about 10 minutes. After capturing the images in both eyes, the Tomocap was discarded, and another drop of gel was instilled in the eye. he individual was then released and received guidance to instill lubricating eye drops during the day of the exam (of -fered to the individual).
he images obtained during the examination were 384 × 384 pixels over an area of 400 μm2 and were stored in the
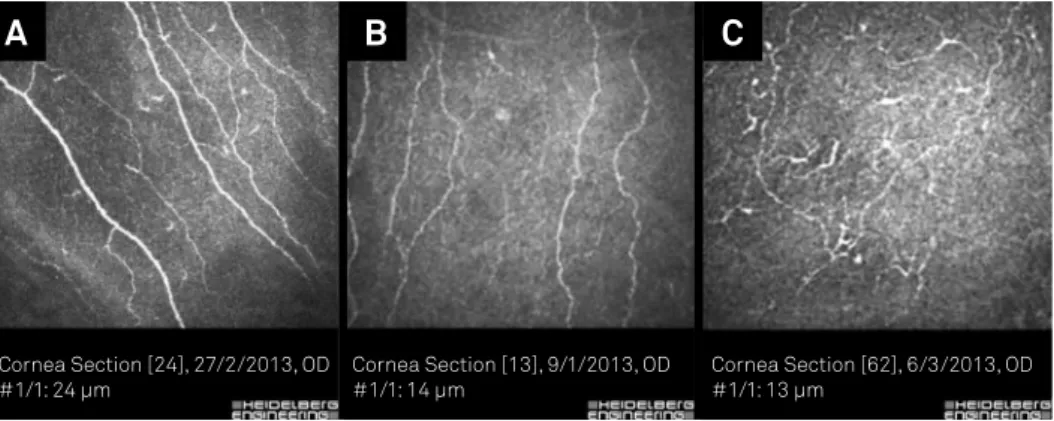
computer coupled to the confocal system. he 5 best pictures of the sub-basal plexus epithelial of each eye were selected for a total of 10 images per individual. he blinded images were separately evaluated by three observers: an ophthalmologist (G.D.) and two neurologists (C.P. and O.J.M.N.). he following parameters previously established were evaluated: number and iber density (deined as # of ibers × 0.16), number and LC density, degree of tortuosity (no ibers, grade 1 for parallel and slightly crooked ibers; grade 2 for twisted, non-parallel ibers; and grade 3 for tortuous ibers without direction), and thick -ness (categorized as thick, medium, or thin ibers) (Figure 1).
Statistical analysis
All statistical procedures were performed using the computer programs Microsoft Excel© and SPSS (Statistical
Package for Social Science) version 16.0 and statistical pro -gramming language R. Analyses were performed according to the following steps:
a) Description of variables and study population: a de -scriptive analysis of the population was performed by cal -culating the percentage distribution of the categories when the variables were categorical and the mean and standard deviation (SD) when variables were continuous or discrete. he following categorical variables were included: sex, iber tortuosity (parallel, not parallel, not parallel - same direction, not parallel - without direction), and thickness (none, ine, medium, large). All analyses were performed for the entire population and stratiied by sex.
b) Intra and inter-rater reliability: Fifty-ive healthy sub -jects were included. For each individual, 10 pictures were tak -en (5 of the each eye), totaling 550 individual photos, which were evaluated by 3 observers. For the degree of reliability of categorical variables, simple agreement was calculated (per -centage of concordant numbers), as were Cohen’s kappa co -eicients and their respective 95% conidence intervals (CIs) and weighted kappas. he criterion of Landis and Koch20 was
(Pearson correlation for variables with normal distributions and Spearman for those that were non-parametric).
c) Descriptive analysis of the variables: In this stage, due to the variables identiied in CCM to be evaluated by the three observers, the measurements were aggregated with the purpose of obtain -ing a diagnosis for each individual (consensus among observers). So for the number of ibers and LCs, the measures were grouped using the “average” of observers 1 and 3, with observer 2 exclud -ed due to low correlation with the others (see reliability analy -sis results). Categorical variables (tortuosity and thickness) were grouped using the measure of the “mode.” As the concordance rate was not 100% between observers, all were included with the third observer’s evaluation used in non-concordant cases. he variables of the study were explored and evaluated by age and sex. For continuous variables, mean comparisons were performed with the normality of those tested with the Kolmogorov-Smirnov and Shapiro tests. he diference of means was evaluated us -ing the Mann-Whitney U or Kruskal-Wallis H tests for variables with normal and non-parametric distributions, respectively. he relationships between age variables and CCM parameters were calculated by Pearson correlation (normal distributions) and Spearman (nonparametric variables). In relation to qualitative variables (categorical variables), the percentage diferences were evaluated using chi-square statistics. Fisher’s exact test was con -sidered when the expected frequencies were below 5%. he inlu -ences of age and sex on CCM parameters were also investigated using simple linear regression and multiple (continuous and nor -mally distributed variables) or generalized linear models (discrete or binary). Bivariate and multivariate analyzes were performed. he model it was performed using ANOVA (nested models) and the Akaike information criterion (AIC, not nested models). In all analyses, p < 0.05 was considered signiicant.
RESULTS
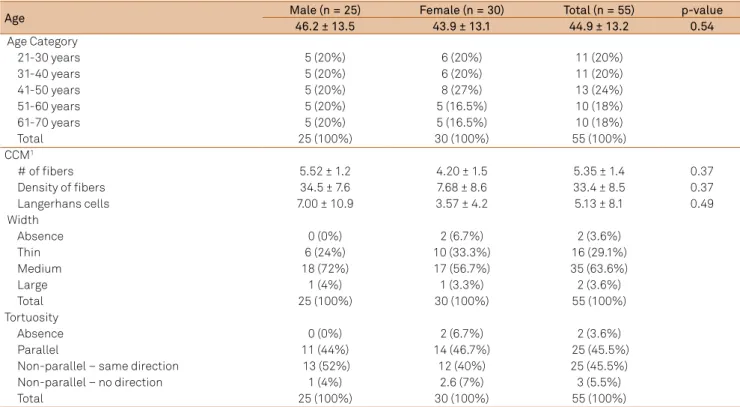
Of the 55 healthy individuals evaluated, there were be -tween 5-8 individuals per sex per age category. Within the age categories, there was no diference between the average
age of the males or females (Figure 2). In general, the average age was 44.9 ± 13.2, number of ibers 5.35 ± 1.36, iber den -sity 33.4 ± 8.5 ibers per ield, and LCs 5.13 ± 8.10 (Table 1). Considering the morphological iber characteristics, 45% had parallel ibers (tortuosity), and 63.6% had average thickness. No statistically signiicant diference was observed between sexes for the assessed variables including age, age category, and CCM parameters.
Inter- and intra-rater reliability
Reliability between and within observers was calculated using Cohen’s kappa, concordance correlation coeicient, and ICC. he results from the analysis of reliability revealed that observer 2 had low correlation with observers 1 and 3 and needed to be retrained on the scoring process. Data from all three observers is provided in the supplementary materi -als; however, due to the questionable validity of observer 2, we have excluded them from the results presented below (see Table 2 and Figure 3).
Inter- and intra-rater reliability showed “substan -tial” agreement between observers 1 and 3 for tortuosity (kappa = 0.75, 95%CI 0.70-0.80) and thickness (kappa = 0.80, 95%CI 0.76-0.85). Observations for the right and left eyes were similar to the total measurements.
Figure 1. Confocal microscope images of corneas showing (A) thick, parallel ibers; (B) parallel ibers of medium thickness; and (C) thin non-parallel, unorganized ibers.
Cornea Section [24], 27/2/2013, OD #1/1: 24 µm
Cornea Section [13], 9/1/2013, OD #1/1: 14 µm
Cornea Section [62], 6/3/2013, OD #1/1: 13 µm
A
B
C
Figure 2. Average age within each age category by sex.
26.4
38
48
56
65
26
37
47
56
66
0 10 20 30 40 50 60 70
21-30 31-40 41-50 51-60 61-70
No difference of sex within age groups
Table 1. Population characteristics - Corneal confocal microscopy.
Age Male (n = 25) Female (n = 30) Total (n = 55) p-value
46.2 ± 13.5 43.9 ± 13.1 44.9 ± 13.2 0.54
Age Category
21-30 years 5 (20%) 6 (20%) 11 (20%)
31-40 years 5 (20%) 6 (20%) 11 (20%)
41-50 years 5 (20%) 8 (27%) 13 (24%)
51-60 years 5 (20%) 5 (16.5%) 10 (18%)
61-70 years 5 (20%) 5 (16.5%) 10 (18%)
Total 25 (100%) 30 (100%) 55 (100%)
CCM1
# of ibers 5.52 ± 1.2 4.20 ± 1.5 5.35 ± 1.4 0.37
Density of ibers 34.5 ± 7.6 7.68 ± 8.6 33.4 ± 8.5 0.37
Langerhans cells 7.00 ± 10.9 3.57 ± 4.2 5.13 ± 8.1 0.49
Width
Absence 0 (0%) 2 (6.7%) 2 (3.6%)
Thin 6 (24%) 10 (33.3%) 16 (29.1%)
Medium 18 (72%) 17 (56.7%) 35 (63.6%)
Large 1 (4%) 1 (3.3%) 2 (3.6%)
Total 25 (100%) 30 (100%) 55 (100%)
Tortuosity
Absence 0 (0%) 2 (6.7%) 2 (3.6%)
Parallel 11 (44%) 14 (46.7%) 25 (45.5%)
Non-parallel – same direction 13 (52%) 12 (40%) 25 (45.5%)
Non-parallel – no direction 1 (4%) 2.6 (7%) 3 (5.5%)
Total 25 (100%) 30 (100%) 55 (100%)
Table 2. Data from all three observers.
Observer 1 Observer 2 Observer 3
Right eye Left eye Total Right eye Left eye Total Right eye Left eye Total
N % N % N % N % N % N % N % N % N %
Tortuosity*
Absence 4 2 8 3 12 2 5 2 29 10 34 6 0 0 6 2 6 1
Parallel 140 54 128 44 268 49 73 28 101 35 174 32 72 28 107 37 179 32
Not parallel, but in the same direction
104 40 123 42 227 41 132 51 108 37 240 44 157 60 155 53 312 57
Same direction 12 45 31 11 43 8 50 19 52 18 102 18 31 12 22 8 53 10
Total 260 100 290 100 550 100 260 100 290 100 550 100 260 100 290 100 550 100
Thickness*
Absence 4 2 8 3 12 2 5 2 29 10 34 6 1 0 6 2 7 1
Thin 69 26 106 37 175 32 61 24 48 17 109 20 128 49 115 40 243 44
Medium 162 62 165 57 327 60 138 53 129 44 267 48 118 45 130 45 248 45
Large 25 10 11 4 36 6 56 22 84 29 140 26 13 5 39 13 52 10
Total 260 100 290 100 550 100 260 100 290 100 550 100 260 100 290 100 550 100
Right eye Left eye Total
Conc. (%)
Kappa (95%CI)
Kappa pond.
Conc. (%)
Kappa (95%CI)
Kappa pond.
Conc. (%)
Kappa (95%CI)
Kappa pond. Tortuosity
Obs 1 & Obs 2 51% 0.250 0.16-0.33
0.314 46% 0.227
0.15-0.30
0.279 48% 0.240
0.18-0.30
0.296 Obs 1 & Obs 3 86% 0.749
0.67-0.82
0.767 84% 0.750
0.68-0.82
0.776 85% 0.750
0.70-0.80
0.774 Obs 2 & Obs 3 56% 0.307
0.22-0.39
0.346 46% 0.225
0.15-0.30
0.276 51% 0.266
0.20-0.32
0.309 Width
Obs 1 & Obs 2 66% 0.433 0.33-0.53
0.509 61% 0.402
0.32-0.48
0.500 64% 0.419
0.36-0.48
0.510 Obs 1 & Obs 3 90% 0.810
0.75-0.88
0.802 88% 0.790
0.72-0.85
0.814 89% 0.803
0.76-0.85
0.812 Obs 2 & Obs 3 66% 0.429
0.33-0.52
0.480 58% 0.359
0.27-0.44
0.470 62% 0.395
0.33-0.45
Regarding the continuous variables, the number and density of ibers and LCs were evaluated with Spearman’s correlation. Once again, the number of ibers was more high -ly correlated between observers 1 and 3 with values 0.912, 0.904, and 0.913 for total, right, and left eye measures, re -spectively. For LCs, the correlation between viewers 1 and 3 reached 0.950 for the right and left eyes.
Considering intra-observer reliability, the 10 pictures for each patient were evaluated using the ICC correction. he results show low variability within each observer and for the variables studied. As expected, for the 10 evaluated photos (5 right and 5 left eyes) the pictures of the same sub -ject and ob-ject were highly consistent. LCs had the high -est intra-observer reliability with a total ICC = 0.96 and 95%CI 0.93-0.97. For the number of ibers, the results were similar when separately measuring the right (ICC = 0.82, 95%CI 0.53-0.91) or left eye (ICC = 0.87, 95%CI 0.71-0.93), with greater variability for the right eye. For all observers, there was an ICC of 0.85 and, 95%CI 0.65-0.92.
Evaluation of CCM variables
he correlation between the average number of ibers and subject age showed an inverse relationship between i -ber num-ber and density and age in women; that is, there was a reduction in the number and density of ibers with increas -ing age for women (p < 0.05, Figure 4).
he relationships between demographic variables, thick -ness, and tortuosity with the number of LCs were veriied by means of generalized linear models with Poisson mod -el (used for quantiiable variables). In univariate analysis, there was a statistically signiicant relationship between age, sex, and thickness (p < 0.001); therefore, all these variables were included in the multivariate model. hese variables re -mained signiicant in the model (p < 0.001). he results indi -cate that a 1-year increase in age corresponded with an av -erage increase of 1.017 (95%CI: 1.008-1.026) in the number of LCs, adjusting for sex and thickness. Similarly, the aver -age number of LCs among women was 35% lower than for
men, adjusted for the efect of age and thickness (odds ra -tio [OR] = 0.645, 95%CI: 0.500-0.831). Moreover, the average number of LCs among those with ibers with medium or large thickness was 1.13 times higher compared with those of thin ibers by controlling the efects of age and sex (OR = 2.13, 95%CI: 1.531-2.978). However, there were two outliers that should be considered in these results (Figure 5).
0 1 2 3 4 5 6 7 8
21-30 31-40 41-50 51-60 61-70
Male Female
Figure 4. Average numbers of ibers by age group and sex.
1
Observer
2 3 1
Observer 2 3 0 20 40 60 0 2 6 10 12 4 8
Number of fibers Langerhans cells
A
B
Figure 3. Data from all three observers.
5.5
5 13
5 5
4.8
0 3
5 5
1 5 0 2 4 6 8 10 12 14 excluding outlier excluding outlier 21-30 31-40 41-50 51-60 61-70 31-40 61-70
21-30 *
Age group Age group
31-40 41-50 51-60 61-70 * Female 21-30 31-40 41-50 51-60 61-70 * * * Male 0 10 20 30 40 50 0 10 20 30 40 50
Male Female
A
B
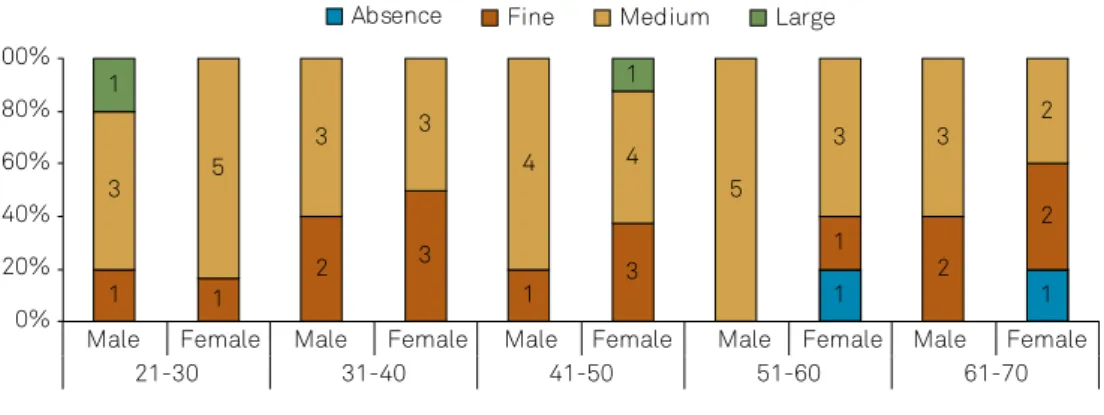
No statistically signiicant percentage diference was not -ed between demographic variables and iber characteristics (tortuosity and thickness) (Figures 6 and 7).
Discussion
We analyzed 550 images from 55 healthy volunteers and found an inverse relationship between iber number and age, with a decrease of 0.148 ibers for each additional year of age. his reduction was higher in females. We also observed that older individuals had more tortuous and thinner nerve ibers. his study is the irst of its kind in a Brazilian population.
Other studies evaluating the density of ibers per ield are shown in Table 34,10,11,12. Only studies using the same methodol
-ogy employed here were included. Our population had a great -er mean numb-er of ib-ers p-er ield than the oth-er studies.
Regarding the density of nerve ibers of the sub-basal epithe -lial plexus, there is variation depending on the type of confocal microscope used. Confocal microscopes can be laser scanning, scanning slit lamp, or tandem type. he diferences between these microscopes are lighting intensity and type, resolution, and image contrast. Another issue exists regarding the deinition of the method for measuring iber density of the sub-basal epithelial
plexus. Some authors consider the total length of nerve ibers vis -ible in a deined area in mm2 13, while other authors14 consider the
sum of the number of nerve ibers by ield. In our study, we used a laser scanning microscope type and measured the density of nerve ibers as visible ibers per ield microns per mm2. Analyses
were made only through observation; no automated method was used. A clinical evaluation performed by a trained specialist is equivalent to results obtained with automated methods13,14,15. We
cannot deinitively say that there were no diferences between these methodologies; however, there was no perceived compro -mise of the technique regarding our results.
Parissi’s group12 evaluated 207 healthy eyes in subjects
aged 88 ± 15 years and also found a negative correlation be -tween nerve iber density and age, reporting a decrease of 0.25% to 30% per year, regardless of sex, eye studied, or meth -odology used to delineate the nerve ibers. In accordance with earlier indings16,17,an inverse relationship was found
between nerve iber density and age. In our work, similar to the indings of Niederer4, this inverse correlation was more
signiicant in women. For each 1-year increase in age, there is a reduction in the number of ibers (-0.148). Dehaghani’s group18 carried out a 3-year longitudinal study and reported
1 1
1 1
2 3
1 3
1
2
2
3 5
3 3
4 4
5
3 3
2
1 1
0% 20% 40% 60% 80% 100%
Absence Fine Medium Large
Male Female Male Female Male Female Male Female Male Female
21-30 31-40 41-50 51-60 61-70
Figure 7. Fiber width by age group, sex, and type. The numbers within the bars represent the numbers of patients with the speciied shaded type.
1 1
3
5
2 3
3
2 1
2
2
2 2
1
3 3
2
5 4
2
2 1
1 1 1
0% 20% 40% 60% 80% 100%
Male Female Male Female Male Female Male Female Male Female
21-30 31-40 41-50 51-60 61-70
Absence Parallel Not parallel - Same direction Not parallel - No direction
References
1. Cruzat A, Pavan-Langston D, Hamrah P. In vivo confocal microscopy of corneal nerves: analysis and clinical correlation. Semin Ophthalmol. 2010; 25(5-6):171-7. doi:10.3109/08820538.2010.518133
2. Oliveira-Soto L, Efron N. Morphology of corneal nerves in soft contact lens wear. A comparative study using confocal microscopy. Ophthalmic Physiol Opt. 2003; 23(2):163-74. doi:10.1046/j.1475-1313.2003.00106.x
3. Schrems-Hoesl LM, Schrems WA, Cruzat A, Shahatit BM, Bayhan HA, Jurkunas U V, et al. Cellular and subbasal nerve alterations in early stage Fuchs’ endothelial corneal dystrophy: an in vivo confocal microscopy study. Eye (Lond). 2013;27(1):42-9. doi:10.1038/eye.2012.220
4. Niederer RL, Perumal D, Sherwin T, McGhee CNJ. Age-related differences in the normal human cornea: a laser scanning in vivo confocal microscopy study. Br J Ophthalmol. 2007;91(9):1165-9. doi:10.1136/bjo.2006.112656
5. Cruzat A, Witkin D, Baniasadi N, Zheng L, Ciolino JB, Jurkunas U V, et al. Inlammation and the nervous system: the connection in the cornea in patients with infectious keratitis. Invest Ophthalmol Vis Sci. 2011;52(8):5136-43. doi:10.1167/iovs.10-7048
6. Pupe CCB. Estudo das alterações morfológicas do plexo sub-basal epitelial da córnea através da microscopia confocal in vivo em pacientes
com polineuropatia diabética sintomática comparados a controles [Thesis]. Rio de Janeiro: Universidade Federal Fluminense; 2014.
7. Rosenberg ME, Tervo TM, Immonen IJ, Müller LJ, Grönhagen-Riska C, Vesaluoma MH. Corneal structure and sensitivity in type 1 diabetes mellitus. Invest Ophthalmol Vis Sci. 2000;41(10):2915-21.
8. Tavakoli M, Marshall A, Thompson L, Kenny M, Waldek S, Efron N, et al. Corneal confocal microscopy: a novel noninvasive means to diagnose neuropathy in patients with Fabry disease. Muscle Nerve. 2009;40(6):976-84. doi:10.1002/mus.21383
9. Ferrari G, Nalassamy N, Downs H, Dana R, Oaklander AL. Corneal innervation as a window to peripheral neuropathies. Exp Eye Res. 2013;113:148-50. doi:10.1016/j.exer.2013.05.016
10. Patel D V, Ku JYF, Johnson R, McGhee CNJ. Laser scanning in vivo confocal microscopy and quantitative aesthesiometry reveal decreased corneal innervation and sensation in keratoconus. Eye (Lond). 2009;23(3):586-92. doi:10.1038/eye.2008.52
11. Niederer RL, Perumal D, Sherwin T, McGhee CNJ. Corneal innervation and cellular changes after corneal transplantation: an in vivo confocal microscopy study. Invest Ophthalmol Vis Sci. 2007;48(2):621-6. doi:10.1167/iovs.06-0538
Table 3. Comparable studies.
Authors Country Age range Sample size Density Standard deviation
Patel et al., 200910 New Zealand 37 ± 10 31 eyes 25.9 7
Niederer et al., 200711 New Zealand 45 ± 17 30 eyes 21.6 5.91
Parissi et al., 201312 Norway 88 ± 15 207 eyes 19 5.1
Niederer et al., 20074 New Zealand 38 ± 16 170 eyes 20.3 6.5
Current Study Brazil 70 ± 21 110 eyes 33.4 8.5
that a reduction of 0.05 mm/mm2 in the total length of the
nerve iber per ield per year increased with age, but they did not observe diferences between males and females.
As seen in Figure 2, the average number of ibers by age group and sex may be misleading. We observed a greater av -erage number of ibers in the 20-30-year-old female group and then from the age of 30 onwards the average number re -duces to 5 and remains consistent across until age 70. his initial elevation gives rise to an annual decrease of 0.148; however, this may actually represent a shorter time-span, possibly decreasing from adolescence and plateauing after 30. his diference may disappear with a greater number of participants; therefore, the study should be repeated with a larger sample. It should be noted though that this trend of de -creasing ibers in women over time has been reported by sev -eral other groups4,18; thus, the current literature lends itself to
validating our indings rather than representing an artifact from a limited sample size.
Regarding nerve fiber tortuosity, our results as well as the others14 showed that most of the fibers were ori
-ented in a direction perpendicular to the axis and slightly crooked. Individuals over the age of 30 years were more likely to have no parallel fibers, fewer perpendicular fibers, and more itytortuosity.
In our study of LCs, we found an age-dependent increase in the number. In individuals younger than 30 years, the prev -alence of the cells was lower for females. he average num -ber of cells for women was 35% lower than for men adjusted for the efect of age and sex. Our indings are consistent with other works evaluating LCs19.
Due to the two patients in our study who had an extreme -ly high number of LCs for unknown reasons, the variation we saw was far greater than in other studies5, 3.0 ± 0.4 per ield
compared to our 5.1 ± 8.10 cells/mm2. his variation between
the two studies is as expected for the technique. However, the reason for increased LCs in these two patients, who were reportedly healthy, is unclear. A study by Cruzat and col -leagues5 demonstrated a correlation between plexus epithe
-lial sub-basal zone, or the peripheral nervous system, and the cornea immune response. Assessing patients with infectious corneal keratitis, the authors reported a decrease in the num -ber of nerve i-bers and hence an increase in LC density in the acute phase of the disease.
12. Parissi M, Karanis G, Randjelovic S, Germundsson J, Poletti E, Ruggeri A, et al. Standardized baseline human corneal subbasal nerve density for clinical investigations with laser-scanning in vivo confocal microscopy. Invest Ophthalmol Vis Sci. 2013;54(10):7091-102. doi:10.1167/iovs.13-12999
13. Patel D V, McGhee CNJ. In vivo confocal microscopy of human corneal nerves in health, in ocular and systemic disease, and following corneal surgery: a review. Br J Ophthalmol. 2009;93(7):853-60. doi:10.1136/bjo.2008.150615
14. Oliveira-Soto L, Efron N. Morphology of corneal nerves using confocal microscopy. Cornea. 2001;20(4):374-84. doi:10.1097/00003226-200105000-00008
15. Dabbah MA, Graham J, Petropoulos IN, Tavakoli M, Malik RA. Automatic analysis of diabetic peripheral neuropathy using multi-scale quantitative morphology of nerve ibres in corneal confocal microscopy imaging. Med Image Anal. 2011;15(5):738-47. doi:10.1016/j.media.2011.05.016
16. Grupcheva CN, Wong T, Riley AF, McGhee CNJ. Assessing the sub-basal nerve plexus of the living healthy human cornea by in vivo confocal microscopy. Clin Experiment Ophthalmol. 2002;30(3):187-90. doi:10.1046/j.1442-9071.2002.00507.x
17. Niederer RL, McGhee CNJ. Clinical in vivo confocal microscopy of the human cornea in health and disease. Prog Retin Eye Res. 2010;29(1):30-58. doi:10.1016/j.preteyeres.2009.11.001
18. Dehghani C, Pritchard N, Edwards K, Russell AW, Malik RA, Efron N. Fully automated, semiautomated, and manual morphometric analysis of corneal subbasal nerve plexus in individuals with and without diabetes. Cornea. 2014; 33(7):696-702. doi:10.1097/ICO.0000000000000152
19. Zhivov A, Stave J, Vollmar B, Guthoff R. In vivo confocal microscopic evaluation of Langerhans cell density and distribution in the normal human corneal epithelium. Graefes Arch Clin Exp Ophthalmol. 2005;243(10):1056-61. doi:10.1007/s00417-004-1075-8