Proile and long-term prognosis of glucose tight
control in intensive care unit - patients: a cohort study
Peril e prognóstico a longo prazo dos pacientes que recebem
terapia insulínica em unidades de terapia intensiva
clínico-cirúrgica: estudo de coorte
INTRODUCTION
Stress-induced hyperglycemia is frequent in intensive care unit (ICU) patients, and is associated with increased mortality and morbidity both in diabetic and non-diabetic patients.(1) he mechanisms involved in these
pa-tients’ worsened outcome may be related to suppressive efects of immune function and increased risk of associated infection, endothelial dysfunction, hepatocyte mitochondrial injury, and possible tissue ischemia for acidosis or inlammation.(2)
Márcia Inês Bof1, Márcio Pereira
Hetzel2, Daniele Munaretto
Dallegrave2, Roselaine Pinheiro de
Oliveira2, Claúdia da Rocha Cabral3,
Cassiano Teixeira2,4
1. Physician - Complexo Hospitalar da Santa Casa de Porto Alegre - Porto Alegre (RS), Brazil.
2. Physician - Intensive Care Unit - Complexo Hospitalar da Santa Casa de Porto Alegre - Porto Alegre (RS), Brazil. 3. Nurse, Post-Graduate Intensive Care Nursing Course - Universidade do Vale do Rio dos Sinos – UNISINOS – Porto Alegre (RS), Brazil.
4. Associate Professor - Universidade Federal de Ciências da Saúde de Porto Alegre - UFSCPA - Porto Alegre (RS), Brazil.
ABSTRACT
Objectives: Stress-induced
hy-perglycemia is frequent in critically ill patients and has been associated with increased mortality and mor-bidity (both in diabetic and non-diabetic patients). This study objec-tive was to evaluate the profile and long-term prognosis of critically ill patients undergoing tight glucose-control.
Methods: Prospective cohort. All patients admitted to the intensive care unit over 1-year were enrolled. We analyzed demographic data, therapeutic intervention, and short- (during the stay) and long-term (2 years after discharge) mortality. The patients were categorized in 2 groups: tight glucose control and non-tight glucose-control, based on the unit staff decision.
Results: From the 603 enrolled patients, 102 (16.9%) underwent tight control (glucose <150 mg/dL) while 501 patients (83.1%) non-tight
control. Patients in the TGC-group were more severely ill than those in the non-tight control group [APACHE II score (14 ± 3 versus11 ± 4, P=0.04), SOFA (4.9 ± 3.2 versus 3.5 ± 3.4, P<0.001) and TISS-24h (25.7 ± 6.9 versus 21.1 ± 7.2, P< 0.001)]. The tight control group patients also had worse prognosis: [acute renal failure (51% versus 18.5%, P<0.001), criti-cal illness neuropathy (16.7% versus 5.6%, P<0.001)] and increased mor-tality (during the ICU-stay [60.7% versus 17.7%, P<0.001] and within 2-years of the discharge [77.5% ver-sus23.4%; P<0.001]).
Conclusion: Critically ill patients needing tight glucose control during the unit stay have more severe disease and have worse short and long-term prognosis.
Keywords: Blood
glucose/analy-sis; Hyperglycemia/prevention & con-trol; Insulin/therapeutic use; Hypogly-cemic agents/therapeutic use; Progno-sis; Intensive care
Study developed at the Central Intensive Care Unit - Complexo Hospitalar da Santa Casa de Porto Alegre - Porto Alegre (RS), Brazil.
he authors declare no conlict of interest in this trial conduction or publication.
Submitted on December 14, 2008 Accepted on November 24, 2009
Author for correspondence: Cassiano Teixeira
Rua Riveira, 355 / 403
CEP: 90670-160 - Porto Alegre (RS), Brazil.
Hyperglycemia predisposes to sodium, potassium and phosphorus imbalances.(3) Osmotic diuresis,
sec-ondary to serum hyperosmolarity, may cause symptom-atic hyponatremia. Hypokalemia increases arrhythmias likelihood, and hypophosphatemia may afect platelet and leucocytes functions. Some microorganisms may have increased virulence in hyperglycemic environ-ments.(3)
A randomized clinical trial in 2001(4) showed that
tight glucose control in critically ill surgical patients reduced the in-hospital mortality. Extrapolation from these septic patients has added this therapeutic ap-proach to treatment of these patients.(5,6) However, later
randomized clinical trials(7-9) failed to show this beneit
in critically ill surgical and clinical ICU patients. Controversies keep surging, thus, on this established and worldwide applied approach in the ICU setting. Taking this into consideration, this study objective is to draw the proile of patients in need of tight glucose control in the ICU setting, and to evaluate their short- (during the ICU stay) and long-term (within 2 years after the ICU discharge) mortality.
METHODS
his is a retrospective cohort study, where all pa-tients admitted to an 18-beds university hospital clini-cal and surgiclini-cal ICU between January 2007 and Janu-ary 2008 were included. he study was approved by the Institution’s Ethics Committee.
Were studied the following variables: age, gender, associated comorbidities, reason for ICU admission (with or without sepsis), severity scores as the Acute Physiology and Chronic Health Evaluation (APACHE II), Glasgow Coma Scale, Sequential Organ Failure As-sessment (SOFA), herapeutic Intervention Scoring System (TISS) plus within the irst 24 hours (TISS-24h), ICU stay length, mechanic ventilation (MV) need, acute renal failure (ARF) with or without dialysis support. Additionally, clinically relevant outcomes were also analyzed as acute myocardial infarction (AMI), brain stroke, critical illness polyneuropathy (CIPN), pressure sores and ICU mortality. After ICU discharge, the investigators followed the patients’ hospital devel-opment up as well as made phone contacts with the patient or close family members (2 years after the ICU discharge) in order do deine the patients’ vital status. he Informed Consent Form (ICF) was sent by mail to the patients’ home along with a postage-paid envelope.
For the data evaluation, the patients were
catego-rized in two groups: with tight insulin glucose control started by the ICU staf (TGC group), and non-tight insulin glucose control patients (NTGC group).
Statistical analysis
he data were expressed as mean ± standard devia-tion (SD) or percent. he categorical variables were analyzed with the Chi-square test and Fisher test; the numerical variables with the t Student test for inde-pendent samples. A P<0.05 was considered signiicant. he variables which under univariate analysis appeared to increase the risk of death, were analyzed by logis-tic regression multivariate analysis. Relative risks (RR) with 95% conidence intervals (95% CI) were calcu-lated. he data were analyzed using the SPSS version 16.0 software (Statistical Package for Social Science, Inc., Chicago IL, USA).
RESULTS
Of the 603 patients admitted to the ICU during 12 months, 102 (16.9%) underwent continued insulin ad-ministration for tight glucose control (capillary insulin < 150 mg/dL), while the remainder patients (n=501; 81.3%) did not need this control.
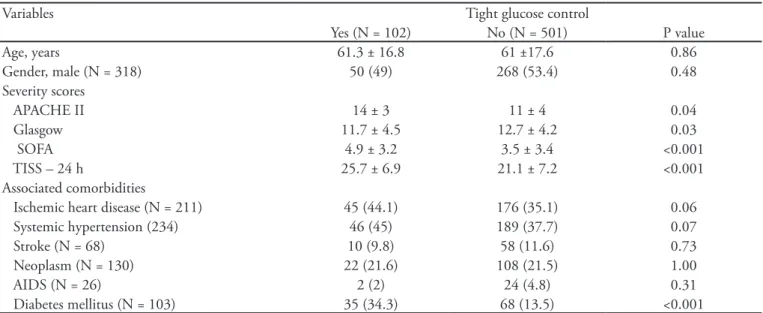
Table 1 presents the patients’ characteristics. he mean age was similar between the groups (61.3 ± 16.8 years versus 61 ± 17.6 years), as well as were the male gender (49% versus 53.4%) and patients’ comorbidities. Only the diabetics group was larger in the TGC group (34.3% versus 13.5%; P<0.001). Patients who needed TGC were more severely ill than those in NTGC group – APACHE II score (14±3 versus 11±4; P=0.04), SOFA score (4.9 ± 3.2 versus 3.5 ± 3.4; P<0.001), Glasgow score (11.7±4.5 versus 12.7±4.2; P=0.03), TISS within the irst 24 hours (25.7±6.9 versus 21.1±7.2; P<0.001).
Regarding the ICU admission cause, presence or absence of sepsis was underlined. From all cases, 330 patients were admitted for sepsis, and 234 (70.9%) were diagnosed septic shock. From these, in 70 the in-sulin protocol was used, and in 164 was not. he septic shock mounted 68.6% of the TGC group patients, and only 32.7% of the NTGC patients.
P<0.001) and increased MV need (88.2% versus 51.5%; P<0.001) were seen in TGC patients. Table 4 shows the multivariate variables analysis for the vari-ables which, in the univariate analysis, suggested in-creased patients’ mortality. Insulin therapy need had
Table 1 -Patients characteristics
Variables Tight glucose control
Yes (N = 102) No (N = 501) P value
Age, years 61.3 ± 16.8 61 ±17.6 0.86
Gender, male (N = 318) 50 (49) 268 (53.4) 0.48
Severity scores
APACHE II 14 ± 3 11 ± 4 0.04
Glasgow 11.7 ± 4.5 12.7 ± 4.2 0.03
SOFA 4.9 ± 3.2 3.5 ± 3.4 <0.001
TISS – 24 h 25.7 ± 6.9 21.1 ± 7.2 <0.001
Associated comorbidities
Ischemic heart disease (N = 211) 45 (44.1) 176 (35.1) 0.06 Systemic hypertension (234) 46 (45) 189 (37.7) 0.07
Stroke (N = 68) 10 (9.8) 58 (11.6) 0.73
Neoplasm (N = 130) 22 (21.6) 108 (21.5) 1.00
AIDS (N = 26) 2 (2) 24 (4.8) 0.31
Diabetes mellitus (N = 103) 35 (34.3) 68 (13.5) <0.001
APACHE - Acute Physiology and Chronic Health Evaluation; SOFA - Sequential Organ Failure Assessment; TISS - herapeutic Intervention Sco-ring System; AIDS - Acquired Immunodeiciency Syndrome. Results expressed as N(%), mean ± standard deviation.
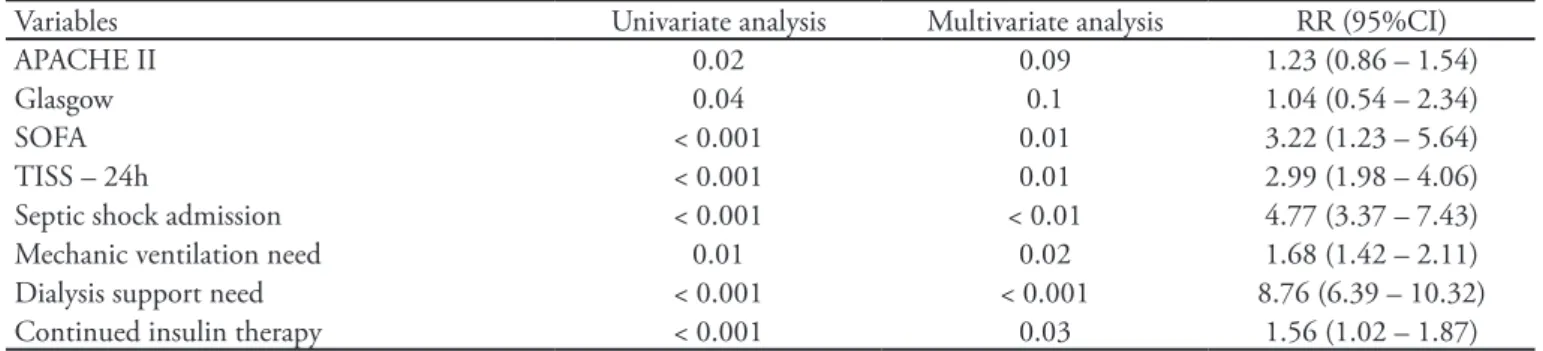
1.56 (95%CI 1.02-1.87) RR for death, however widely below the relative risk for ICU admission for septic shock [4.77 (95%CI 3.37-7.43)], ventilatory support need [1.68 (95%CI 1.42-2.11)] and dialysis need [8.76 (95%CI 6.39-10.32)].
Table 2 - Clinical outcomes and mortality
Variables Tight glucose control
Yes (N = 102) No (N = 501) P value Clinical relevant outcomes
AMI (N = 16) 1 (1) 15 (3) 0.49
Stroke (N = 21) 6 (5.9) 15 (3) 0.14
Acute renal failure (N = 145) 52 (51) 93 (18.5) <0.001 Polyneuropathy (N = 45) 17 (16.7) 28 (5.6) <0.001 Pressure sore (N = 80) 36 (35.3) 44 (8.8) <0.001 Mortality (N = 151) 62 (60.7) 89 (17.7) <0.001 AMI - acute myocardial infaction. Results expressed as N(%).
Table 3 – Intensive care unit-related admission intermediate outcomes
Variables Tight glucose control
Yes (N = 102) No (N = 501) P value Admission for sepsis (N = 330) 78 (76.5) 252 (50.2) <0.001 Septic shock (N = 234) 70 (68.6) 164 (32.7) <0.001
ICU stay (days) 19 ± 21 9 ± 20 <0.001
Figure 1 displays the patients’ survival during the 2 years follow-up. he total ICU mortality was 25% (151/603 patients) and was higher in the TGC group (60.7% versus 17.7%; P<0.001). his signiicant difer-ence increased during the hospital stay (71.6% versus 20.6%; P<0.001) and within the irst 6 months after the hospital discharge (73.6% versus 22.2%; P<0.001), keeping constant within the next 18 months follow-up.
DISCUSSION
his retrospective cohort study showed that tight glucose control need, using continued insulin proto-cols, is a severity marker for poorer prognosis in ICU patients, also relecting increased long-term mortality.
Tight glucose control, using the institution’s con-tinued insulin protocols, in critically ill patients is ad-opted worldwide and mentioned as recommendation
in important Guidelines as the 2004 Surviving Sep-sis Campaign,(5) and the recommendation was
main-tained in the 2008 update.(6) This is also referenced by
important medical associations such as the American Association of Clinical Endocrinologists(10) and the
American Diabetes Association.(11) Van den Berghe et
al.(4) showed reduced mortality in patients
random-ized for the tight glucose control group between 80 and 110 mg/dL (4.6% versus 8%; P<0.04). How-ever, later studies, conducted in more heterogeneous populations (clinical and clinical-surgical ICUs) did not share their optimism. Treggiari et al.(12) included
10,456 critically ill polytrauma patients, most of them surgical, and showed a trend to increased ICU mortal-ity (OR: 1.15; 95%CI: 0.98-1.35) for the tight glu-cose control patients. Van der Berghe et al.(7), with
predominantly clinical patients, did not evidence re-duced hospital mortality in the TGC group (37.3%
Table 4 – Multivariate analysis of mortality increase-related factors
Variables Univariate analysis Multivariate analysis RR (95%CI)
APACHE II 0.02 0.09 1.23 (0.86 – 1.54)
Glasgow 0.04 0.1 1.04 (0.54 – 2.34)
SOFA < 0.001 0.01 3.22 (1.23 – 5.64)
TISS – 24h < 0.001 0.01 2.99 (1.98 – 4.06)
Septic shock admission < 0.001 < 0.01 4.77 (3.37 – 7.43) Mechanic ventilation need 0.01 0.02 1.68 (1.42 – 2.11) Dialysis support need < 0.001 < 0.001 8.76 (6.39 – 10.32) Continued insulin therapy < 0.001 0.03 1.56 (1.02 – 1.87) RR – relative risk; APACHE - Acute Physiology and Chronic Health Evaluation; SOFA - Sequential Organ Failure Assessment; TISS - herapeutic Intervention Scoring System.
Survivors number ICU admission ICU discharge Hospital discharge 6m 12m 18m 24m
TGC 102 40 29 27 24 23 23
NTGC 501 412 398 390 387 385 384
ICU – Intensive Care Unit; TGC – Tight Glucose Control; NTGC – Non-Tight Glucose Control; m - months Results expressed as percent of patients in the igure and number of patients in the table.
versus 40%), except for the subgroup who stayed in the ICU for 3 or more days (43% versus 52.5%;
P=0.009). In our study we identified increased ICU mortality for the TGC group as compared with the NTGC group (60.7% versus 17.7%; P<0.001), with a death RR 1.56 (95%CI: 1.02-1.87). However we stress that this finding is related to the TGC group pa-tients’ severity, according to worse APACHE II, SOFA, TISS-24h, TISS-72h scores and more frequent ICU admission for septic shock, showing a risk of death above the insulin therapy need. Additionally, these patients developed more acute renal failure, critical ill patient polyneuropathy and pressure sores, and stayed longer in the ICU and had longer time under MV, thus underlying their severity. In a 2008 metanaly-sis(13) including 29 clinical trials and n=8,432, tight
glucose control was associated with significant reduc-tion of sepsis, RR 0.76 (95%CI 0.59-0.97) in surgi-cal patients. A recent study(14) showed that 90 days
after randomization, tight glucose control increased the absolute risk of death in 2.6 percent point, differ-ence which was sustained after adjustment for possible confounding factors. Considering these findings, the authors left a message on they do non-recommenda-tion of such a rigorous control, as those established by the Guidelines for critically ill patients.
Diener et al.(15) and Azevedo et al.(16) showed no
difference in hospital mortality between the groups (TGC versus NTGC), neither showed differences regarding neurological post-discharge recovery. Our study did not evaluate neurological sequelae; only mortality rates.
Previously, two DIGAMI sequential studies(17,18)
evaluating long-term prognosis showed diferent re-sults. he irst one showed that tight glucose control reduced the mortality by 29% after one year in patients admitted to the hospital following acute myocardial infarction. However, the second didn’t conirm this inding in a similar population. In our study, analyzing the data 2 years after the hospital discharge, we found increased TGC group mortality (77.5% versus 23.4%;
P<0.001). hus, the tight glucose control, using con-tinued insulin protocol during ICU stay, was a marker for increased mortality in patients, even in long-term (2 years after ICU discharge).
We reiterate that this cohort did not aim to evalu-ate if tight glucose control has a direct inluence on the outcomes, but to preview the severity in patients undergoing this intervention, and mainly, their long-term prognosis.
CONTRIBUTIONS
Márcia Inês Bof, Cassiano Teixeira and Cláudia da Rocha Cabral reviewed the literature and wrote the manuscript. Rose-laine Pinheiro de Oliveira, Márcio Pereira Hetzel and Daniele Munaretto Dallegrave collected data and signiicantly contrib-uted to the article. Cassiano Teixeira performed the statistical analysis. Márcia Inês Bof assures these data accuracy.
ACKNOWLEDGEMENTS
he authors acknowledge the Central ICU – Complexo Hospitalar da Santa Casa technical staf for their patience and cooperation in the data collection and study performance.
RESUMO
Objetivos: Hiperglicemia induzida por estresse ocorre com freqüência em pacientes criticamente doentes e tem sido associada a aumento de mortalidade e morbidade tanto em pacientes diabéticos, quanto em não diabéticos. O objetivo deste estudo foi avaliar o peril e prognóstico a longo prazo dos pacientes críticos que recebem tera-pia insulínica contínua na unidade de teratera-pia intensiva.
Métodos: Coorte prospectiva, em que foram estudados os pa-cientes internados na unidade de terapia intensiva no período de 1 ano. Foram analisadas variáveis demográicas, escores de gravidade e o prognóstico a curto na unidade de terapia intensiva, e a longo prazo (2 anos da alta da unidade de terapia intensiva). Os pacientes foram classiicados em 2 grupos: pacientes que receberam terapia insulínica contínua para controle glicêmico indicada pela equipe da unidade de terapia intensiva e pacientes que não receberam terapia insulínica.
Resultados: Dos 603 pacientes incluídos no estudo, 102 (16,9%) receberam terapia insulínica contínua, objetivando níveis glicêmicos <150 mg/dL e 501 pacientes (83,1%) não receberam insulina con-tínua. Os pacientes que necessitaram terapia insulínica contínua eram mais graves que os do grupo não necessitou de terapia insulínica: escore APACHE II (14 ±3 versus 11 ±4; p =0,04), escore SOFA (4,9 ±3,2 versus 3,5 ±3,4; p <0,001) e TISS das 24h (25,7 ±6,9 versus 21,1 ±7,2; p <0,001). Os pacientes do grupo que recebeu terapia insulínica contínua tiveram também pior prognóstico: insuiciência renal aguda (51% ver-sus 18,5%; p <0,001), polineuropatia da doença crítica (16,7% versus 5,6%; p <0,001)] e maior mortalidade [na unidade de terapia intensiva (60,7% versus 17,7%; p <0,001) e 2 anos após a alta da unidade de terapia intensiva (77,5% versus 23,4%; p <0,001).
Conclusão: A necessidade de controle glicêmico rigoroso através do uso de protocolos de insulina contínua é um marcador de gravi-dade e de pior prognóstico dos pacientes internados na unigravi-dade de te-rapia intensiva, reletindo também maior mortalidade a longo prazo.
REFERENCES
1. Yendamuri S, Fulda GJ, Tinkof GH. Admission hyper-glycemia as a prognostic indicator in trauma. J Trauma. 2003;55(1):33-8.
2. Langouche L, Vanhorebeek I, Vlasselaers D, Vander Perre S, Wouters PJ, Skogstrand K, et al. Intensive insulin thera-py protects the endothelium of critically ill patients. J Clin Invest. 2005;115(8):2277-86.
3. hompson MJ, Rossini AA, Mordes JP. Management in diabetes critically ill patients. In: Irwin RS, Rippe JM. Irwin and Rippe’sintensive care medicine. 6th ed. Phila-delphia: Lippincott Willians & Wilkins; 2008. p. 1245-55.
4. van den Berghe G, Wouters P, Weekers F, Verwaest C, Bruy-ninckx F, Schetz M, et al. Intensive insulin therapy in the critically ill patients. N Engl J Med. 2001;345(19):1359-67.
5. Dellinger RP, Carlet JM, Masur H, Gerlach H, Calandra T, Cohen J, et al. Surviving Sepsis Campaign guidelines for management of severe sepsis and septic shock. Intensive Care Med. 2004;30(4):536-55.
6. Dellinger RP, Levy MM, Carlet JM, Bion J, Parker MM, Jaeschke R, et al. Surviving Sepsis Campaign: internatio-nal guidelines for management of severe sepsis and septic shock: 2008. Intensive Care Med. 2008;34(1):17-60. Er-ratum in: Intensive Care Med. 2008;34(4):783-5.
7, van den Berghe G, Wilmer A, Hermans G, Meersseman W, Wouters PJ, Milants I, et al. Intensive insulin therapy in the medical ICU. N Engl J Med. 2006;354(5):449-61. 8. Brunkhorst FM, Engel C, Bloos F, Meier-Hellmann A,
Ragaller M, Weiler N, Moerer O, Gruendling M, Oppert M, Grond S, Olthof D, Jaschinski U, John S, Rossaint R, Welte T, Schaefer M, Kern P, Kuhnt E, Kiehntopf M, Hartog C, Natanson C, Loeler M, Reinhart K; German Competence Network Sepsis (SepNet). Intensive insulin therapy and pentastarch resuscitation in severe sepsis. N Engl J Med. 2008;358(2):125-39.
9. Devos P, Preiser JC, Melot C. Impact of tight glucose con-trol by intensive insulin therapy on ICU mortality and the rate of hypoglycemia: inal results of the glucontrol study [abstract ]. Intensive Care Med. 2007;33 Suppl 2:S189.
10. Rodbard HW, Blonde L, Braithwaite SS, Brett EM, Cobin RH, Handelsman Y, Hellman R, Jellinger PS, Jovanovic LG, Levy P, Mechanick JI, Zangeneh F; AACE Diabetes Mellitus Clinical Practice Guidelines Task Force. American Association of Clinical Endocrinologists medical guideli-nes for clinical practice for the management of diabetes mellitus. Endocr Pract. 2007;13 Suppl 1:1-68. Erratum in: Endocr Pract. 2008;14(6):802-3. Multiple author names added.
11. American Diabetes Association. Standards of Medical Care in Diabetes-2008. Diabetes Care. 2008;31(Suppl 1):S12-54.
12. Treggiari MM, Karir V, Yanez ND, Weiss NS, Daniel S, Deem SA. Intensive insulin therapy and mortality in criti-cally ill patients. Crit Care. 2008;12(1): R29.
13. Wiener RS, Wiener DC, Larson RJ. Beneits and risks of tight glucose control in critically ill adults: a meta-analysis. JAMA. 2008;300(8):933-44. Erratum in: JAMA. 2009;301(9):936.
14. NICE-SUGAR Study Investigators, Finfer S, Chittock DR, Su SY, Blair D, Foster D, Dhingra V, et al. Intensive versus conventional glucose control in critically ill patients. N Engl J Med. 2009;360(13):1283-97.
15. Diener JRC, Prazeres CEE, Rosa CM, Alberton UC. Ava-liação da efetividade e segurança do protocolo de infusão de insulina de Yale para o controle glicêmico intensivo. Rev Bras Ter Intensiva. 2006;18(3):268-75.
16. Azevedo JRA, Lima ERM, Cossetti RJD, Azevedo RP. In-tensive insulin therapy versus conventional glycemic control in patients with acute neurological injury: a prospective con-trolled trial. Arq Neuropsiquiatr. 2007;65(3B):733-8. 17. Malmberg K, Rydén L, Hamsten A, Herlitz J,
Waldens-tröm A, Wedel H. Efects of insulin treatment on cause-speciic one-year mortality and morbidity in diabetic pa-tients with acute myocardial infarction. DIGAMI Study Group. Diabetes Insulin-Glucose in Acute Myocardial Infarction. Eur Heart J. 1996;17(9):1337-44.