Enteral nutritional therapy: application of quality
indicators
Terapia nutricional enteral: aplicação de indicadores de
qualidade
INTRODUCTION
The intensive care quality assurance concept has been increasingly dis-cussed.(1) The nutritional support is currently seen as an additional
thera-peutic tool for this kind of care, and is fundamental for the patient’s man-agement when oral ingestion is not feasible.(2)
Severely ill patients, with a prolonged and complicated course, have intensive metabolic response, generally featuring hypermetabolism, with increased protein catabolism.(3) Thus, these patients have increased
nu-tritional status depletion risk, which can additionally harm their clinical picture.
Flávia De Conti Cartolano1, Lúcia Caruso2, Francisco Garcia Soriano3
1. Nutritionist, Trainee at Hospital Universitário da Universidade de São Paulo’s Nutrition and Dietetics Service – USP – São Paulo (SP), Brazil.
2. Nutritionist, Hospital Universitário da Universidade de São Paulo’s
Nutrition and Dietetics Service – USP – São Paulo (SP), Brazil.
3. Physician for the Adult Intensive Care Unit - Hospital Universitário da Universidade de São Paulo – USP – São Paulo (SP), Brazil.
ABSTRACT
Objective: Monitor the adequacy of enteral nutritional therapy at the in-tensive care unit aiming to improve the quality of nutritional assistance.
Methods: Prospective and
obser-vational study developed at the adult intensive care unit from 2005 to 2008. Patients over 18 years of age with exclu-sive enteral nutritional therapy for over 72h participated in the sample. he av-erage values and the percentile adequacy of energy and proteins calculated, pre-scribed and administered in each year were analyzed. he factors responsible for the non-conformity of the admin-istration planned were classiied into intensive care unit extrinsic or intrinsic causes. he quality indicators proposed by the ILSI Brazil were applied, and ex-pressed into percentile goals. In the sta-tistic analyses, conidence interval and the t Student e Mann-Whitney (p≤0.05) tests were used, according to the Epi Info program.
Results: One hundred and sixteen patients were followed up. here were statically diference in values of energy and protein administered in 2005 and in 2006, when compared to those in 2008. he adequacy calculated/prescribed re-mained close to 100% in all the surveys and the adequacy administered/prescribed increased from 74% in 2005, to 89% in 2008. An increase in interruptions of en-teral nutritional therapy for external fac-tors and the decrease in interruptions for intensive care unit internal factors were veriied. he quality indicators equally re-lect the evolution of the patient care.
Conclusion: In the four yearly sur-veys, a progressive enhancement of nu-tritional support was veriied. Quality indicators allow nutritional care evo-lution monitoring, the comparison to other services data, and are a new per-spective for enteral nutritional therapy assessment.
Keywords: Nutritional therapy; En-teral nutrition; Nutritional assessment From the Nutrition and Dietetics
Service - Hospital Universitário da Universidade de São Paulo – USP – São Paulo (SP), Brazil.
Submitted on June 30, 2009 Accepted on October 20, 2009
Author for correspondence:
Flávia De Conti Cartolano Av. Professor Lineu Prestes, 2565 - Cidade Universitária – 1º A ZIP: 05508-900 - São Paulo (SP), Brazil.
Currently available literature data suggest that ear-ly and appropriate enteral nutritional therapy (ENT) introduction may considerably decrease infections incidence and the hospital stay length.(1,4) However,
intensive care patients frequently have nutritional support inadequacies, both for daily energy needs
overestimation,(5) and late ENT introduction, and
in-terruption for procedures.(6)
Thus, in the last years several studies were con-ducted aiming to evaluate non-conformity of the forecasted and administered calories and proteins. An-other investigational issue regards the most contribut-ing factors for ENT interruption. These trials showed a low adequacy rate for the administered versus the patients’ needs, with the values ranging between 50 and 90%.(1,7,8)
In this context, this study aimed to evaluate the enteral nutritional therapy adequacy among adult pa-tients in an intensive care unit (ICU).
Considering that this trial was conducted yearly since 2005, the 2008 data were compared versus the previous ones,(9-11) with a new analysis perspective,
us-ing the International Life Sciences Institute’s Nutri-tion Committee Clinical NutriNutri-tion Taskforce nutri-tional therapy quality indicators.(12)
METHODS
This was prospective observational trial. The proj-ect was cleared by the Institution’s Ethics Commit-tee (CEP 603/05) and all patients signed an Informed Consent Form.
The data survey was conducted for periods between 53 and 120 days per analyzed year. Only patients re-ceiving at least 72 hours EN (enteral nutrition) were included. Exclusion criteria: concomitant oral and/or parenteral nutrition, non-adherence to the informed consent, and palliative care. The nutritional needs cal-culations were based on the usual body weight, either adjusted or estimated (ideal age weight, according to standard reference tables).(13-15) The energy-protein
recommendations for each clinical status were made according to the unit pre-established protocol.(9) As
those were all bed restricted patients in heart or re-spiratory disease situations, the total energy expendi-ture was estimated using the Harris-Benedict formula, adding an activity factor of 1.2. For surgical patients, in addition to this factor, an injury factor was also added, ranging according the surgery. In renal or liver insufficiency cases, or sepsis, the calculation was based
on the calories per bodyweight (kilograms) recom-mendation.
All enteral nutrition lines were installed in the post-pyloric region, being the positioning confirmed by X-ray examination. The diets were given using a closed system, with continued infusion during an average 22 hours/day, with the remainder 2 hours reserved for procedures and drugs administration. As per the unit protocol,(16) all patients started ENT with an infusion
rate of 25 mL/hour, increasing 10 mL/hour every four hours until reaching 55 mL/hour. After this, each pa-tient progressed to the specific individual target. The available enteral formulas were normocaloric normo-proteic, normocaloric hyperproteic or hypercaloric and hyperproteic.
The data collection was started on the first enteral nutrition day, and lasted until the nutritional therapy was discontinued, patient’s death or discharge from the unit. The daily collected data included: 24 hours infused volume, number of intestinal movements and, in case of interruption, the event related factors. These causes were differentiated as intrinsic and extrinsic to the unit.
The caloric-protein adequacy by comparison of the calculated and the prescribed, and by the prescribed and the given was estimated as a percent ratio, con-sidering as the standard reference value a figure above 90%.(17,18) For these calculations, data before the
pa-tient reached the proposed nutritional target infusion speed were not considered.
The 2008 results were compared to those from 2005, 2006 and 2007.(9-11) For this the Student t test
was used for analyzing parametrical variables, the
Mann-Whitney U test was used for non-parametric
variables, both with p≤ 0.05 significance level and the confidence interval for the proportions. These tests were conducted using the Epi Info version 3.5.1 sta-tistical software.
The quality indicators used are agreed with the is-sued by ILSI Brazil.(12) The parameters evaluated are
shown in table 1.
RESULTS
A total of 116 patients were evaluated, being 33 in 2005, 30 in 2006, 20 in 2007 and 33 in 2008. The Table 2 shows the population and the enteral nutri-tion therapy characterizanutri-tion, according to the year.
Table 1 – Quality indicators used
Indicator Formula Target
Frequency of energy and protein needs measure-ment or estimation in NT patients
# patients with energy/protein expenditure measured x 100 total NT patients #
>80%
Frequency of inappropriate fasting time patients before NT start (>48h)
# patients fasting>48h candidate to NT x 100 total # of NT candidate patients
<80%
Frequency of inadvertent enteral tube displace-ment in ENT patients
# of inadvertent enteral tube displacements x 100 total # of ENT patients x days with enteral tube
<5% in ICUs
Frequency of days with caloric ofer given > or <20% of the total prescribed in the total ENT patients days
# of inappropriate caloric ofer days x # of patients receiving inappropriate caloric ofer x 100
total number of days in the evaluated period x # of NT pa-tients in the evaluated period
<20%
Frequency of days with insuicient protein ofer in the total ENT patients days
# of days with insuicient protein ofer x # of patients recei-ving insuicient protein ofer x 100
total # of days in the evaluated period x # of patients recei-ving NT in the evaluated period
<10%
Frequency of diarrhea episodes in ENT patients* # of days with diarrhea x 100 total # of ENT days
<10%
NT – nutritional therapy; ENT – enteral nutritional therapy; ICU – intensive care unit. Source: Clinical Nutrition Taskforce (ILSI Brazil, 2008)12*Formula adapted.
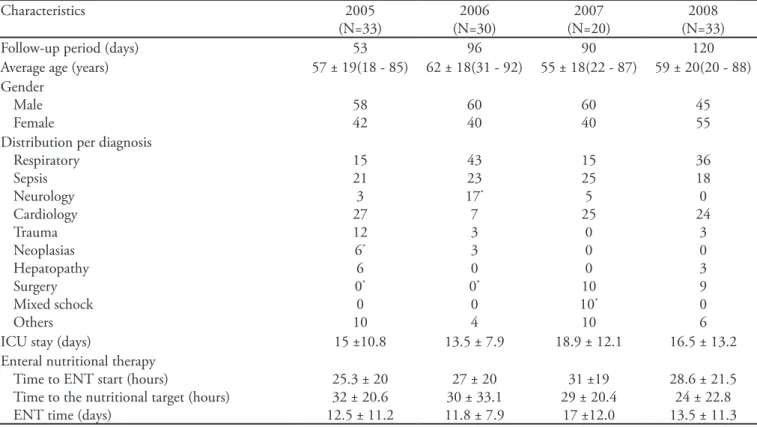
Table 2- Population and enteral nutritional therapy characterization per year
Characteristics 2005
(N=33)
2006 (N=30)
2007 (N=20)
2008 (N=33)
Follow-up period (days) 53 96 90 120
Average age (years) 57 ± 19(18 - 85) 62 ± 18(31 - 92) 55 ± 18(22 - 87) 59 ± 20(20 - 88) Gender
Male Female
58 42
60 40
60 40
45 55 Distribution per diagnosis
Respiratory Sepsis Neurology Cardiology Trauma Neoplasias Hepatopathy Surgery Mixed schock Others
15 21 3 27 12 6*
6 0* 0 10
43 23 17* 7 3 3 0 0* 0 4
15 25 5 25
0 0 0 10 10* 10
36 18 0 24
3 0 3 9 0 6
ICU stay (days) 15 ±10.8 13.5 ± 7.9 18.9 ± 12.1 16.5 ± 13.2
Enteral nutritional therapy Time to ENT start (hours)
Time to the nutritional target (hours) ENT time (days)
25.3 ± 20 32 ± 20.6 12.5 ± 11.2
27 ± 20 30 ± 33.1 11.8 ± 7.9
31 ±19 29 ± 20.4
17 ±12.0
28.6 ± 21.5 24 ± 22.8 13.5 ± 11.3 ICU – intensive care unit; ENT – enteral nutritional therapy; Results expressed as % mean ± standard deviation or median (minimum-maximum).
distribution, ENT aspects and ICU stay length, allow-ing the ENT-related criteria comparison, as shown in tables 3 and 4.
Since the first survey, an increase in the mean time needed to start the ENT was seen, from 25.3 hours in 2005 to 28.6 hours in 2008. A slight drop was seen only when the 2008 data were compared to the 2007 ones, however the differences were not significant.
Regarding the nutritional target, the mean time to reach it has been dropping, as well as the number of patients reaching the target came to its maximal value. It should be stressed that in 2005, 97% of the patients reached the proposed target speed.(10) In the
consecu-tive years, 100% of the patients reached this target. Regarding the persistence with enteral nutrition, the values ranged with the surveys.
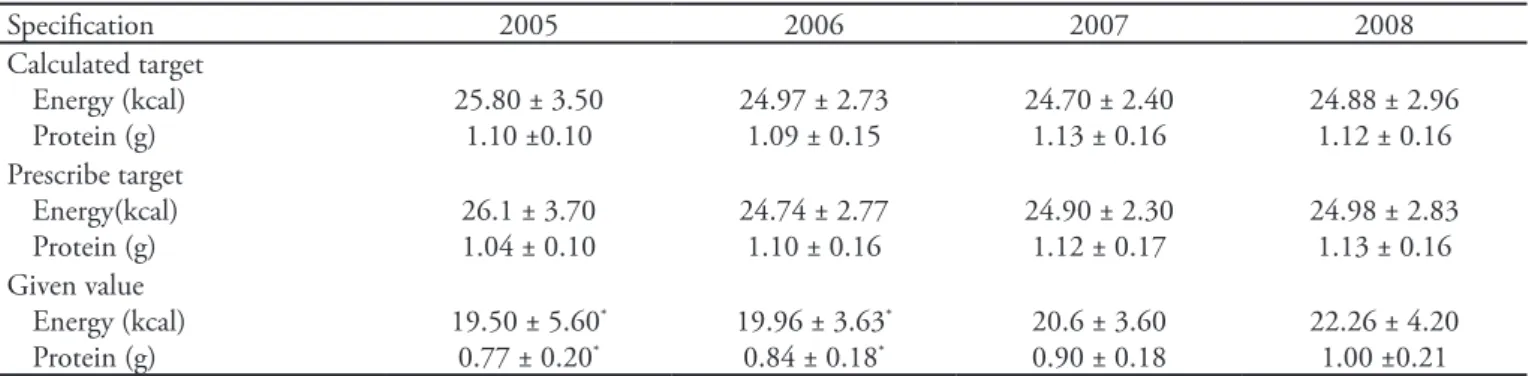
The calculated energetic nutritional targets were, in all surveys, about 25 kcal/kg/day, and regarding proteins, the calculations were also very similar with the years. It was also observed that the prescribed target neared the initially calculated in all analyzed
periods, except for proteins prescription in 2005, as hyperproteic formulas were only introduced in this unit in 2006.
During the surveys there was a positive approxi-mation between the prescribed nutritional target and the actually administered energy and protein values, with statistical differences between the 2005 and 2006 results, and the 2008 results. This becomes more evi-dent when analyzed under the adequacy rate perspec-tive (Table 4) as, while in the first follow-up year the adequacy rate versus prescribed was 74% both for calories and proteins, in 2008 this was around 89%.
In the figure 1 the percent distribution of causes leading to EN discontinuation is shown. It is notice-able that, concomitant to an increase in the discon-tinuations for extrinsic issues, there was a decrease in EN discontinuation for intrinsic unit issues.
From all causes (Figures 2 and 3), tracheostomy was the 2008’s most contributing external cause for percent inadequacy in EN administration. It can also be seen an increase with the years in the proportion of
Table 3 – Calculated and prescribed nutritional target and administered values (mean per bodyweight kilogram) per year
Speciication 2005 2006 2007 2008
Calculated target Energy (kcal) Protein (g)
25.80 ± 3.50 1.10 ±0.10
24.97 ± 2.73 1.09 ± 0.15
24.70 ± 2.40 1.13 ± 0.16
24.88 ± 2.96 1.12 ± 0.16 Prescribe target
Energy(kcal) Protein (g)
26.1 ± 3.70 1.04 ± 0.10
24.74 ± 2.77 1.10 ± 0.16
24.90 ± 2.30 1.12 ± 0.17
24.98 ± 2.83 1.13 ± 0.16 Given value
Energy (kcal) Protein (g)
19.50 ± 5.60* 0.77 ± 0.20*
19.96 ± 3.63* 0.84 ± 0.18*
20.6 ± 3.60 0.90 ± 0.18
22.26 ± 4.20 1.00 ±0.21 Results expressed as mean ± standard deviation. *Statistically signiicant diference (p<0.05).
Table 4 – Adequacy rate for the calculated, prescribed and administered per year
Adequacy 2005 2006 2007 2008
Prescribed/Calculated Energy Protein
100 94
100.3 99.1
100.1 97.9
100.5 100.7
Given/Prescribed Energy
Protein
74.4 74.1
80.5 77.0
83.5 83.5
89.0 88.9
Given/Calculated Energy
Protein
75.5 70.0
79.9 77.0
84.5 81.2
89.6 89.5 Volume
(Given/Prescribed)
73.90 ± 18.80* 77.60* (17.35-95.05)
79.90 ± 11.10* 82.55* (52.64 – 99.70)
83.50 ± 14.3 86.96 (38.57 - 103.00)
EN pauses for procedures. Regarding intrinsic causes, it can be said that these are trending to a balanced distribution, however with an increased participation of interruptions for gastrointestinal complications (18.3%). On the other hand, it has been possible to reduce, since 2006, the fasting time needed for ex-tubation, as well as naso-enteral tube (NET)-related issues.
Regarding the quality indicators used (Table 5), the results show that 100% of the ENT patients had their energy and protein estimated needs attended. The frequency of patients with inappropriate fasting time before ENT ranged with the years from 10 to 20%, the results being within the proposed target. The frequency of inadvertent displacement of enteral tubes was low as well.
Table 5 – Quality indicators
Indicator Survey Target
2005 2006 2007 2008
Frequency of energy expenditure and protein needs measurement or esti-mation in NT patients
100 100 100 100 >80
Frequency of patients with inappropriate fasting time before NT start (>48h)
12.1 20.0 10.0 12.1 <80
Frequency of inadvertent enteral tube displacement in ENT patients 0.18 0.14 0.22 0.13 <5 em UTIs Frequency of days with caloric ofer given above or below 20% of the
pres-cribed ofer in the total patient ENT days
39.25* 30.30* 25.61* 19.03 <20
Frequency of days with insuicient protein ofer in the total patient ENT days
31.24* 30.30* 21.21* 15.61 <10
Frequency of diarrhea episodes in ENT patients - - - 6.76 <10
Results presented as %.
*Statistically signiicant diference (p<0.05). NT – nu¬tritional therapy; ENT – enteral nutritional therapy; ICU – intensive care unit. Source: Clinical Nutrition Taskforce (ILSI Brazil, 2008)12; Adult ICU – Hospital Universitário.
Figure 1 – Percent distribution of enteral nutrition therapy discontinuation per year.
Figure 2 – Percent distribution of extrinsic causes for enteral nutrition therapy interruptions per year.
EN – enteral nutrition; C. - complications.
Figure 3 – Percent distribution of intrinsic causes for enteral nutrition therapy interruptions per year.
Extrinsic causes Intrinsic causes Others
Tomography Bronchoscopy Upper digestive endoscopy Tracheostomy
Initially almost 40% of the total EN days had ad-ministered calories inadequacy. For proteins, this per-cent was lower, about 30%. However, in 2008 these values were approximately 19% and 15%, respectively. Regarding the indicator quantifying the diarrhea frequency, it was not possible to calculate for all years. It was seen that in 2008 this frequency was 6.76%, i.e., within the proposed target (<10%).
DISCUSSION
Early EN introduction has been associated with lower infection complication rates and reduced ICU stay lengths.(19-21) Although the time to ENT start
in-creased in the studied population, these time averages (from the patient admission until EN start) remained below 48 hours in all years, i.e., within the guidelines’ proposed times, which are between 24 and 48 hours.
(19-20) In a study by O’Meara et al.,(22) the average time
to EN start in critical mechanic ventilation patients was 39.7 hours (±36.3h).
Regarding the nutritional target, the patients have been increasingly reaching it within a shorter average time. This suggests that the unit-adopted protocol favors an appropriate progression of the enteral for-mula, reducing risks, complications and promoting a rapid and effective course, contributing to minimize the nutritional wastage in this period.(10)
The energetic nutritional targets, calculated based in an average 25 kcal/kg/day agrees with the Intensive Care Nutritional Therapy Guide, which recommends during the acute phase to provide 20 to 25 kcal/kg/ day and during the recovery and stabilization phase 25 to 30 kcal/kg/day.(20) Considering the average of what
was actually given during the enteral nutrition (Table 3), it can be seen a significant difference for the 2008 results versus those for 2005 and 2006. It becomes then clear that the patients, in average, have being re-ceiving values closer to the recommended.
Considering as conformity percent values above 90%, an improvement could be seen in the nutri-tional assistance with the years. Looking at the val-ues found regarding ENT administration adequacy in the four surveys, it is clear that the adult ICU practices are increasingly effective, also addition-ally emphasizing the importance of the previously established enteral nutrition infusion protocol.(16)
What can have contributed for the observed quality results, in addition to the protocol, is the work of a continuously educated Multidisciplinary Nutritional
Therapy Team.
Different studies have found given/prescribed ad-equacy rates below the found for 2008. Van den Broek et al.,(8) analyzing just energy adequacy in exclusive EN
patients, found an 87% average adequacy. O’Meara et al.,(22) found values close to 50%, ranging according
to the hospitalization day. Reid et al.,(5) studying the
energy-protein administration adequacy for above 72 hours mechanic ventilation patients observed in aver-age 81% for energy and 76% for protein adequacy. Previous studies found even lower rates. (7,17,23,24)
This picture implies a considerable nutritional deficit, evidencing the difficulty to provide an actual ENT infusion closer to the calculated values. At the same time, it stresses the importance of identifying the causes of the ENT administration interruptions, allowing strategies implementation which can mini-mize their effects.(10)
EN administration is rendered difficult by di-rectly intensive care-related issues, as hemodynamic instability, fasting for tests and nursing procedures, NET mechanic problems, among others.(9,25) In the
literature, the most mentioned causes for EN inter-ruptions involve nursing procedures, gastrointestinal intolerances (vomiting, high gastric residues vol-ume), tube repositioning, tests and surgical interven-tions.(5,17,18,22) In this trial, the main cause extrinsic to
the ICU for EN infusion interruption was the tra-cheostomy procedure, while, regarding the intrinsic causes, the main reason for ENT pause was gastroin-testinal complications. A trial by Rice et al.(7) found
that only 9% of the pauses were due to gastrointes-tinal issues, while O’Leary-Kelley et al.,(18) found it
in 36.7%.
The results found with the quality indicators also mirrored improved nutritional assistance. Since the continued system was introduced as the local ICU ENT infusion method, when also the evaluations were started, 100% of the EN patients had their caloric and protein needs calculated.
It can be noticed that the frequency of inadvertent displacement of enteral tube was low. A possible ex-planation for the low inadvertent NET displacement frequency is that only displacements where the NET had to be replaced, letting out, e.g., tube migrations from post-pyloric to gastric position, as it was not possible collecting these data.
pro-teins established target (<10%). Nevertheless, al-though the insufficient protein days rate didn’t reach the aimed value, the yearly percent decline shows that we are moving towards our target. Taking the 2008 results, a significant difference (p<0.05) versus previ-ous years (2005, 2006 and 2007) was seen, evidencing a favorable progression towards reaching this quality indicator target.
According to the literature-adopted diarrhea defi-nition, its incidence may range from 16 to 63%.(26) In
the paper by Elpern et al.,(25) where the same
meth-odology for diarrhea characterization as this trial was used, diarrhea frequency was of 38% total EN days, while our result for 2008 it was only 6.76%.
Thus, it can be seen that ENT nutritional assis-tance has shown values compliant to the quality indi-cators-applied proposed targets. Application of these indicators in ENT is a new evaluation perspective, and allow monitoring the assistance quality and long term data comparisons with other services. However, as this analysis was based on a recent publication, no other results were found that allowed a comparison with other units, what likely will be very soon pos-sible.
CONCLUSION
In the four consecutive yearly surveys performed, we observed an evolution, also with statistically signif-icant differences for the results observed, and this was continuous and reached the scientific literature-rec-ommended values. Thus, patients under nutritional therapy should be routinely monitored. This proposal is of paramount importance, taking into consider-ation the difficulties involving nutritional evaluconsider-ation in critically ill patients.
RESUMO
Objetivos: Monitorar a adequação da terapia
nutricio-nal enteral na unidade de terapia intensiva visando à mel-horia da qualidade da assistência nutricional.
Método: Estudo prospectivo e observacional
desen-volvido na unidade de terapia intensiva adulto entre 2005 e 2008. Participaram da amostra pacientes maiores de 18 anos com terapia nutricional enteral exclusiva por mais de 72h. Analisou-se os valores médios e a adequação percen-tual de energia e proteínas calculados, prescritos e adminis-trados em cada ano. Os fatores responsáveis pela não con-formidade na administração planejada foram classificados em causas externas ou internas à unidade de terapia intensi-va. Foram aplicados os indicadores de qualidade propostos pelo International Life Sciences Institute (ILSI) Brasil, sendo expressos em metas percentuais. Nas análises estatísticas utilizou-se o intervalo de confiança e os testes t Student e
Mann-Whitney (p≤0,05), segundo o programa Epi Info.
Resultados: Foram acompanhados 116 pacientes. Os
valores médios de energia e proteínas administrados em 2005 e em 2006 apresentaram diferenças estatísticas quan-do comparaquan-dos a 2008. A adequação calculaquan-do/prescrito permaneceu próxima a 100% em todos os levantamentos e a adequação administrado/prescrito aumentou de 74% em 2005, para 89% em 2008. Constatou-se o aumento nas in-terrupções da terapia nutricional enteral por fatores exter-nos e a diminuição das interrupções por fatores interexter-nos à unidade. Os indicadores de qualidade igualmente refletem a evolução da assistência prestada.
Conclusão: Nos quatro levantamentos anuais
verificou-se a melhora progressiva da oferta nutricional. Os indica-dores de qualidade são uma nova perspectiva na avaliação da terapia nutricional enteral, permitindo monitorar a evolução da qualidade da assistência nutricional e a compa-ração com dados de outros serviços.
Descritores: Terapia nutricional; Nutrição enteral;
Avaliação nutricional
REFERENCES
1. Santana-Cabrera L, O’Shanahan-Navarro G, García-Martul M, Ramírez Rodríguez A, Sánches-Palacios M, Hernández-Medina E.Calidad del soporte nutricional ar-tiicial en una unidad de cuidados intensivos. Nutr Hosp. 2006;21(6):661-6.
2. Petros S, Engelmann L. Enteral nutrition delivery and energy expenditure in medical intensive care patients. Clin Nutr. 2006;25(1):51-9.
3. Villet S, Chiolero RL, Bollman MD, Revelly JP, Cayeux R N MC, Delarue J, Berger MM. Negative impact of hypo-. Negative impact of hypo-Negative impact of
hypo-caloric feeding and energy balance on clinical outcome in ICU patients. Clin Nutr. 2005;24(4):502-9.
4. Marik PE, Zaloga GP. Early enteral nutrition in acu-tely ill patients: a systematic review. Crit Care Med. 2001;29(12):2264-70. Erratum in: Crit Care Med. 2002;30(3):725.
5. Reid C. Frequency of under- and overfeeding in mechani-cally ventilated ICU patients: causes and possible conse-quences. J Hum Nutr Diet. 2006;19(1):13-22.
opportunities for improvement? JPEN J Parenter Enteral Nutr.2003;27(1):74-83.
7. Rice TW, Swope T, Bozeman S, Wheeler AP. Variation in enteral nutrition delivery in mechanically ventilated pa-tients. Nutrition. 2005;21(7-8):786-92.
8. van den Broek PW, Rasmussen-Conrad EL, Naber AH, Wanten GJ. What you think is not what they get: signi-. What you think is not what they get: signi-What you think is not what they get: signi-icant discrepancies between prescribed and administered doses of tube feeding. Br J Nutr. 2009;101(1):68-71. 9. Teixeira ACC, Caruso L, Soriano FG. Terapia nutricional
enteral em unidade de terapia intensiva: infusão versus ne-cessidades. Rev Bras Ter Intensiva. 2006;18(4):331-7. 10. Aranjues AL, Teixeira ACC, Caruso L, Soriano FG.
Mo-nitoração da terapia nutricional enteral em UTI: indicador de qualidade? Mundo Saúde (1995). 2008;32(1):16-23. 11. Chaves CG. Monitorização da terapia nutricional enteral
na unidade de terapia intensiva. [Monograia de conclusão do Programa de Aprimoramento em Nutrição Hospitalar]. São Paulo: Hospital Universitário da Universidade de São Paulo; 2007.
12. Waitzberg DL, coordenador. Indicadores de qualidade em terapia nutricional. São Paulo: ILSI Brasil; 2008.
13. Burr ML, Phillips KM. Anthropometric norms in the el-derly. Br J Nutr. 1984;51(2):165-9.
14. Cutts ME, Dowdy RP, Ellersieck MR, Edes TE. Predicting energy needs in ventilator-dependent critically ill patients: efect of adjusting weight for edema or adiposity. Am J Clin Nutr. 1997;66(5):1250-6.
15. Mahan LK, Escott-Stump S, editores. Krause alimentos, nutrição e dietoterapia. 10a ed. São Paulo: Roca; 2002. 16. Maia FOM, Hoshino WI, Caruso L. Protocolo de
nutri-ção enteral. In: Soriano FG, Nogueira AC. Manual de te-rapia intensiva do hospital universitário da USP. São Paulo: Savier; No prelo 2009.
17. Binnekade JM, Tepaske R, Bruynzeel P, Mathus-Vliegen EM, de Hann RJ. Daily enteral feeding practice on the ICU: attainment of goals and interfering factors. Crit Care. 2005;9(3):R218-25.
18. O´Leary-Kelley CM, Puntilho KA, Barr J, Stotts N,
Dou-glas MK. Nutritional adequacy in patients receiving me-chanical ventilation who are fed enterally. Am J Crit Care. 2005;14(3):222-31.
19. Heyland DK, Dhaliwal R, Drover JW, Gramlich L, Dodek P; Canadian Critical Care Clinical Practice Guidelines Com-mittee. Canadian clinical practice guidelines for nutrition su-pport in mechanically ventilated, critically ill adult patientes. JPEN J Parenter Enteral Nutr. 2003;27(5):355-73.
20. Kreymann KG, Berger MM, Deutz NE, Hiesmayr M, Jolliet P, Kazandjiev G, Nitenberg G, van den Berghe G, Wernerman J; DGEM (German Society for Nutritional Medicine), Ebner C, Hartl W, Heymann C, Spies C; ES-PEN (European Society for Parenteral and Enteral Nutri-tion). ESPEN Guidelines on Enteral Nutrition: Intensive care. Clin Nutr. 2006;25(2):210-23.
21. Kattelmann KK, Hise M, Russell M, Charney P, Stokes M, Compher C. Preliminary evidence for a medical nutrition therapy protocol: enteral feedings for critically ill patients. J Am Diet Assoc. 2006;106(8):1226-41. Review.
22. O’Meara D, Mireles-Cabodevila E, Frame F, Hummell AC, Hammel J, Dweik RA, Arroliga AC. Evaluation of delivery of enteral nutrition in critically ill patients receiving mecha-nical ventilation. Am J Crit Care. 2008;17(1):53-61. 23. Heyland DK, Dhaliwal R, Day A, Jain M, Drover J.
Vali-dation of the Canadian clinical pratice guidelines for nutri-tion support in mechanically ventilated, critically ill adult patients: results of a prospective observational study. Crit Care Med. 2004;32(11):2260-6.
24. Kyle UG, Genton L, Heidegger CP, Maisonneuve N, Kar-segard VL, Huber O, et al. Hospitalized mechanically venti-lated patients are at higher risk of enteral underfeeding than non-ventilated patients. Clin Nutr. 2006;25(5):727-35. 25. Elpern EH, Stutz L, Peterson S, Gurka DP, Skipper A.
Ou-tcomes associated with enteral tube feedings in a medical intensive care unit. Am J Crit Care. 2004;13(3):221-7. 26. Cremonini F, Caro SD, Nista EC, Bartolozzi F, Capelli G,