Hermano Albuquerque de CastroI
Márcia Faria da CunhaII
Gulnar Azevedo e Silva MendonçaIII,IV
Washington Leite JungerIII
Joana Cunha-CruzV
Antonio Ponce de LeonIII
I Centro de Estudos de Saúde do Trabalhador e Ecologia Humana. Escola Nacional de Saúde Pública. Fundação Oswaldo Cruz. Rio de Janeiro, RJ, Brasil
II Centro Municipal Necker Pinto. Secretaria Municipal de Saúde do Rio de Janeiro. Rio de Janeiro, RJ, Brasil
III Instituto de Medicina Social. Universidade Estadual do Rio de Janeiro. Rio de Janeiro, RJ, Brasil
IV Coordenação de Prevenção e Vigilância. Instituto Nacional de Câncer. Ministério da Saúde. Rio de Janeiro, RJ, Brasil
V Dental Public Health Sciences. University of Washington. Seattle, WA, USA
Correspondence:
Hermano Albuquerque de Castro
Centro de Estudos de Saúde do Trabalhador e Ecologia Humana
Escola Nacional de Saúde Pública R. Leopoldo Bulhões, 1480 – Manguinhos 21041-210 Rio de Janeiro, RJ, Brasil E-mail: castro@ensp.fi ocruz.br
Received: 10/19/2007 Revised: 4/2/2008 Approved: 5/8/2008
Effect of air pollution on lung
function in schoolchildren in
Rio de Janeiro, Brazil
ABSTRACT
OBJECTIVE: To assess the association between daily exposure to air
pollution and lung function in school children.
METHODS: Panel study with a random sample of 118 students (between 6
and 15 years of age), enrolled in a public school of the city of Rio de Janeiro, state of Rio de Janeiro, and living within 2 km of the study site. Data on students’ characteristics were obtained with a questionnaire, including the International Study of Asthma and Allergies in Childhood – ISAAC. Daily
peak expiratory fl ow measurements were taken to measure lung function.
Daily data on PM10, SO2, O3, NO2 and CO levels, temperature and humidity
were provided by a portable monitor. Repeated measurements of lung function were associated with pollutant levels with a multilevel model adjusted for time trend, temperature, air humidity, exposure to smoking at home, presence of asthma, height, sex, weight and age of children.
RESULTS: Mean peak expiratory fl ow was 243.5 l/m (sd=58.9). The lowest
mean peak expiratory fl ow was 124 l/m, and the highest, 450 l/m. For the
10 μg/m³ increase in PM10, there was a 0.34 l/min decrease in mean peak
fl ow on the third day. For the 10 μg/m³ increase in NO2, there was a decrease
between 0.23 l/min and 0.28 l/min in mean peak fl ow after exposure. CO and
SO2 effects on students’ peak fl ow were not statistically signifi cant. O3 showed
a protective result: an increase in 10 μg/m³ of O3 would be associated, after a
day of exposure, with a 0.2 l/min increase in mean lung function.
CONCLUSIONS: Even within acceptable levels most of the time, air
pollution, especially PM10 and NO2, was associated with a decrease in lung
function in children living in the city of Rio de Janeiro.
DESCRIPTORS: Air Pollution, adverse effects. Child. Respiratory Function Tests. Inhalation Exposure. Respiratory Tract Diseases, prevention & control.
INTRODUCTION
Harmful effects of air pollution on human health have been observed not only in the mortality in general and due to respiratory and cardiovascular diseases, but also in the morbidity, including increases in respiratory symptoms and
decreases in lung function.5
In Brazil, time-series studies have assessed the impact of pollutants on population
health.8,17,18 A study performed in the two largest Brazilian cities, Rio de Janeiro
and São Paulo,8 found that air pollution was associated with both respiratory and
in children rose as a result of increases in pollution: 1.8%
in Rio de Janeiro and 6.7% in São Paulo for 10μg/m3
increases in PM10 (particulate material with up to 10 micrometers in diameter); yet in São Paulo, 6.7% for
10μg/m3 increases in SO
2 (sulfur dioxide) and 1.7% for
1ppm increases in CO (carbon monoxide). Air pollu-tion was also associated with prevalence of asthma in children, in a study performed in the cities of Duque de
Caxias and Seropédica, state of Rio de Janeiro.15
Among international studies, one investigation in rural Holland found a reduction in lung function during two
weeks after a pollution episode, when SO2 and
particu-late material levels rose, affecting 1,000 children aged
between six and 12 years.2 In Austria, 975 children
were followed for three years, when a reduction in lung function, associated with an increase in PM10,
SO2, NO2 (nitrogen dioxide) and O3 (ozone) levels,
was observed.11 These studies indicate that the impact
of air pollution on asthmatic children, expressed in school absenteeism and higher number of hospitaliza-tions, seems to be more serious among those with lower
socioeconomic level.9
Time-series studies have been employed to support arguments aimed at reducing exposure limits or show-ing health impacts with pollution levels well below
the limits recommended by the Resolution No 3/90 of
the Conselho Nacional do Meio Ambiente – CONAMA
(National Environmental Council).a
Participants in the panel studies have their lung function assessed with a daily measurement of peak expiratory
fl ow, asthma episodes and number of nebulizations.
These studies are frequently performed to estimate acute effects of air pollution on susceptible populations,
such as children1 and asthmatic adults.25
Exposure to air pollution can be measured individually with portable personal monitors or by a station located near the study site. In the latter case, it is assumed that individuals live in the same location where air monitor-ing is performed. Thus, situations in which susceptible population samples remain in the same place for rela-tively long periods of time are used. In this manner, both exposure to air pollution and respiratory or cardiac symptoms, or yet lung function indicators, can be more
accurately assessed.3
This study aimed to investigate the association between daily exposure to air pollution and lung function in schoolchildren.
METHODS
This study was performed in the Complexo de Manguinhos, located in the city of Rio de Janeiro,
Southeastern Brazil, in 2004. This area has some fi xed
and mobile sources with high potential for air pollution,
among which is an avenue with intense fl ow of heavy
vehicles (Avenida Brasil), Manguinhos refi nery, Caju
garbage and transferring station, in addition to several other small factories. A sample of 120 children from one public school was selected, of which ten students from 12 classes were randomly chosen. These children, aged between six and 15 years, were considered to belong to low-income families and living within 2 km of the study site. A panel study was performed, whose main characteristic is its longitudinal dimension, with daily measurements of exposure to pollutants and peak
ex-piratory fl ow in children during three months. Children
were submitted to daily tests for six weeks in a row, in May, June, September and October of 2004. These were performed in the morning, between 9:00am and 12:00pm, from Mondays to Fridays.
Information on students was obtained with the appli-cation of a questionnaire, weight and height
measure-ments and peak expiratory fl ow tests. Questionnaire
was answered by those responsible for the children, and included eight questions from the International Study of Asthma and Allergies in Childhood (ISAAC) protocol, used to assess the severity and diagnosis of
asthma.24 Starting with the standardization of the
re-search instruments (written questionnaire), they were validated by a pilot study, in several countries, and by
Solé et al,21 in Brazil, confi rming its applicability and
reproducibility. After this phase, ISAAC began to be performed in several parts of the world and it has been validated, until now, for the 6-to-7-year and 13-to-14-year age groups.
The test was performed under technical supervision and followed by a pediatrician and a pneumologist. A por-table Mini-Write Peak Flow Meter® (Clement Clare, London, UK) was employed. Children were instructed
to breathe in deeply, place the peak fl ow meter on their
mouth and then blow quickly and strongly. They would blow three times, values would then be noted down, and the highest value would be selected for analysis. Lung function in children was assessed with a peak
fl ow test. This test aims to measure the maximum
ex-piratory fl ow, which represents the highest peak fl ow
value found after forced expiration, measured in liters per minute.
Information on air quality was obtained with a mobile pollutant monitoring unit from the Rio de Janeiro City Department of Environment, at the study site. Data
on PM10, SO2, O3, NO2 and CO were used as daily
air pollution indicators for children under the same exposure conditions. Meteorological conditions were
obtained with measuring devices located at the Galeão Airport. Minimum, mean and maximum temperatures and relative air humidity were used.
Considering the structure of a panel study or repeated measurements, a time series of about 120 peak expiratory
fl ow observations was associated with each child.
The statistical analysis approach consisted in explor-ing the data’s natural hierarchy. Repeated lung func-tion measurements were analyzed with a Gaussian
multilevel model, where the fi rst and second level
units were the days with pulmonary assessments and the children, respectively. Main exposure variables
were the daily levels of PM10, SO2, O3, NO2 and CO
pollutants. Daily meteorological conditions and child individual characteristics, such as weight, height, sex, age, presence of asthma, and exposure to smoking, were considered as confounding variables. The variable “air pollution exposure” and the meteorological
fac-tors were designated to fi rst level units, whereas child
individual characteristics were considered as second level variables.
The mean time trajectory of peak fl ow measurements
was adjusted using a third-degree polynomial curve (parametric spline), which admitted that each child had their own individual trajectory adjusted (random effects in the polynomial curve parameters). This strategy was employed so that modeling of the observed child lung function levels took into consideration child growth during the study period, as well as the learning of measurement device use.
It was assumed that both the exposure to pollution and meteorological conditions could have had lagged effects on lung function trajectories. Thus, indicators were created from simple lags and cumulative indices (moving averages) of the same day and previous days for pollutants and meteorological factors. Part of the analysis aimed to determine which meteorological
factor indicators, among all those available, best fi t
the data. Using the daily measured median time series of model residues that considered adjustment by trend (parametric spline), dose-response graphical models (daily residue series as previously described versus
meteorological indicator series) and signifi cance and/or
goodness-of-fi t tests of models, based on inclusion of
indicators, were used to select temperature and humid-ity indicators. When there were doubts about the most
suitable indicator, the fi nal choice was made according
to the Akaike’s information criterion (AIC).
The dose-response pattern observed between each meteorological indicator, selected in the previous step, and lung function, was adjusted in a way similar to that previously described for the time trajectory (parametric), admitting, if necessary, that children could have their own dose-response curves adjusted (random effects).
With this approach, the absence of observations on certain days (eventual absence of children in school) does not compromise the estimation process of model parameters. However, due to the data’s temporal nature, self-correlation patterns were adequately adjusted. There are different procedures to estimate self-correla-tion and also to diagnose adjusted models, in terms of the presence of self-correlation residues. Some of these procedures were applied to guarantee the correct
iden-tifi cation and modeling of self-correlation and the
pat-tern of partial self-correlation function of median daily series and residue averages from the model adjusted by trend, temperature and humidity was analyzed. The effects of pollution on daily variations in the
stu-dents’ peak expiratory fl ow trajectory were estimated
after controlling for factors associated to both their lung function and pollution levels. The base model consisted of these confounding factors, which included the time trend, temperature, relative air humidity and the follow-ing students’ characteristics: age, height, smokfollow-ing in the family and asthma. This base model was diagnosed according to the presence of outliers, normality, and
cor-rect specifi cation, among other things. When the model
was considered adequate, it was used in the following phases to estimate effects of interest.
After determining the base model, the effect of air pollution on lung function could be estimated for each pollutant, and each lag was incorporated into the basic model, one at a time. The effects of pollutants on lung function levels were estimated both on average and individually (random effects).
This study was approved by the Research Ethics Com-mittee of the Universidade Estadual do Rio de Janeiro. Consent from parents and teachers was obtained to adjust the project to the school’s educational guidance norms.
RESULTS
A total of 118 children were assessed (two children were excluded from the study, due to their change of schools) with mean age of 9.14 years (sd=1.84), mean height of 1.36 meters (sd=0.12) and mean weight of 32 kg (sd=10.7). Half of the students were female. Out of the 118 children, 18.4% were asthmatic, and 49.1% lived in a home with smokers.
Mean peak expiratory fl ow was 243.5 l/min (sd=58.9).
The lowest mean peak expiratory fl ow was 124 l/min
and the highest was 450 l/min. On average, students
had peak fl ow measured for 78 days, varying from
case of students changing schools during their period of study, this change of schools was also considered not to be associated with air pollution levels.
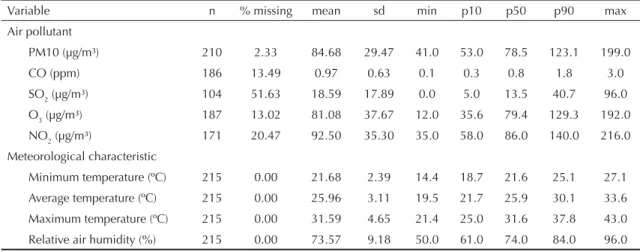
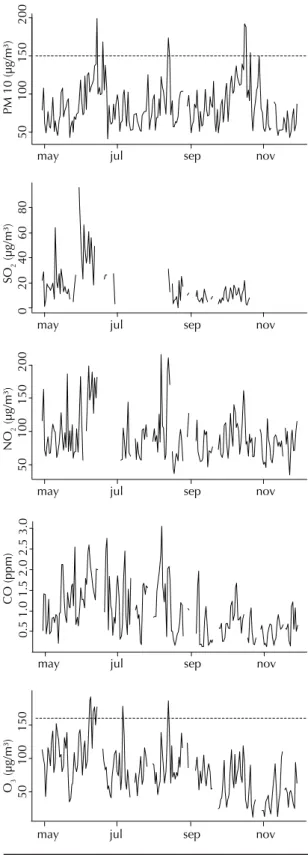
Daily mean levels of air pollutants in the Complexo de Manguinhos, during the study period, surpassed the maximum limits established by the CONAMA resolu-tion Nº 003/1990 (horizontal line in the graphs) for
PM10 and O3, and did not surpass these limits for CO,
NO2 and SO2, as observed on Table 1 and Figure 1.
Data on pollutants were missing on some days,
espe-cially for SO2. For PM10, the mean in the period was
84.7 μg/m³ (sd=29.5) and the highest mean
concentra-tion on one day was 199 μg/m³. CO varied between
0.1 and 3 ppm, whereas NO2 varied between 35 and
216 μg/m³.
Average temperature was 26ºC (sd=3.1) and relative air humidity varied between 50% and 96%, with a mean of 73.6% (sd=9.2).
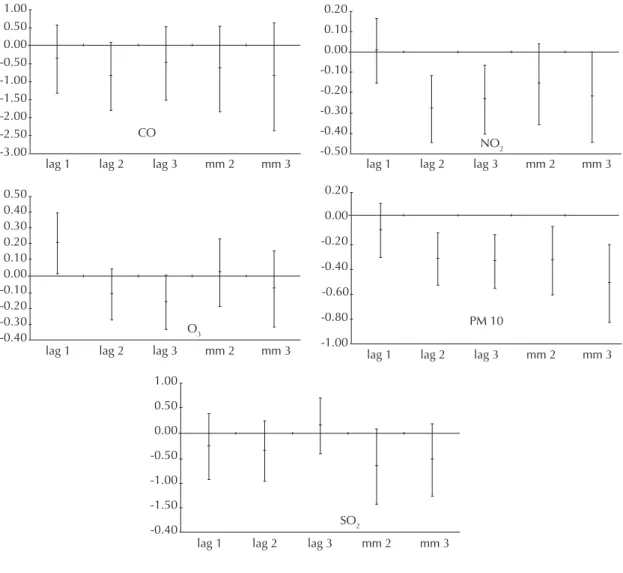
PM10 was associated with a decrease in students’ peak
expiratory fl ow. Increases of 10 μg/m³ in PM10 on a
certain day caused a decrease in peak fl ow, varying
between 0.32 l/min and 0.52 l/min, depending on the
lag. An increase of 10 μg/m³ in PM10, for example,
led to a 0.34 l/min decrease in mean lung function in children, three days later (Table 2 and Figure 2). The rise in PM10 levels corresponding to the differ-ence between the group of 10% most polluted days (90 percentile of PM10 distribution) and the group of 10% least polluted days (10 percentile of PM10 distribution) was associated with a decrease of 2.42 l/min in mean
peak expiratory fl ow. This value represented a
reduc-tion of about 1% in children’s mean lung funcreduc-tion at a certain moment (Table 2).
CO and SO2 effects on students’ peak fl ow were not
statistically signifi cant. There was also a trend towards
a decrease in students’ peak expiratory fl ow when CO
and SO2 levels rose. SO2 effects must be interpreted with
caution, due to the great amount of missing data for this pollutant in the study period (Table 2 and Figure 2).
O3 showed a signifi cant protective effect; a 10 μg/m³
increase in O3 was associated with a 0.2 l/min increase
in mean peak expiratory fl ow, one day later. In contrast,
considering the three-day lag, there was a reduction
in mean peak expiratory fl ow, though not signifi cant
(Table 2 and Figure 3).
NO2 was signifi cantly associated with a decrease in
students’ peak expiratory fl ow. Increases of 10 μg/m³ in
NO2, on a certain day were associated with a decrease
from 0.23 l/min to 0.28 l/min in mean lung function, two and three days later, respectively. There was also
an increase in local levels of NO2 corresponding to the
difference between the least polluted day of the 10%
most polluted days (90 percentile of NO2 distribution)
and the most polluted day of the 10% least polluted
days (10 percentile of NO2 distribution) associated
with a reduction of 3.66 l/min in mean peak expiratory
fl ow. This value represented a decrease of about 1.5%
in students’ lung function. In this case, the mean peak
expiratory fl ow would have dropped about 0.22 l/min
for a 10 μg/m³ increase in the moving average levels
of three days of NO2 (Table 2 and Figure 2).
DISCUSSION
Air pollution was associated with a reduction in students’
lung function in the short term. Specifi c increases in
PM10and NO2 levels were associated with decreases in
lung function. In contrast, CO, SO2 e O3 levels were not
associated with reductions in students’ lung function. Similar effects were obtained in panel studies from
other regions.22 A systematic review study with
chil-dren to investigate air pollution effects concluded that, according to a classic meta-analysis model, children’s
peak fl ow levels would decrease 0.012 l/min (95% CI
Table 1. Distribution of pollutants and meteorological variables. City of Rio de Janeiro, Southeast Brazil 2004.
Variable n % missing mean sd min p10 p50 p90 max
Air pollutant
PM10 (µg/m³) 210 2.33 84.68 29.47 41.0 53.0 78.5 123.1 199.0
CO (ppm) 186 13.49 0.97 0.63 0.1 0.3 0.8 1.8 3.0
SO2 (µg/m³) 104 51.63 18.59 17.89 0.0 5.0 13.5 40.7 96.0
O3 (µg/m³) 187 13.02 81.08 37.67 12.0 35.6 79.4 129.3 192.0
NO2 (µg/m³) 171 20.47 92.50 35.30 35.0 58.0 86.0 140.0 216.0
Meteorological characteristic
Minimum temperature (ºC) 215 0.00 21.68 2.39 14.4 18.7 21.6 25.1 27.1
Average temperature (ºC) 215 0.00 25.96 3.11 19.5 21.7 25.9 30.1 33.6
Maximum temperature (ºC) 215 0.00 31.59 4.65 21.4 25.0 31.6 37.8 43.0
−0.017; −0.008)22 on average for a 10 μg/m³ increase
in PM10 levels. When considering a random coeffi cient
model, the mean effect was −0.033 l/min (95% CI
−0.047; −0.019), very similar to that observed in this
panel study, −0.034 l/min (95% CI −0.053; −0.012), for
the same PM10 increase and a two-day lag.
In 2001, a study with children aged between seven and nine years, in the city of São Paulo, Southeast Brazil,
observed associations with several pollutants.4 Even
though no pollutants could be singled out as the main cause of the harmful effects on child health, for an interquartile variation in PM10 concentration, there
was a 1.05% reduction in peak expiratory fl ow, a result
comparable to that found in this study. Other interna-tional studies have shown a correlation between the 10
μg/m³ increase in PM10 and the reduction of more than
10% in peak fl ow for the same day.14,15,16
Nitrogen dioxide (NO2) is a strong respiratory irritant
produced by different fixed and moving pollutant sources. In this study, it was associated with reductions in students’ lung function. This result is corroborated by other panel studies in children with distinct outcomes,
such as cough and respiratory symptoms.12 In contrast,
among children younger than 18 months of age, this
association between exposure to NO2 and respiratory
problems was not observed.19 Different results show
that other studies need to assess the impact of NO2 on
child lung function.
Carbon monoxide (CO), sulfur dioxide (SO2) and
ozone (O3) were not associated with harmful effects
on child lung function in this study. However, peak
expiratory fl ow decreasing trends associated with
increases in levels of pollutants, such as CO and SO2,
were identifi ed.13 Studies on CO have shown its impact,
correlated with the increase in adult arterial pressure20
and child symptoms.10
Contrary to what was expected, the increase in ozone levels was associated with an increase in child lung function. Absenteeism may partly explain this result, due to the reduction in mean lung function on the second and third days after exposure, although not
signifi cant. In other words, the hypothesis is that more
sensitive children are absent on the fi rst day after
exposure, returning on the following days. Further analysis using a logistic regression model for absentee-ism related to pollutants levels may help understand
these fi ndings.
Results of this study diverge from those of some
stud-ies,8 and agree with others.6 Ozone was associated with
a reduction in lung function in Swiss children after physical exercise and in those who remained outdoors
for a longer time.7
Confl icting information about O3 could be related to
the methods used in different studies, the low ozone levels, or even the negative correlation between ozone
and other pollutants, such as PM10 and NO2.
Figure 1. Distribution of pollution by PM 10, CO, SO2, O3
and NO2 in the period studied. Rio de Janeiro, Southeast
Brazil, 2004.
PM 10 (µg/m³)
50
100
150
200
may jul sep nov
CO (ppm)
0.5
1.0
1.5
2.0
2.5
3.0
may jul sep nov
O3
(µg/m³)
50
100
150
may jul sep nov
SO
2
(µg/m³)
0
2
04
0
6
08
0
may jul sep nov
NO
2
(µg/m³)
50
100
150
200
peak expiratory fl ow repeated measures (outcome), the air pollutants (main exposures) and time-related confounding factors (time and meteorological indica-tors). Growth experienced by each child in the study
period infl uences their lung function. However, due to
age and genetic factors, it could be hypothesized that each child has their own growth curve. Thus, the growth
pattern was specifi cally modeled for each child, using
random effect models in the lung function time trajec-tory. The second hierarchical level has the students’ characteristics that can either explain or change the association between outcome and main exposures, such as age, height, weight, presence of respiratory disease (asthma, for example) and passive smoking.
Lack of data when measuring pollutants is one of the limitations of this study. In contrast, the following are among the advantages of this study: daily follow-up of children, daily monitoring of exposure to pollution near the place of residence and study, and use of mul-tidisciplinary team with the collaboration of municipal, state and federal institutions.
Another advantage was the use of a multilevel model and adjustment for confounding variables, enabling the estimation of pollution effects on lung function. Several statistical models can be employed to analyze repeated measurements similar to the ones found in this study, which used a multilevel model with two
hierarchical levels. The fi rst level has each student’s
Table 2. Estimated reductions in child peak expiratory fl ow (in l/min) for increases in pollutants* and increases according to
least and most polluted days* *. Rio de Janeiro, Southeast Brazil, 2004.
Pollutant coef (95% CI) coef(10-90) (95% CI) p-value
PM10 (µg/m³)
1-day lag -0.11 -0.319; 0.106 -0.74 -2.234; 0.745 0.327
2-day lag -0.32 -0.526; - 0.120 -2.26 -3.685; - 0.838 0.002
3-day lag -0.35 -0.555; - 0.136 -2.42 -3.889; - 0.954 0.001
2-day mean -0.34 -0.605; - 0.078 -2.40 -4.242; - 0.549 0.011
3-day mean -0.52 -0.824; - 0.211 -3.63 -5.776; - 1.478 0.001
CO (ppm)
1-day lag -0.37 -1.316; 0.585 -0.58 -2.085; 0.927 0.451
2-day lag -0.82 -1.702; 0.070 -1.29 -2.698; 0.110 0.071
3-day lag -0.48 -1.483; 0.515 -0.77 -2.351; 0.816 0.342
2-day mean -0.65 -1.838; 0.545 -1.02 -2.913; 0.863 0.287
3-day mean -0.87 -2.383; 0.640 -1.38 -3.777; 1.015 0.259
SO2 (µg/m³)
1-day lag -0.28 -0.942; 0.380 -1.00 -3.362; 1.355 0.404
2-day lag -0.38 -0.986; 0.235 -1.34 -3.519; 0.841 0.229
3-day lag 0.13 -0.427; 0.688 0.47 -1.523; 2.456 0.646
2-day mean -0.69 -1.439; 0.066 -2.45 -5.138; 0.236 0.074
3-day mean -0.56 -1.293; 0.175 -2.00 -4.616; 0.625 0.136
O3 (µg/m³)
1-day lag 0.21 0.016; 0.395 1.92 0.145; 3.695 0.034
2-day lag -0.11 -0.273; 0.049 -1.05 -2.554; 0.460 0.173
3-day lag -0.16 -0.330; 0.006 -1.51 -3.088; 0.059 0.059
2-day mean 0.02 -0.186; 0.233 0.22 -1.738; 2.183 0.824
3-day mean -0.08 -0.314; 0.159 -0.73 -2.941; 1.487 0.520
NO2 (µg/m³)
1-day lag 0.01 -0.153; 0.165 0.05 -1.251; 1.353 0.939
2-day lag -0.28 -0.447; - 0.118 -2.31 -3.663; - 0.966 0.001
3-day lag -0.23 -0.400; - 0.065 -1.91 -3.282; - 0.531 0.007
2-day mean -0.16 -0.357; 0.037 -1.31 -2.926; 0.305 0.112
3-day mean -0.22 -0.444; 0.001 -1.82 -3.641; 0.007 0.051
* Increase in 10 units for all pollutants, except for CO: 1 unit.
* * Corresponding to the difference between the least polluted day of the 10% most polluted days and the most polluted day
Air pollutants exposure limits have been the subject of discussion in different countries. The 2005 report by
the World Health Organization (WHO)23 established
new guidelines on air quality and reduction of cur-rent limits of human exposure. Even though there are
many scientifi c publications on air pollution effects on
population health and distinct methods used to measure
these effects,3 questions about the effective impact
of different pollutants still remain. Panel studies can contribute to a better understanding of the effects and risks of air pollution on human health.
Panel studies allowed us to investigate in more detail the
impact of specifi c air pollutants on child lung function.
The methodology applied here can be reproduced in
other regions and also allows factors that may interfere with lung function to be better controlled for. Further studies on the impact of air pollution on popu-lation health from different regions may contribute to the application of better and local methods of air pol-lution control.
ACKNOWLEDGEMENTS
We would like to thank the Rio de Janeiro City Environ-ment DepartEnviron-ment for providing data from the mobile pollutant monitoring unit and the Rio de Janeiro State Department of Education for authorizing this study to be performed in a public school.
Figure 2. Estimated reductions in child peak expiratory fl ow (in l/min) and confi dence intervals for increases of 10 units in
pollutants (except for CO: 1 unit). Rio de Janeiro, Southeast Brazil, 2004.
lag 1 lag 2 lag 3 SO2
1.00
0.50
0.00
-0.50
-1.00
-1.50
-0.40
mm 2 mm 3 lag 1 lag 2 lag 3
CO 1.00
0.50 0.00 -0.50 -1.00 -1.50 -2.00 -2.50 -3.00
mm 2 mm 3 lag 1 lag 2 lag 3 NO2 0.20
0.10
0.00 -0.10 -0.20 -0.30
-0.40 -0.50
mm 2 mm 3
lag 1 lag 2 lag 3 O3 0.50
0.40 0.30 0.20 0.10 0.00 -0.10 -0.20 -0.30 -0.40
mm 2 mm 3 lag 1 lag 2 lag 3 PM 10 0.20
0.00
-0.40 -0.20
-0.60
-0.80
-1.00
1. Bates DV. The effects of air pollution on children. Environ Health Perspect. 1995;103 (Suppl 6):49-53. DOI: 10.2307/3432345
2. Brunekreef B, Lumens M, Hoek G, Hofschreuder P, Fischer P, Biersteker K. Pulmonary function changes associated with an air pollution episode in January
1987.JAPCA.1989;39(11):1444-7.
3. Castro HA, Gouveia N, Escamilla-Cejudo, José A. Questões metodológicas para a investigação dos efeitos da poluição do ar na saúde. Rev Bras Epidemiol. 2003;6(2):135-49. DOI: 10.1590/S1415-790X2003000200007
4. Correia JEM. Poluição atmosférica urbana e fl uxo expiratório de pico (peak fl ow) em crianças de 7 a 9 anos na cidade de Säo Paulo, SP. Dissertação de mestrado: Faculdade de Saúde Pública-USP. São Paulo; 2001. 215 p.
5. Curtis L, Rea W, Smith-Willis P, Fenyves E, Pan Y. Adverse health effects of outdoor air pollutants. Environ Int. 2006;32(6):815-30. DOI: 10.1016/ j.envint.2006.03.012
6. Frischer T, Studnicka M, Gartner C, Tauber E, Horak F, Veiter A, et al. Lung function growth and ambient ozone. A three years population study
in school-children. Am J Respir Crit Care Med.
1999;160(2):390-6.
7. Gauderman WJ, McConnell R, Gilliland F, London S, Thomas D, Avol E, et al. Association between air pollution and lung function growth in Southern California children. Am J Respir Crit Care Med. 2000;162(4 Pt 1):1383-90.
8. Gouveia N, Mendonça GAS, Leon AP, Correia JEM, Junger WL, Freitas CU, et al. Poluição do ar e efeitos na saúde nas populações de duas grandes metropóles brasileiras. Epidemiol Serv Saude. 2003;12(1):29-40.
9. Halfon N, Newacheck PW. Childhood asthma and poverty: differential impacts and utilization of health services. Pediatrics. 1993;91(1):56-61.
10. Hirsch T, Weiland SK, von Mutius E, Safeca AF, Gräfe H, Csaplovics E, et al. Inner city air pollution and respiratory health and atopy in children. Eur Respir J. 1999;14(3):669-77. DOI: 10.1034/j.1399-3003.1999.14c29.x
11. Horak F, Studnicka M, Gartner C, Spengler JD, Tauber E, Urbanek R, et al. Particulate matter and lung function growth in children: a 3-yr follow-up study in Austrian school children. Eur Respir J. 2002;19(5):838-45. DOI: 10.1183/09031936.02.00512001
12. Mukala K, Pekkanen J, Tiittanen P, Alm S, Salonen RO, Tuomisto J. Personally measured weekly exposure to NO2 and respiratory health among preschool children. Eur Respir J. 1999;13(6):1411-7.
13. Medley AJ, Wong CM, Thach TQ, Ma S, Lam TH, Anderson HR. Cardiorespiratory and all-cause
mortality after restrictions on sulfur content of fuel in Hong Kong: an intervention study. Lancet. 2002;360(9346):1646-52. DOI: 10.1016/S0140-6736(02)11612-6
14. Pope CA III, Dockery DW. Acute health effects of PM10 pollution on symptomatic and asymptomatic
children. Am Rev Respir Dis 1992;145(5):1123-8.
15. Rios JLM, Boechat JL, Sant’Anna CC, França AT. Atmospheric pollution and the prevalence of asthma: study among schoolchildren of two areas in Rio
de Janeiro, Brazil. Ann Allergy Asthma Immunol.
2004;92(6):629-34.
16. Roemer W, Hoek G, Brunekreef B. Effect of ambient winter air pollution on respiratory health of children
with chronic respiratory symptoms. Am Rev Respir Dis.
1993;147(1):118-24.
17. Rutishauser M, Ackermann U, Braun Ch, Gnehm HP, Wanner HU. Signifi cant association between outdoor NO2 and respiratory symptoms in preschool children. Lung. 1990;168 (Suppl):347-52. DOI: 10.1007/ BF02718151
18. Saldiva PH, Lichtenfels AJ, Paiva PS, Barone IA, Martins MA, Massad E, et al. Association between air pollution and mortality due to respiratory diseases in children in São Paulo, Brazil: a preliminary report. Environ Res. 1994;65(2):218-25. DOI: 10.1006/enrs.1994.1033
19. Samet JM, Lambert WE, Skipper BJ, Cushing AH, Hunt WC, Young SA, et al. Nitrogen dioxide and respiratory illnesses in infants. Am Rev Respir Dis. 1993;148(5):1258-65.
20. Santos UP, Braga AL, Giorgi DM, Pereira LA, Grupi CJ, Lin CA, et al. Effects of air pollution on blood pressure and heart rate variability: a panel study of vehicular traffi c controllers in the city of São Paulo, Brazil. Eur Heart J. 2005;26(2):193-200. DOI: 10.1093/eurheartj/ ehi035
21. Solé D, Vanna AT, Yamada E, Rizzo MC, Naspitz CK. International study of asthma and allergies in childhood (ISAAC) written questionnaire: validation
of the asthma component among Brazilian children. J
Invest Allergol Clin Immunol. 1998;8(6):376-82.
22. Ward DJ, Ayres JG. Particulate air pollution and panel studies in children: a systematic review. Occup Environ
Med. 2004;61(4):e13. DOI: 10.1136/oem.2003.007088
23. World Health Organization. WHO air quality guidelines global update 2005: Report. Copenhagen; 2005.
24. Worldwide variation in prevalence of symptoms of asthma, allergic rhinoconjuntivitis, and atopic eczema:
ISAAC. Lancet. 1998;351(9111):1225-32. DOI:
10.1016/S0140-6736(97)07302-9
25. Wichmann HE, Heinrich J. Health effects of high level exposure to traditional pollutants in East Germany--review and ongoing research. Environ Health Perspect. 1995;103 (Suppl 2):29-35. DOI: 10.2307/3432446
REFERENCES