ACPD
13, 20677–20727, 2013Alkanes SOA yield
C. L. Loza et al.
Title Page
Abstract Introduction
Conclusions References
Tables Figures
◭ ◮
◭ ◮
Back Close
Full Screen / Esc
Printer-friendly Version Interactive Discussion
Discussion
P
a
per
|
D
iscussion
P
a
per
|
Discussion
P
a
per
|
Discuss
ion
P
a
per
|
Atmos. Chem. Phys. Discuss., 13, 20677–20727, 2013 www.atmos-chem-phys-discuss.net/13/20677/2013/ doi:10.5194/acpd-13-20677-2013
© Author(s) 2013. CC Attribution 3.0 License.
Atmospheric Chemistry and Physics
Open Access
Discussions
Geoscientiic Geoscientiic
Geoscientiic Geoscientiic
This discussion paper is/has been under review for the journal Atmospheric Chemistry and Physics (ACP). Please refer to the corresponding final paper in ACP if available.
Secondary organic aerosol yields of
12-carbon alkanes
C. L. Loza1, J. S. Craven1, L. D. Yee2, M. M. Coggon1, R. H. Schwantes2, M. Shiraiwa1,3, X. Zhang2, K. A. Schilling1, N. L. Ng4, M. R. Canagaratna5, P. J. Ziemann6, R. C. Flagan1,2, and J. H. Seinfeld1,2
1
Division of Chemistry and Chemical Engineering, California Institute of Technology, Pasadena, CA, USA
2
Division of Engineering and Applied Science, California Institute of Technology, Pasadena, CA, USA
3
Multiphase Chemistry Department, Max Planck Institute for Chemistry, Mainz, Germany
4
School of Chemical and Biomolecular Engineering and School of Earth and Atmospheric Sciences, Georgia Institute of Technology, Atlanta, GA, USA
5
Aerodyne Research, Inc., Billerica, MA, USA
6
Air Pollution Research Center, Department of Environmental Sciences, and Environmental Toxicology Graduate Program, University of California, Riverside, CA, USA
Received: 29 June 2013 – Accepted: 26 July 2013 – Published: 7 August 2013
Correspondence to: J. H. Seinfeld (seinfeld@caltech.edu)
ACPD
13, 20677–20727, 2013Alkanes SOA yield
C. L. Loza et al.
Title Page
Abstract Introduction
Conclusions References
Tables Figures
◭ ◮
◭ ◮
Back Close
Full Screen / Esc
Printer-friendly Version Interactive Discussion
Discussion
P
a
per
|
D
iscussion
P
a
per
|
Discussion
P
a
per
|
Discuss
ion
P
a
per
|
Abstract
Secondary organic aerosol (SOA) yields were measured for cyclododecane, hexyl-cyclohexane, n-dodecane, and 2-methylundecane under high- and low-NOx
condi-tions, in which alkyl peroxy radicals (RO2) react primarily with NO and HO2, re-spectively, for multiple initial alkane concentrations. Experiments were run until 95– 5
100 % of the initial alkane had reacted. Particle wall loss was evaluated as two lim-iting cases. SOA yield differed by 2 orders of magnitude between the two limiting cases, but the same trends among alkane precursors were observed for both limit-ing cases. Vapor-phase wall losses were addressed through a modellimit-ing study and increased SOA yield uncertainty by approximately 30 %. SOA yields were highest from 10
cyclododecane under both NOx conditions. Under high-NOx conditions, SOA yields
increased from 2-methylundecane<dodecane∼hexylcyclohexane<cyclododecane, consistent with previous studies. Under low-NOxconditions, SOA yields increased from 2-methylundecane∼dodecane<hexylcyclohexane<cyclododecane. The presence of cyclization in the parent alkane structure increased SOA yields, whereas the presence 15
of branch points decreased SOA yields due to increased vapor-phase fragmentation. Vapor-phase fragmentation was found to be more prevalent under high-NOxconditions
than under low-NOx conditions. For different initial concentrations of the same alkane
and same NOxconditions, SOA yield did not correlate with SOA mass throughout SOA growth, suggesting kinetically limited SOA growth for these systems.
20
1 Introduction
Alkanes are emitted from combustion sources and can comprise up to 90 % of anthro-pogenic emissions in urban areas (Rogge et al., 1993; Fraser et al., 1997; Schauer et al., 1999, 2002) and 67.5 %, 56.8 % and 82.8 % of the mass of diesel fuel, liquid gasoline, and non-tailpipe gasoline sources (Gentner et al., 2012). Upon atmospheric 25
con-ACPD
13, 20677–20727, 2013Alkanes SOA yield
C. L. Loza et al.
Title Page
Abstract Introduction
Conclusions References
Tables Figures
◭ ◮
◭ ◮
Back Close
Full Screen / Esc
Printer-friendly Version Interactive Discussion
Discussion
P
a
per
|
D
iscussion
P
a
per
|
Discussion
P
a
per
|
Discuss
ion
P
a
per
|
dense as secondary organic aerosol (SOA). Ambient lifetimes against reaction with OH range, for example, from 0.5 days forn-hexadecane to 1.4 days forn-octane (Atkinson and Arey, 2003; Seinfeld and Pandis, 2006), allowing for the transport of alkanes from urban to rural areas.
SOA formation under high-NOxconditions has received much attention. Lim and Zie-5
mann (2005, 2009a, c) developed a mechanism for linear, branched, and cyclic alkane oxidation that includes the formation of multi-generation oxidation products. SOA yields, defined as mass of SOA formed divided by mass of alkane reacted, have been mea-sured in the laboratory for C7–C25alkanes with linear, branched, and cyclic structures
(Lim and Ziemann, 2005, 2009b; Presto et al., 2010; Tkacik et al., 2012). In these 10
studies, SOA yields are reported after 50–85 % of the alkane had reacted and may not represent the maximum possible yield. Generally, SOA yield was found to increase with increasing carbon number or the presence of a cyclic structure and decrease with branching of the carbon chain.
SOA formation under low-NOx conditions has received less attention. Yee et al. 15
(2012, 2013) developed an oxidation mechanism for n-dodecane and extended it to cyclic and branched compounds. Yee et al. (2012, 2013) also identified multiple gen-erations of alkane oxidation products, and Craven et al. (2012) used positive matrix factorization to demonstrate continuous evolution of the chemical composition of SOA generated during 36 h of low-NOx dodecane photooxidation. SOA yields for select lin-20
ear and cyclic structures have been measured, and the same trends for carbon number and presence of a cyclic structure were observed under low-NOx conditions as under
high-NOx conditions (Lambe et al., 2012).
Here we report SOA yields from 12-carbon alkanes with linear, cyclic, and branched structures under both high- and low-NOx conditions. In each experiment, 95–100 % of 25
ACPD
13, 20677–20727, 2013Alkanes SOA yield
C. L. Loza et al.
Title Page
Abstract Introduction
Conclusions References
Tables Figures
◭ ◮
◭ ◮
Back Close
Full Screen / Esc
Printer-friendly Version Interactive Discussion
Discussion
P
a
per
|
D
iscussion
P
a
per
|
Discussion
P
a
per
|
Discuss
ion
P
a
per
|
2 Materials and methods
2.1 Experimental setup
Low-NOx experiments were conducted in the Caltech dual 28 m3 Teflon chambers, details of which are given elsewhere (Cocker et al., 2001; Keywood et al., 2004). High-NOx experiments were conducted in the Caltech dual 24 m
3
Teflon chambers, located 5
in a new facility that replaced the 28 m3 chamber facility. Most components of the old facility, including instrumentation, were moved to the new laboratory, which provides precise temperature control of the chambers (±1◦C) and flushing at a rate approxi-mately 3 times faster than that in the 28 m3chamber facility. The difference in chamber volume is not expected to influence the experiment outcomes. Before each experiment, 10
the chambers were flushed with dried, purified air for>24 h, until the particle number concentration<50 cm−3and the volume concentration<0.1 µm3cm−3. First, hydrogen peroxide (H2O2, 50 % wt., Sigma Aldrich) was added to the chamber by flowing purified
air over a measured volume of H2O2in a glass bulb maintained at 30–35 ◦
C. Volumes of 70 and 280 µL were used for high-NOxand low-NOx, experiments, respectively. Next, 15
seed particles were injected by atomizing a 0.015 M aqueous ammonium sulfate so-lution.n-Dodecane (Sigma Aldrich, 99+% purity), 2-methylundecane (TCI, America,
>98 % purity), or hexylcyclohexane (TCI, America,>98 % purity) was introduced into the chamber by evaporating a known alkane liquid volume with 5 L min−1 of purified air. Cyclododecane (TCI, America,>99 % purity) was introduced into the chamber by 20
evaporating a known cyclododecane mass with 5 L min−1 of purified air. During each injection, the glass bulb containing the liquid or solid alkane was heated slightly to fa-cilitate evaporation. For high-NOx experiments, approximately 100 ppbv NO was then
added to the chamber from a 510 ppmv NO in N2 cylinder (Air Liquide). The chamber
contents were allowed to mix for 1 h before beginning irradiation with 350 nm-centered 25
UV broadband lamps (40 W Sylvania 350BL). Different light intensities were used for low- and high-NOxexperiments corresponding tojNO2∼4×10
−3
continu-ACPD
13, 20677–20727, 2013Alkanes SOA yield
C. L. Loza et al.
Title Page
Abstract Introduction
Conclusions References
Tables Figures
◭ ◮
◭ ◮
Back Close
Full Screen / Esc
Printer-friendly Version Interactive Discussion
Discussion
P
a
per
|
D
iscussion
P
a
per
|
Discussion
P
a
per
|
Discuss
ion
P
a
per
|
ously injected into the chamber during the irradiation period. This additional∼21 L of N2 has a negligible effect on chamber volume. The chamber contents were irradiated
for 18 h and 30–36 h for high- and low-NOxexperiments, respectively, to achieve similar
OH exposures in all experiments.
A suite of instruments was used to study the evolution of the gas and particle phases. 5
Alkane concentrations were measured using a gas chromatograph with flame ioniza-tion detector (GC/FID, Agilent 6890N), equipped with a HP-5 column (15 m×0.53 mm ID×1.5 µm thickness, Agilent). Samples for injection into the GC/FID were taken by drawing 1.3 L of chamber air at a flow rate of 0.13 L min−3through a glass tube packed with Tenax TA resin. The glass tube was subsequently desorbed for 10 min in the in-10
let of the GC/FID at 260 and 275◦C for low- and high-NOx experiments, respectively, onto the column, held at 30◦C. After 15 min, the oven temperature was ramped at 10◦C min−1 to 280◦C and held at that temperature for 5 min. The mass response of the detector was calibrated for each alkane using Tenax tubes spiked with standard solutions and analyzed using the same method as the sample tubes. Relative humidity 15
(RH), temperature, NO, NOx, and O3 were continuously monitored. Alkane oxidation
products were detected using a custom-modified Varian 1200 triple-quadrupole chem-ical ionization mass spectrometer (CIMS). Details of operation can be found elsewhere (Crounse et al., 2006; Paulot et al., 2009; Yee et al., 2012, 2013). The CIMS was op-erated in negative mode in which CF3O− is used as the reagent ion. CF3O− clusters 20
with the analyte, R, forming ions [R·CF3O] −
at mass-to-charge ratio (m/z) [M+85]−, where M is the nominal weight of R. For acidic species, the transfer product forms ions [R·F]− atm/z [M+19]−. Some analytes can be seen in both the cluster and transfer product forms. The signal at eachm/z represents the sum of signals from all isomers contributing to thatm/z.
25
ACPD
13, 20677–20727, 2013Alkanes SOA yield
C. L. Loza et al.
Title Page
Abstract Introduction
Conclusions References
Tables Figures
◭ ◮
◭ ◮
Back Close
Full Screen / Esc
Printer-friendly Version Interactive Discussion
Discussion
P
a
per
|
D
iscussion
P
a
per
|
Discussion
P
a
per
|
Discuss
ion
P
a
per
|
configuration with a recirculating sheath and excess flow of 2.67 L min−1 and a 5.4 : 1 ratio of sheath to aerosol flow rates. The column voltage was scanned either from 10 to 1000 V over 100 s or 15 to 9850 V over 45 s.
Real-time particle mass spectra were collected continuously by an Aerodyne high resolution time-of-flight aerosol mass spectrometer (AMS, DeCarlo et al., 2006; Cana-5
garatna et al., 2007). The AMS switched between the higher resolution, lower sensi-tivity “W-mode” and the lower resolution, higher sensisensi-tivity “V-mode”. AMS data were processed using the ToF-AMS Unit Resolution Analysis Toolkit, “SQUIRREL” (http:// cires.colorado.edu/jimenez-group/ToFAMSResources/ToFSoftware/index.html), in Igor Pro Version 6.31 (Wavemetrics, Lake Oswego, OR). “V-mode” data were analyzed us-10
ing a fragmentation table to separate sulfate, ammonium, and organic spectra and to time-trace specific mass-to-charge ratios (Allan et al., 2004). “V-mode” and “W-mode” data were analyzed using the high-resolution spectra toolbox known as PIKA (Peak Integration by Key Analysis) to determine the chemical formulas contributing to dis-tinct m/z ratios (DeCarlo et al., 2006). Organic ions up to m/z 305 were used to 15
calculate elemental ratios. Craven et al. (2012) proposed formulas for organic ions with m/z>100 observed for low-NOx dodecane photooxidation SOA based on
hypothe-sized fragmentation of products formed in the dodecane photooxidation mechanism (Yee et al., 2012). Similar analysis was applied to identify organic ions withm/z>100 for SOA from all 4 alkanes investigated here under both low- and high-NOxconditions. 20
Organic ions CO+and C2H+4 were not fit in “V-mode” due to the large interference from the N+2 peak, and their signals were estimated from those of particle-phase CO+2 and C2H+3, respectively, using correlations determined from “W-mode” data, which has
bet-ter resolution of the CO+, N+2, and C2H+4 peaks. The ratio of particle-phase CO+to CO+2 varied by experiment between 0.45 and 3.5, and a specific ratio was used for each ex-25
periment (see Table S1). The ratio of C2H+4 to C2H+3 was found to be 0.47 for SOA from
dodecane, 2-methylundecane, and hexylcyclohexane and 0.40 for SOA from cyclodo-decane under both NOx conditions. Additionally, the intensities of H2O+, OH+, and O+
ACPD
13, 20677–20727, 2013Alkanes SOA yield
C. L. Loza et al.
Title Page
Abstract Introduction
Conclusions References
Tables Figures
◭ ◮
◭ ◮
Back Close
Full Screen / Esc
Printer-friendly Version Interactive Discussion
Discussion
P
a
per
|
D
iscussion
P
a
per
|
Discussion
P
a
per
|
Discuss
ion
P
a
per
|
this work were collected using “V-mode” and averaged over 1 h or 30 min intervals for low- or high-NOxexperiments, respectively.
Experimental OH concentrations were calculated from the measured alkane concen-tration, the alkane concentration decay rate, estimated from the alkane concentration fit to a differentiable function (typically, a 1- or 2-term exponential function), and the 5
alkane+OH reaction rate constant. A literature OH reaction rate constant was avail-able only for dodecane; rate constants for the other three alkanes were estimated from a relative rate experiment in which 10 ppbv of each alkane was oxidized simultaneously under low-NOxconditions (Table 1). The measured rate constant for hexylcyclohexane
is in good agreement with that calculated from structure–activity relationships (Kwok 10
and Atkinson, 1995), 17.6×10⁻¹²cm3molec−1s−1, and the measured rate constants for 2-methylundecane and cyclododecane are lower than those calculated from struc-ture–activity relationships, 13.9×10⁻¹² and 17.0×10⁻¹²cm3molec−1s−1, respectively. To calculate OH exposure, an interpolated OH concentration with a time resolution of 2–3 min is calculated from a fit to experimental data, as described previously, the alkane 15
concentration decay rate, and the alkane+OH reaction rate constant. The interpolated OH concentration is multiplied by the time between data points and summed to each time point to obtain OH exposure.
Photolysis of H2O2 under low-NOx conditions produced a constant OH radical
con-centration of (1–3)×106molec cm−3. Under high-NOx conditions, OH radicals also 20
were produced throughout the entire irradiation period, 18 h, with initial concentra-tions of (0.7–3)×107molec cm−3that decreased steadily to (1–5)×106molec cm−3 af-ter 18 h. In addition, reaction of HO2radicals with NO produced NO2, which photolyzed to produce O3. O3 concentrations peaked at 200–600 ppbv approximately halfway
through the experiment and then decreased as NO was continuously injected into the 25
ACPD
13, 20677–20727, 2013Alkanes SOA yield
C. L. Loza et al.
Title Page
Abstract Introduction
Conclusions References
Tables Figures
◭ ◮
◭ ◮
Back Close
Full Screen / Esc
Printer-friendly Version Interactive Discussion
Discussion
P
a
per
|
D
iscussion
P
a
per
|
Discussion
P
a
per
|
Discuss
ion
P
a
per
|
In addition to OH and O3, NO3 was produced under high-NOx conditions. All oxi-dant concentrations varied over the course of the experiment due to the continuous addition of NO. While O3 is not expected to react with most alkane photooxidation
products, it can react with dihydrofurans, which also react with OH and NO3. Jor-dan et al. (2008) estimated C12 dihydrofuran+OH rate constants as approximately 5
2.4×10⁻¹³cm3molec−1s−1. The rate constants for C12 dihydrofuran+O3 and C12
di-hydrofuran+NO3 were taken as 3.49×10⁻¹⁵ and 1.68×10⁻¹⁰cm3molec−1s−1, re-spectively, as measured for 4,5-dihydro-2-methylfuran by Martin et al. (2002). Using measured O3 concentrations and OH concentrations calculated from the alkane
con-centration decay, the lifetime of dihydrofuran against reaction with O3 was calculated 10
to be an order of magnitude less than the lifetime against reaction with OH for OH exposures >5×10⁶molec cm−3h (elapsed time >2 h). At lower OH exposures, re-action of dihydrofurans with OH were expected to dominate over that with O3. NO3
concentration was not measured directly, and model estimations varied by 3 orders of magnitude as O3, NOx, and OH concentrations varied during a modeled experiment. 15
For the highest estimated NO3concentrations (1×10⁷molec cm−3), the lifetime of dihy-drofuran against reaction with NO3was comparable to that of reaction with O3, and at the lowest estimated concentrations, the lifetime was an order of magnitude larger than that of reaction with OH. In an urban area such as Mexico City with peak OH, O3, and
NO3(daytime) concentrations of 4.6×10 6
, (0.74–2.0)×1012, and 2.4×10⁷molec cm−3, 20
respectively (Molina et al., 2010; Stephens et al., 2008; Volkamer et al., 2010), the estimated lifetimes of dihydrofuran against reaction with these compounds are 15 min, 2.4–6.4 min, and 4.1 min, respectively. The conditions in the present experiments are consistent with the shorter lifetime of dihydrofuran reaction against O3than OH in the
atmosphere and, at the largest estimated NO3 concentration, consistent with similar 25
lifetimes of dihydrofuran reaction against O3 and NO3 in the atmosphere. Additionally, NO3 is not a significant sink of either the parent alkane or RO2 radicals even at the
ACPD
13, 20677–20727, 2013Alkanes SOA yield
C. L. Loza et al.
Title Page
Abstract Introduction
Conclusions References
Tables Figures
◭ ◮
◭ ◮
Back Close
Full Screen / Esc
Printer-friendly Version Interactive Discussion
Discussion
P
a
per
|
D
iscussion
P
a
per
|
Discussion
P
a
per
|
Discuss
ion
P
a
per
|
2.2 SOA yield calculations
Particles deposited to the chamber walls are accounted for when calculating the mass concentration of organic aerosol formed. Particle wall loss corrections were made us-ing the two limitus-ing assumptions of gas-particle partitionus-ing (Weitkamp et al., 2007; Hildebrandt et al., 2009; Loza et al., 2012). In one limit, no suspended vapors are as-5
sumed to condense on deposited particles. This limit is termed the lower limit because it represents the smallest possible SOA mass formed during growth. In the other limit, deposited particles are assumed to interact with suspended vapors to the same extent as suspended particles. This limit is termed the upper limit because it represents the largest possible SOA mass formed during growth. A new approach to calculate both 10
upper and lower limit wall loss solely from suspended particle number-size distribution data is described in Appendix A. This approach is an extension of the Aerosol Pa-rameterization Estimation model (Pierce et al., 2008) to calculate both limits to particle wall loss corrections. Total particle volume concentration was calculated from the wall-loss corrected number-size distributions. To obtain SOA mass concentration, the seed 15
particle volume concentration was subtracted from the total particle volume concentra-tion, and the resulting organic particle volume concentration was multiplied by the SOA density, calculated from DMA and AMS data from a separate experiment (see Table 1). SOA yield, Y, was calculated for both upper and lower limit SOA mass concentra-tions,∆Mo(µg m
−3
), using 20
Y= ∆Mo
∆HC (1)
where∆HC (µg m−3) is the mass concentration of alkane reacted.
In addition to particle-phase wall losses, vapor-phase wall losses of 12-carbon al-cohols and ketones have been observed in laboratory chambers (Matsunaga and Zie-mann, 2010). If vapors condense on chamber walls instead of on particles, then SOA 25
ACPD
13, 20677–20727, 2013Alkanes SOA yield
C. L. Loza et al.
Title Page
Abstract Introduction
Conclusions References
Tables Figures
◭ ◮
◭ ◮
Back Close
Full Screen / Esc
Printer-friendly Version Interactive Discussion
Discussion
P
a
per
|
D
iscussion
P
a
per
|
Discussion
P
a
per
|
Discuss
ion
P
a
per
|
yields presented here; the effect of vapor wall losses on SOA yields is discussed in Sect. 3.4.
3 Results and discussion
For most SOA precursors, a larger initial hydrocarbon concentration translates into a larger source of semivolatile oxidation products, assuming that reactions occur at the 5
same temperature and oxidizing conditions and that the vapor-phase product distribu-tions do not vary over the range of initial hydrocarbon concentradistribu-tions considered. The presence of more condensible products facilitates partitioning of semivolatile product species to the particle phase, leading to increased yields relative to lower concentra-tion experiments. Oxidant exposure also affects SOA yield. SOA yield increases with 10
increasing oxidant exposure as the hydrocarbon reacts forming multiple generations of semivolatile products; however, with ever-increasing oxidation, fragmentation reactions will begin to dominate over functionalization reactions, producing volatile products that do not condense or evaporate from the condensed phase and decreasing SOA yield.
3.1 High-NOxSOA yield measurements
15
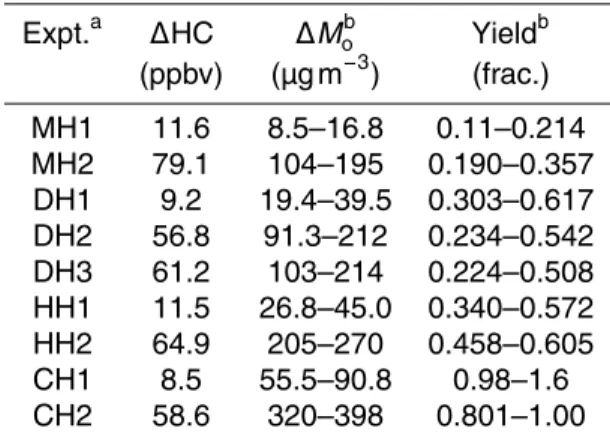
Conditions for high-NOx experiments are given in Table 2. The reported ∆Mo and
yield correspond to approximately 18 h of irradiation and an OH exposure of (6– 12)×107molec cm−3h. By this point, at least 95 % of the initial hydrocarbon had re-acted. SOA growth occurred continuously as the alkane rere-acted. Figure 2a shows the SOA yield after approximately 18 h of irradiation as a function of hydrocarbon concen-20
ACPD
13, 20677–20727, 2013Alkanes SOA yield
C. L. Loza et al.
Title Page
Abstract Introduction
Conclusions References
Tables Figures
◭ ◮
◭ ◮
Back Close
Full Screen / Esc
Printer-friendly Version Interactive Discussion
Discussion
P
a
per
|
D
iscussion
P
a
per
|
Discussion
P
a
per
|
Discuss
ion
P
a
per
|
cane and hexylcyclohexane yields were similar. These results are consistent with the relationship between alkane structure and SOA yield observed by Lim and Ziemann (2009b) and Tkacik et al. (2012). When comparing the yields for each compound be-tween the two initial hydrocarbon concentration regimes, no clear patterns emerge. For 2-methylundecane and hexylcyclohexane, the yield increases as initial alkane con-5
centration increases. For dodecane and cyclododecane, the yield decreases as initial alkane concentration increases. This behavior will be discussed further in Sect. 3.5.
For cyclododecane and hexylcyclohexane, a large difference between upper and lower limit yields is observed in Fig. 2 for experiments with∆HC<100 µg m−3. These experiments had approximately 10 ppbv initial alkane. For experiments shown in Fig. 2 10
with∆HC>100 µg m−3, those with 60–80 ppbv initial alkane, SOA growth began soon after the onset of irradiation, increasing the suspended particle number-size distribution peak diameter to 250–350 nm. During the experiments with∼10 ppbv initial alkane, SOA growth did not begin immediately, and the suspended particle number-size distri-bution peak diameter remained below 200 nm for most of the experiment. The temporal 15
trend of suspended particle number-size distribution peak diameter for the high-NOx
cyclododecane experiments is shown in Fig. S1. In the Caltech chambers, particle wall loss rate constants are lowest for 200–300 nm particles (Fig. S1, right panel). Typical seed particle number-size distribution peak diameters are 40–60 nm. Because parti-cle growth is slower in ∼10 ppbv initial alkane experiments and particles remain at 20
a smaller diameter for longer times, more particles are lost to the wall before and during SOA growth in∼10 ppbv initial alkane experiments than in those with 60–80 ppbv initial alkane, owing to the size-dependence of particle wall loss. Therefore, a large difference between lower and upper limit yields is observed for the∼10 ppbv initial alkane exper-iments. Less overall SOA growth is observed for dodecane and 2-methylundecane; as 25
a result, less difference is observed between the lower and upper limit yields.
ACPD
13, 20677–20727, 2013Alkanes SOA yield
C. L. Loza et al.
Title Page
Abstract Introduction
Conclusions References
Tables Figures
◭ ◮
◭ ◮
Back Close
Full Screen / Esc
Printer-friendly Version Interactive Discussion
Discussion
P
a
per
|
D
iscussion
P
a
per
|
Discussion
P
a
per
|
Discuss
ion
P
a
per
|
to form SOA. SOA yields >1 have been observed previously from longifolene pho-tooxidation under high-NOx conditions (Ng et al., 2007a). To determine if the SOA
mass produced violated mass conservation, an estimation of maximum potential SOA mass concentration was calculated assuming that all oxidation products formed from the reacted cyclododecane condensed. For the estimation, the average SOA molecular 5
weight was calculated from the oxygen-to-carbon (O : C), hydrogen-to-carbon (H : C), and nitrogen-to-carbon (N : C) ratios measured by the AMS, assuming that condensed species retain 12 carbon atoms. Note that ions NO+ and NO+2 are included in these calculations and will be discussed further in Sect. 3.5. To calculate the maximum po-tential SOA mass concentration, the molar concentration of cyclododecane reacted is 10
multiplied by the average SOA molecular weight. This SOA mass concentration is then compared to the observed SOA mass concentration. For experiment CH1 (cyclodode-cane), the maximum potential SOA formed was 84 µg m−3, which is greater than the lower wall loss limit∆Mo but less than the upper wall loss limit ∆Mo. For experiment CH2 (cyclododecane), the maximum potential SOA formed was 519 µg m−3, which is 15
greater than both the lower and upper bound limit∆Mo. All observed cyclododecane
yields except for the upper wall loss limit yield for CH1 do not violate mass conserva-tion. It is likely that uncertainties in deposited particle growth rates calculated in the upper limit wall loss correction method (see Appendix A) cause the upper limit yield for CH1 to be overestimated.
20
Previous studies exist of SOA yields under high-NOx conditions for dodecane,
2-methylundecane, and cyclododecane. Lim and Ziemann (2009b) measured SOA yields for all three compounds with initial alkane concentrations of approximately 1 ppmv, of which 76–83 % was oxidized at the point at which yields were calculated. In the present work, yields were calculated for lower initial alkane concentrations with a larger 25
ACPD
13, 20677–20727, 2013Alkanes SOA yield
C. L. Loza et al.
Title Page
Abstract Introduction
Conclusions References
Tables Figures
◭ ◮
◭ ◮
Back Close
Full Screen / Esc
Printer-friendly Version Interactive Discussion
Discussion
P
a
per
|
D
iscussion
P
a
per
|
Discussion
P
a
per
|
Discuss
ion
P
a
per
|
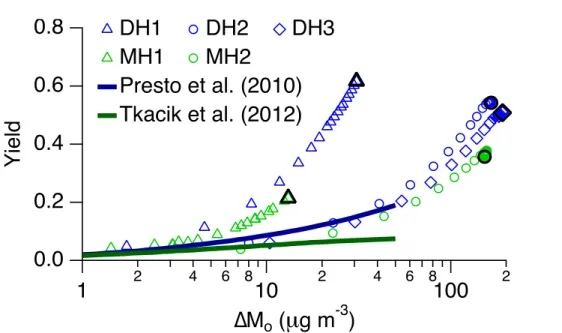
for dodecane oxidation for 19.1 and 57.8 ppbv initial alkane, and Tkacik et al. (2012) reported SOA yields from 2-methylundecane oxidation for a low alkane concentration (initial alkane concentrations were not specified). Both studies parameterized yields using the volatility basis set (VBS) for∆Mo<50 µg m−3. A comparison of the present work to these studies is shown in Fig. 3. Both Presto et al. (2010) and Tkacik et al. 5
(2012) report the upper limit to particle wall losses. For comparison to these previous studies, the upper limit to particle wall losses and a unit SOA density were used to calculate yields for experiments DH1, DH2, DH3, MH1, and MH2 shown in Fig. 3. The dodecane VBS parameterization presented by Presto et al. (2010) matches the higher final∆Mododecane experiments, DH2 and DH3, for∆Mo<50 µg m−3; however, it does 10
not match the lower final∆Mo dodecane experiment, DH1. This discrepancy can be attributed to different OH exposure. Presto et al. (2010) achieved an OH exposure of approximately 1.2×10⁷molec cm−3h and did not react all of the parent alkane, whereas OH exposure in the present experiments was approximately 7×10⁷molec cm−3h and at>95 % of the parent alkane reacted. Similar results are observed when comparing 15
2-methylundecane yields from Tkacik et al. (2012) with those in the present study. The OH exposure achieved in Tkacik et al. (2012), 6×10⁶molec cm−3h, was also lower than that achieved in the present work.
3.2 Low-NOxSOA yield measurements
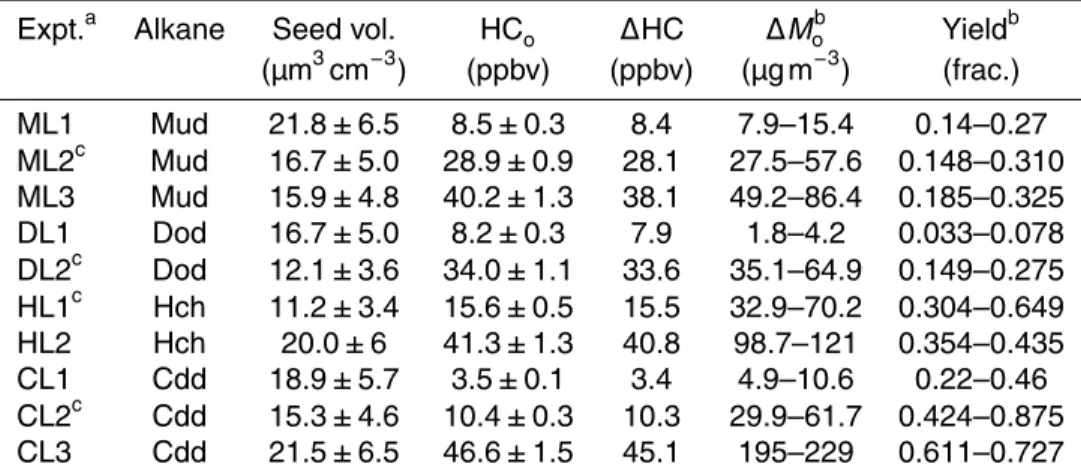
Conditions for low-NOx experiments are presented in Table 3. ∆Mo and SOA yield 20
measurements are reported after 30–36 h irradiation, corresponding to OH exposures of (6–12)×107molec cm−3h, for which at least 95 % of the initial alkane reacted. Fig-ure 2b shows the SOA yield after 30–36 h irradiation, and, as for the high-NOxdata, the
top and bottom of each line correspond to the upper and lower limits to the particle wall loss correction, respectively. The highest yields are observed for cyclododecane, fol-25
ACPD
13, 20677–20727, 2013Alkanes SOA yield
C. L. Loza et al.
Title Page
Abstract Introduction
Conclusions References
Tables Figures
◭ ◮
◭ ◮
Back Close
Full Screen / Esc
Printer-friendly Version Interactive Discussion
Discussion
P
a
per
|
D
iscussion
P
a
per
|
Discussion
P
a
per
|
Discuss
ion
P
a
per
|
Sect. 3.5. As with the high-NOxyields, there are no compound-specific trends for SOA yield with initial alkane concentration.
SOA yields under low-NOx conditions have not been reported previously for the
compounds studied here. SOA yields under low-NOx conditions have been reported for n-decane and n-pentadecane in a Potential Aerosol Mass flow reactor (Lambe 5
et al., 2012). Lambe et al. (2012) reported maximum yields of 0.39 and 0.69 at OH exposures of 1.4×10⁸and 9.7×10⁷molec cm−3h and SOA concentrations of 231 and 100 µg m−3for decane and pentadecane, respectively. The dodecane SOA yield is ex-pected to lie between those for longer and shorter chain alkanes; however, the do-decane SOA yields measured in the present study (Table 3) are less than that mea-10
sured for 231 µg m−3 decane, a much larger initial concentration than those used in the present experiments, by Lambe et al. (2012) at similar OH exposure. Lambe et al. (2012) note that the maximum SOA yield for pentadecane at 16 µg m−3is 0.21, which is in much better agreement with the dodecane SOA concentrations and SOA yields in the present study.
15
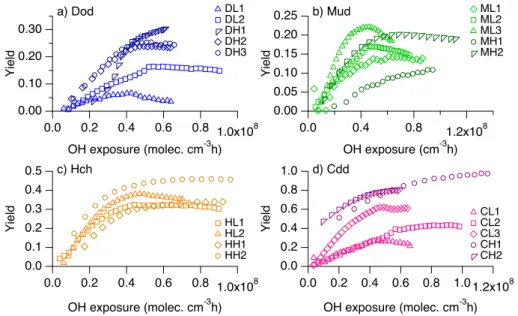
3.3 Comparison of SOA yields under high- and low-NOxconditions
High- and low-NOxSOA yields for each of the alkanes as a function of cumulative OH exposure using lower and upper limits to particle wall loss corrections are shown in Figs. 4 and 5, respectively. The same trends are observed for each limiting case. For a number of SOA systems, SOA yields are higher under low-NOxconditions than under 20
high-NOxconditions (e.g. Song et al., 2005; Ng et al., 2007a; Eddingsaas et al., 2012). A likely explanation is that alkoxy radicals (RO) produced from the reaction of alkyl peroxy radicals (RO2) and NO undergo fragmentation to form higher volatility species,
whereas hydroperoxides produced from the reaction of RO2and HO2do not. With less fragmentation under low-NOx conditions, the carbon chain is preserved, resulting in 25
higher yields when compared with those observed for high-NOx conditions. For linear
ACPD
13, 20677–20727, 2013Alkanes SOA yield
C. L. Loza et al.
Title Page
Abstract Introduction
Conclusions References
Tables Figures
◭ ◮
◭ ◮
Back Close
Full Screen / Esc
Printer-friendly Version Interactive Discussion
Discussion
P
a
per
|
D
iscussion
P
a
per
|
Discussion
P
a
per
|
Discuss
ion
P
a
per
|
volatility than fragmentation products (Lim and Ziemann, 2009a). As a result, yields under low- and high-NOxconditions for these larger alkanes are similar. The effects of
parent alkane structure and NOxconditions will be discussed further in Sect. 3.6.
Maximum SOA yields are achieved after (4–6)×107molec cm−3h OH exposure re-gardless of NOx condition. Lambe et al. (2012) observed an increase, peak, and de-5
crease of SOA yield with increasing OH exposure attributable to a transition from func-tionalization to fragmentation reactions; the OH exposures achieved in the present study were not large enough to observe similar phenomena.
In Fig. 3, it is interesting to note that different SOA yields are observed from the same alkane and∆Mofor different initial alkane concentrations (e.g. at∆Mo=10 µg m
−3
, the 10
yield from 9 ppbv dodecane, DH1, is 0.27, whereas the yield from 57–61 ppbv dode-cane, DH2 and DH3, is 0.06). This trend is observed for all four compounds under both high- and low-NOx conditions and suggests that parameterizing yields for these
alkanes in terms of∆Mo, i.e. assuming quasi-equilibrium growth, is not useful.
Shiraiwa et al. (2013) predicted that the behavior of the particle size distribution 15
during low-NOx dodecane photooxidation is consistent with kinetically limited, rather
than quasi-equilibrium, growth. Other ambient and laboratory studies also suggest that SOA growth can be kinetically limited (Riipinen et al., 2011; Perraud et al., 2012). For kinetically limited SOA growth, SOA yield should be a function of total particle surface area; however, for the same alkane and NOx conditions and a given particle surface 20
area, different SOA yields were observed, similar to the results presented in Fig. 3. Instead, SOA yields were parameterized by number of semivolatile organic compound (SVOC)-particle collisions. Total SVOC concentration was simulated for the case of do-decane low-NOxphotooxidation using a kinetic multi-layer model of gas-particle
inter-actions (KM-GAP) (Shiraiwa et al., 2012; Shiraiwa and Seinfeld, 2012; Shiraiwa et al., 25
ACPD
13, 20677–20727, 2013Alkanes SOA yield
C. L. Loza et al.
Title Page
Abstract Introduction
Conclusions References
Tables Figures
◭ ◮
◭ ◮
Back Close
Full Screen / Esc
Printer-friendly Version Interactive Discussion
Discussion
P
a
per
|
D
iscussion
P
a
per
|
Discussion
P
a
per
|
Discuss
ion
P
a
per
|
(molec cm−3s−1), is
JA=
1
4cAcA (2)
wherecAis the SVOC concentration (molec cm −3
) andcAis the mean molecular speed
of SVOC (cm s−1).JAcan be calculated for discrete time points,i, in an experiment cor-responding to particle surface area measurements. The following summation is used 5
to calculate cumulative number of SVOC-particle collisions per unit chamber volume, Csum(cm−3),
Csum=
n
X
i=1
JA,iSi∆ti (3)
wheren is the total number of data points,Si is the particle surface area (cm 2
cm−3), and∆ti is the time between data pointsiandi+1 (s). Here the upper limit wall-loss cor-10
rected surface area concentration is used to correspond to the model, which does not simulate particle wall losses. Figure 6 shows yield as a function ofCsum for the
dode-cane low-NOxphotooxidation system. Calculations were made with a time resolution of 3 min, but hourly averaged data are displayed. The SOA yields from both experiments trend similarly with Csum. This result indicates that analysis of chamber experiments 15
with kinetic-flux modeling is instructive and that parameterizing SOA yields simply as a function of∆Momay not always be suitable.
3.4 Effect of vapor wall losses on SOA yields
Condensible species can partition to suspended particles, deposited particles, and the chamber walls. The SOA yields reported here account for the first two processes, but 20
ob-ACPD
13, 20677–20727, 2013Alkanes SOA yield
C. L. Loza et al.
Title Page
Abstract Introduction
Conclusions References
Tables Figures
◭ ◮
◭ ◮
Back Close
Full Screen / Esc
Printer-friendly Version Interactive Discussion
Discussion
P
a
per
|
D
iscussion
P
a
per
|
Discussion
P
a
per
|
Discuss
ion
P
a
per
|
served vapor wall losses for alkanes, ketones, and alcohols that are relevant to com-pounds formed in the present systems. The extent of vapor phase wall losses in both of the Caltech chamber facilities was investigated using experiments in which a known volume of dodecanone, dodecanol, or dodecane was injected into a chamber filled with purified air. The signal for each species was monitored over a period of several hours. 5
Dodecane wall losses were not significant in either chamber. In the 28 m3 chamber used for low-NOx experiments, 2-dodecanone wall losses followed first-order kinetics with a rate constant of kw=2.2×10⁻⁶s−1 (τ=5.3 days). In the 24 m3 chamber used for high-NOx experiments, 2-dodecanol wall losses followed first-order kinetics with
a rate constant ofkw=1.5×10 −6
s−1 (τ=7.7 days). Matsunaga and Ziemann (2010) 10
observed 20 % wall loss of 2-dodecanol in 80 min and 25 % wall loss of 2-dodecanone in 25 min, which equate to first order wall loss rate constants of kw=3.4×10
−4
s−1 (τ=49 min) and kw=9.2×10
−4
s−1 (τ=18 min) for 2-dodecanol and 2-dodecanone, respectively; after the initial decrease, the 2-dodecanone concentration remained con-stant for 400 min, presumably after equilibrium was achieved between the suspended 15
vapors and those sorbed to the walls. Equilibrium was not observed for either com-pound in the Caltech chambers over a 22 h period, and it was not possible to detect rapid initial losses in the Caltech chambers as a result of the chamber setup and injec-tion procedures. The time required to inject measurable concentrainjec-tions of each com-pound into the chamber was at least 25 min, and because there is no active mixing in 20
the Caltech chambers, it was necessary to wait an additional 20 min after the end of the injection for the chamber contents to mix. Rapid vapor wall losses occurring during this time period are difficult to distinguish from changes in compound concentration due to injection and mixing. Finally, alkane photooxidation generates a variety of products with multiple functionalization; however, only singly-functionalized compounds were tested 25
as-ACPD
13, 20677–20727, 2013Alkanes SOA yield
C. L. Loza et al.
Title Page
Abstract Introduction
Conclusions References
Tables Figures
◭ ◮
◭ ◮
Back Close
Full Screen / Esc
Printer-friendly Version Interactive Discussion
Discussion
P
a
per
|
D
iscussion
P
a
per
|
Discussion
P
a
per
|
Discuss
ion
P
a
per
|
sumed vapor wall losses follow pseudo-first order kinetics and varied vapor wall loss rate constants of SVOCs generated in KM-GAP simulations of dodecane low-NOx
pho-tooxidation. Usingkw=9.6×10 −6
s−1, the highest value considered, led to a decrease of the SOA mass concentration by approximately 30 %. As a result, SOA yield would increase by 30 %. The combined uncertainties of vapor and particle phase wall loss 5
result in a factor of 2–3 difference between the upper and lower limits to SOA yields in each system.
3.5 Aerosol chemical composition
Organonitrates have been identified previously as products from alkane high-NOx pho-tooxidation and are expected to be present in the particle phase (Lim and Ziemann, 10
2005). The AMS can detect organic nitrates as NO+ and NO+2, but inorganic nitrates also contribute signal to these ions (Farmer et al., 2010). During the high-NOx exper-iments, NO+ and NO+2 trend with organic growth measured by the AMS. During this time, nitric acid is also formed from reaction of NO2with OH and can partition to
par-ticles and interact with the ammonium sulfate seed. The ratio of NO+: NO+2 observed 15
during photooxidation experiments is higher than that from AMS ionization efficiency calibrations, in which ammonium nitrate is atomized into the AMS, indicating that the NO+ and NO+2 signals are unlikely from inorganic nitrates. Because there is evidence that the signals for NO+ and NO+2 likely come from organonitrates in the present ex-periments, these ions are included when calculating the total organic mass from AMS 20
data. According to a proposed decomposition pathway for organonitrates (Francisco and Krylowski, 2005; Farmer et al., 2010), the oxygens in NO+and NO+2 are not bound directly to a carbon atom. Therefore, the ion signals at NO+and NO+2 were not included in elemental ratios used to calculate average carbon oxidation state.
Average carbon oxidation state, OSC, (Kroll et al., 2011) was calculated from AMS 25
measurements for comparison of the alkane systems. SOA OSC from each parent
condi-ACPD
13, 20677–20727, 2013Alkanes SOA yield
C. L. Loza et al.
Title Page
Abstract Introduction
Conclusions References
Tables Figures
◭ ◮
◭ ◮
Back Close
Full Screen / Esc
Printer-friendly Version Interactive Discussion
Discussion
P
a
per
|
D
iscussion
P
a
per
|
Discussion
P
a
per
|
Discuss
ion
P
a
per
|
tions, and OH exposure; therefore, data only for cyclododecane are shown in Fig. 7. Under both high- and low-NOx conditions, SOA formed from a lower initial
cyclodode-cane concentration was characterized by a higher OSC. This trend has been observed in other systems (Shilling et al., 2009) and is expected because a higher initial alkane concentration increases the concentrations of semivolatile products, which have lower 5
OSC than low volatility products, in both the gas and particle phases. Under low-NOx conditions, SOA OSCdecreases for OH exposures of 0–2×10⁷molec cm−3h and then gradually increases with increasing OH exposure. Other studies have reported simi-lar trends for O : C formed under low-NOx conditions (Lambe et al., 2012; Loza et al.,
2012). This trend is attributed to initial condensation of a small amount of low-volatility 10
oxidation products followed by condensation of semivolatile products as the SOA mass increases, and then condensation of more low-volatility products as gas-phase oxida-tion progresses. Under low-NOx conditions, over 95 % of the aerosol mass measured by the AMS in the present experiments comes from ions with chemical formulae of CxH+y, CxHyO+, and CxHyO+2. Initially, the contributions of ions with formula CxH+y are 15
approximately equal to the sum of those with formulae CxHyO+ and CxHyO+2, but as
OH exposure increases to 2×10⁷molec cm−3h, the contributions from ions with for-mula CxH+y begin to dominate, presumably as more semivolatile species condense.
At OH exposures above 2×10⁷molec cm−3h, contributions from ions with formulae CxHyO+ and CxHyO+2 increase and those with formula CxH+y decrease but still com-20
prise a majority of the organic mass. For low-NOx alkane photooxidation, it has been
suggested that peroxyhemiacetal formation triggers initial SOA growth (Yee et al., 2012, 2013; Shiraiwa et al., 2013). The hydroperoxides thought to contribute to initial perox-yhemiacetal formation, such as the carbonyl hydroperoxide, have multiple functional groups, which could explain the initial, higher OSCvalues. As the particles grow, other, 25
ACPD
13, 20677–20727, 2013Alkanes SOA yield
C. L. Loza et al.
Title Page
Abstract Introduction
Conclusions References
Tables Figures
◭ ◮
◭ ◮
Back Close
Full Screen / Esc
Printer-friendly Version Interactive Discussion
Discussion
P
a
per
|
D
iscussion
P
a
per
|
Discussion
P
a
per
|
Discuss
ion
P
a
per
|
photoxidation and proposed for cyclododecane photoxidation and also could partition to particles, increasing OSC. Although the proposed SOA products have multiple
oxy-gen moities, much of the carbon chain is not functionalized, and CxH+y fragments are
expected to dominate the mass spectrum.
Under high-NOx conditions, an initial decrease in OSC was not prominent, and the 5
increase in OSCas OH exposure increased was less when compared to that under low-NOx conditions. When comparing high- and low-NOx experiments with similar initial
cyclododecane concentration (CL2 with CH1 or CL3 with CH2), SOA formed under high-NOx conditions has a higher OSC during SOA growth but similar OSC after all cyclododecane reacted. These trends indicate that less OH exposure is required to 10
form low-volatility products under high-NOxconditions than under low-NOxconditions.
A similar trend was observed by Presto et al. (2009), who used a thermodenuder to measure the volatility of heptadecane SOA formed under high- and low-NOxconditions.
The estimated vapor pressures of many of the condensible species produced under high- and low-NOxdodecane photooxidation are similar (Jordan et al., 2008; Yee et al., 15
2012), but the experimental conditions control the rate at which these compounds are formed.
Alkane oxidation by OH generates RO2, which can react with NO, HO2, or another RO2. RO2 can also react with NO2, but the peroxynitrates formed quickly decompose
back to RO2 and NO2; this pathway will not be considered here. In the present ex-20
periments, RO2 reacted primarily with HO2 under low-NOx conditions and with NO under high-NOx conditions. NO concentration was measured directly and varied from
2–100 ppbv, and HO2 concentration was estimated from a photochemical model as
approximately 1×1010cm−3(Yee et al., 2012). Using RO2reaction rate constants from the Master Chemical Mechanism 3.2 (http://mcm.leeds.ac.uk/MCM; Jenkin et al., 2003; 25
Saunders et al., 2003), the lifetimes of RO2 reaction with NO and HO2are estimated
as 0.04–2 and 4 s, respectively. Shorter RO2 lifetimes under high-NOx conditions will
ACPD
13, 20677–20727, 2013Alkanes SOA yield
C. L. Loza et al.
Title Page
Abstract Introduction
Conclusions References
Tables Figures
◭ ◮
◭ ◮
Back Close
Full Screen / Esc
Printer-friendly Version Interactive Discussion
Discussion
P
a
per
|
D
iscussion
P
a
per
|
Discussion
P
a
per
|
Discuss
ion
P
a
per
|
3.6 Effect of gas-phase fragmentation reactions on SOA yield
Additional trends between alkane structure, bulk SOA chemical composition, and SOA yield can be observed from the AMS mass spectra. Ions can be grouped into “families” according to their elemental composition. The mass spectra are dominated by ions in family CH, ions with formula CxH+y, and family CHO1, ions with formula CxHyO+. Fig-5
ures 8 and 9 show the contribution of ions in each family as a function of the number of carbon atoms in each ion and the total family contribution for a 30 min averaged sam-ple obtained after 95–100 % of the initial alkane concentration reacted. Only data from experiments with higher alkane concentration (>50 ppbv and>25 ppbv for high- and low-NOx, respectively) are shown; similar trends were observed in experiments with 10
lower initial alkane concentrations. In the present study, an increase in yield is char-acterized by larger mass fractions of ions containing 9 or more carbon atoms. Under high-NOx conditions, the total mass fractions of family CH ions for cyclododecane and dodecane SOA are higher than those for 2-methylundecane and hexylcylohexane SOA (Fig. 8a), and the trend is reversed for ions in family CHO1 (Fig. 8). The same trend is 15
not observed under low-NOxconditions, although compounds with a larger mass frac-tion of family CH ions have smaller mass fracfrac-tions of family CHO1 ions. These trends provide insight into the significance of gas-phase fragmentation reactions under high-and low-NOxconditions.
During photooxidation, the prevalence of branching in a compound is expected 20
to lead to increased fragmentation, requiring more functionalization to produce con-densible species. Greater functionalization increases the oxygen content of prod-uct molecules, thus it is reasonable that SOA from branched compounds, 2-methylundecane and hexylcyclohexane, has a higher mass fraction of family CHO1 ions than that from compounds with less branching, cyclododecane and dodecane. 25
These trends are not as apparent under low-NOxconditions, suggesting that the frag-mentation pathway may not be as important under low-NOxconditions as under
ACPD
13, 20677–20727, 2013Alkanes SOA yield
C. L. Loza et al.
Title Page
Abstract Introduction
Conclusions References
Tables Figures
◭ ◮
◭ ◮
Back Close
Full Screen / Esc
Printer-friendly Version Interactive Discussion
Discussion
P
a
per
|
D
iscussion
P
a
per
|
Discussion
P
a
per
|
Discuss
ion
P
a
per
|
oxidation products, it results in ring-opening, which preserves the carbon backbone and does not produce a higher-volatility species. Hexylcyclohexane is also a cyclic compound, and an alkoxy radical on the ringα to the branch point may result in ring-opening, which preserves the carbon backbone; thus, fragmentation of hexylcyclohex-ane will not always result in generation of species with fewer carbon atoms than the 5
parent molecule.
Gas-phase fragmentation products from high-NOx alkane photooxidation were
de-tected using the CIMS (Table S3). The proposed products have been grouped into “fam-ilies” by functionality: carboxylic acid (CnH2nO2), hydroxy carboxylic acid (CnH2nO3), carbonyl nitrate (CnH(2n−1)NO4), or hydroxynitrate (CnH(2n+1)NO4), wherenis the num-10
ber of carbon atoms in the proposed molecule. Figure 10 shows the signal for each product, normalized by∆HC for a 30 min averaged sample obtained after 95–100 % of the initial alkane concentration reacted. The data are presented assuming that CIMS sensitivity is independent ofn for a given family and that sensitivity is the same for all isomers (including cyclic and branched structures) for a givennand family. Concentra-15
tion calibrations were not performed for all species presented, and trends of ion signal with carbon number are not evaluated. Because the CIMS has unit mass resolution and can detect ions produced as transfer (m/z=[M+19]−) and cluster (m/z=[M+85]−) products, the signals in Fig. 10b could come from an acid or a hydroperoxide. Under high-NOx conditions, hydroperoxide production is not expected. For almost all prod-20
ucts shown in Fig. 10, signals in the cyclododecane experiment are lower than those for the other three alkanes, suggesting that cyclododecane oxidation products undergo little fragmentation, consistent with trends obtained from AMS data. More fragmenta-tion of 2-methylundecane and hexylcyclohexane oxidafragmenta-tion products is expected than for those of dodecane; however, the signal from fragmentation products for most fam-25
ilies are similar for dodecane, 2-methylundecane, and hexylcyclohexane, suggesting that some fragmentation also occurs during dodecane high-NOx photooxidation.
Gas-phase fragmentation reactions can also occur under low-NOx conditions from
ACPD
13, 20677–20727, 2013Alkanes SOA yield
C. L. Loza et al.
Title Page
Abstract Introduction
Conclusions References
Tables Figures
◭ ◮
◭ ◮
Back Close
Full Screen / Esc
Printer-friendly Version Interactive Discussion
Discussion
P
a
per
|
D
iscussion
P
a
per
|
Discussion
P
a
per
|
Discuss
ion
P
a
per
|
an alkoxy radical, which can isomerize or decompose depending on the carbon back-bone structure. For dodecane, hydroperoxide photolysis is expected to be a minor re-action pathway compared with OH oxidation. The specific case of photolysis of a hy-droperoxy group adjacent to a carbonyl produces an aldehyde, which has been shown to react with hydroperoxides to form peroxyhemiacetals. Peroxyhemiacetal formation 5
is proposed to initiate SOA growth in the alkane low-NOx photooxidation system (Yee
et al., 2012, 2013; Shiraiwa et al., 2013). In this case, fragmentation reactions depend more on the relative position of hydroperoxy and carbonyl groups than the structure of the carbon backbone.
When comparing SOA yields between low- and high-NOx conditions for each com-10
pound (Fig. 4), three dominant trends are observed. (1) Under high-NOx conditions,
SOA yields for dodecane and cyclododecane are larger for lower initial alkane concen-tration. (2) For hexylcyclohexane and, more noticeably, 2-methylundecane, SOA yields under high-NOx conditions are higher when the initial alkane concentration is higher.
(3) SOA yields for dodecane and cyclododecane are higher under high-NOxconditions 15
than under low-NOx conditions. Trends (1) and (2) arise from the role of
fragmenta-tion under high-NOx conditions. At higher initial alkane concentrations, semivolatile
species can condense preferentially to particles, whereas, for lower initial alkane con-centrations, semivolatile species remain in the gas phase for further oxidation. For lin-ear or cyclic compounds, further oxidation decreases compound volatility, resulting in 20
additional SOA formation and higher SOA yields. However, for branched compounds, further oxidation results in fragmentation, leading to higher volatility species that do not condense to form additional SOA. At sufficiently high OH exposures, fragmenta-tion will become important for all systems that form SOA (Lambe et al., 2012), but those conditions were not reached in the present experiments. Trend (3) results from 25
differences in the extent of fragmentation under both NOxconditions. Dodecane and
2-methylundecane have almost identical chemical structures, and one may expect these two compounds to have similar SOA yields. Under low-NOxconditions, the SOA yields
ACPD
13, 20677–20727, 2013Alkanes SOA yield
C. L. Loza et al.
Title Page
Abstract Introduction
Conclusions References
Tables Figures
◭ ◮
◭ ◮
Back Close
Full Screen / Esc
Printer-friendly Version Interactive Discussion
Discussion
P
a
per
|
D
iscussion
P
a
per
|
Discussion
P
a
per
|
Discuss
ion
P
a
per
|
is higher than that observed in DL1), whereas under high-NOxconditions, higher SOA yields are observed for dodecane than for 2-methylundecane (see Tables 2 and 3). High-NOxSOA yields are greater than low-NOxyields for unbranched compounds, but
high- and low-NOx SOA yields are similar for branched compounds as a result of en-hanced fragmentation under high-NOx conditions.
5
4 Conclusions
In the present study SOA yields have been measured for linear, cyclic, and branched 12-carbon alkanes under high- and low-NOx conditions in which 95–100 % of the
alkane reacted. The highest SOA yields were observed from cyclic alkanes, and the presence of branch points decreased SOA yield, primarily under high-NOx conditions 10
where vapor-phase fragmentation reactions were more likely to occur. Uncertanties arise in the SOA yield measurements due to particle and vapor wall losses and re-sult in a factor of 2–3 difference between upper and lower limits to SOA yield. Re-cently, Gentner et al. (2012) assessed SOA formation from diesel and gasoline vehicles and noted that SOA yields for cyclic alkanes with five- and six-membered rings, which 15
comprise 37 % of diesel and 11 % of gasoline, were not well-characterized. This study presents data for one such compound, hexylcyclohexane. Hexylcyclohexane SOA yield was similar to that of dodecane under high-NOxconditions and greater than dodecane
under low-NOx conditions. Lim and Ziemann (2009b) measured SOA yields for two other branched-cyclic compounds,n-butylcyclohexane andn-decylcyclohexane, under 20
high-NOx conditions but with initial alkane concentrations much higher than ambient
concentrations, approximately 1 ppmv. The authors found that the SOA yield for butyl-cyclohexane was higher than that for decane, but the yield for decylbutyl-cyclohexane was less than that for hexadecane. Further characterization of yields from branched-cyclic compounds is necessary to better identify trends and provide more data for models. 25
ACPD
13, 20677–20727, 2013Alkanes SOA yield
C. L. Loza et al.
Title Page
Abstract Introduction
Conclusions References
Tables Figures
◭ ◮
◭ ◮
Back Close
Full Screen / Esc
Printer-friendly Version Interactive Discussion
Discussion
P
a
per
|
D
iscussion
P
a
per
|
Discussion
P
a
per
|
Discuss
ion
P
a
per
|
lower NOx conditions. SOA yields measured in the present study are higher or the same under high-NOx conditions in comparison to those measured for low-NOx
con-ditions. Therefore, alkanes exhibit the largest SOA formation potential in urban areas close to their sources.
Appendix A
5
Particle wall loss calculations
Pierce et al. (2008) developed the Aerosol Parameter Estimation model to determine the time variance of particle wall loss rates during an environmental chamber exper-iment. We have adapted this model to calculate the mass growth rate of suspended particles throughout an experiment. These mass growth rates are then applied to de-10
posited particles to calculate lower and upper limit wall-loss corrections.
The model utilized in the current work is based on the aerosol General Dynamic Equation (Seinfeld and Pandis, 2006):
∂ns Dp,t
∂t =
∂ns Dp,t
∂t !
coag
+ ∂ns Dp,t
∂t !
cond
+ ∂ns Dp,t
∂t !
wl
(A1)
where ns Dp,t
(cm−3cm−1) is the suspended particle number-size distribution, Dp 15
ACPD
13, 20677–20727, 2013Alkanes SOA yield
C. L. Loza et al.
Title Page Abstract Introduction Conclusions References Tables Figures ◭ ◮ ◭ ◮ Back Close
Full Screen / Esc
Printer-friendly Version Interactive Discussion Discussion P a per | D iscussion P a per | Discussion P a per | Discuss ion P a per |
The change in the suspended particle number-size distribution due to coagulation is described by
∂ns Dp,t
∂t ! coag =1 2 Dp Z 0 K
Dp3−q3 13 ,q ns
Dp3−q3 13
,t
ns(q,t) dq
−ns Dp,t
∞
Z
0
K q,Dp
ns(q,t) dq (A2)
5
where K Dp1,Dp2
(cm3s−1) is the coagulation coefficient for collisions of particles with diametersDp1 andDp2 (Seinfeld and Pandis, 2006). The DMA measures particle
number-size distributions using discrete size bins, and the coagulation coefficient must also be discretized to be applied to these data. The change in suspended particle number-size distribution due to coagulation becomes
10
∂ns Dp,t
∂t ! coag =1 2 X i X j
fc Dpi,Dpj
K Dpi,Dpj
N Dpi,t
N Dpj,t
−X
i
K Dpi,Dpk
N Dpi,t
N Dpk,t
(A3)
wherefc Dpi,Dpj
expresses whether the collision of a particle in size bini with a par-ticle in size bin j produces a particle in size bin k, bounded by diameters Dpk− and 15
Dpk+:
fc Dpi,Dpj
=1 if Dpk−≤2
Dpi
2 !3
+ Dpj 2
!3
1 3
<Dpk+ (A4)
fc Dpi,Dpj
ACPD
13, 20677–20727, 2013Alkanes SOA yield
C. L. Loza et al.
Title Page
Abstract Introduction
Conclusions References
Tables Figures
◭ ◮
◭ ◮
Back Close
Full Screen / Esc
Printer-friendly Version Interactive Discussion
Discussion
P
a
per
|
D
iscussion
P
a
per
|
Discussion
P
a
per
|
Discuss
ion
P
a
per
|
Particles are not allowed to form outside of the measured size range (Verheggen and Mozurkewich, 2006).
The change in suspended particle number-size distribution due to condensation is described by
∂ns Dp,t
∂t !
cond
=− ∂ ∂Dp
I Dp,t
n Dp,t
(A6) 5
whereI Dp,t
(cm s−1) is the rate of change of particle diameter as a result of con-densation. Assuming spherical particles with a densityρp(g cm
−3
) that is not a strong function of time,
I Dp,t
=dDp
dt = 2P
Ji
πDp2ρp (A7)
whereJi (g s−1) is the mass flux of speciesito the particle.Ji is defined as 10
Ji=
2πDpDiMi
RT f(Kn,αi) p∞,i−ps,i
(A8)
whereDi (cm 2
s−1) is the diffusion coefficient for species i in air, Mi (g mol −1
) is the molecular weight of species i, R (g cm2s−2mol−1K−1) is the gas constant, T (K) is temperature,f(Kn,αi) is a correction factor for non-continuum effects and surface
ac-commodation effects,p∞,i (g cm −1
s−2) is the vapor pressure of speciesiin far from the 15
particle, andps, i (g cm−1s−2) is the partial pressure of speciesi at the surface of the particle. Substituting Eqs. (A7) and (A8) into Eq. (A6) yields
∂ns Dp,t
∂t !
cond
= −4 RTρp
" X
i
DiMif(Kn,αi) p∞,i−ps,i
#
∂ ∂Dp
" 1 Dp
ns Dp,t
#