ACPD
14, 17161–17196, 2014Long term characterization of
organic and elemental carbon in
the PM2.5
D. Paraskevopoulou et al.
Title Page
Abstract Introduction
Conclusions References
Tables Figures
◭ ◮
◭ ◮
Back Close
Full Screen / Esc
Printer-friendly Version
Interactive Discussion
Discussion
P
a
per
|
Discus
sion
P
a
per
|
Discussion
P
a
per
|
Discussion
P
a
per
|
Atmos. Chem. Phys. Discuss., 14, 17161–17196, 2014 www.atmos-chem-phys-discuss.net/14/17161/2014/ doi:10.5194/acpd-14-17161-2014
© Author(s) 2014. CC Attribution 3.0 License.
This discussion paper is/has been under review for the journal Atmospheric Chemistry and Physics (ACP). Please refer to the corresponding final paper in ACP if available.
Long term characterization of organic and
elemental carbon in the PM
2.5
fraction: the
case of Athens, Greece
D. Paraskevopoulou1,2, E. Liakakou1, E. Gerasopoulos1, C. Theodosi2, and N. Mihalopoulos1,2
1
Institute for Environmental Research and Sustainable Development, National Observatory of Athens, I. Metaxa and Vas. Pavlou, 15236, P. Penteli, Athens, Greece
2
Environmental and Analytical Chemical Division, Department of Chemistry, University of Crete, P.O. Box 2208, 71003 Heraklion, Greece
Received: 3 April 2014 – Accepted: 27 May 2014 – Published: 27 June 2014 Correspondence to: N. Mihalopoulos ([email protected])
ACPD
14, 17161–17196, 2014Long term characterization of
organic and elemental carbon in
the PM2.5
D. Paraskevopoulou et al.
Title Page
Abstract Introduction
Conclusions References
Tables Figures
◭ ◮
◭ ◮
Back Close
Full Screen / Esc
Printer-friendly Version
Interactive Discussion
Discussion
P
a
per
|
Discus
sion
P
a
per
|
Discussion
P
a
per
|
Discussion
P
a
per
|
Abstract
Organic carbon (OC), elemental carbon (EC), water soluble organic carbon (WSOC) and main ions were measured in a total of 1510 PM2.5 daily aerosol samples
col-lected from May 2008 to April 2013, in Athens, Greece. OC and EC concentrations were 2.1±1.3 µg m−3 and 0.54±0.39 µg m−3, accounting for 11±3 % and 3±1 % of
5
PM2.5mass respectively, with an average OC/EC ratio of 4.7±3.1. Significant
correla-tion was found between OC and EC during the whole period, indicating emissions by common primary sources at a regional scale. WSOC concentration ranged from 0.03 to 10.6 µg m−3, with an average of 1.5±0.9 µg m−3. By considering Finokalia (Crete)
station as a reference, it was estimated that during the warm season in Athens 67±7 %
10
of emitted OC and 53±12 % of emitted EC is regional, while during cold months, the
regional contribution for OC is only 33±7 % and for EC 29±8 %. Furthermore,
sec-ondary organic carbon (SOC) was calculated for the warm period of the year (April to October). The estimated SOC constituted about 75±6 % of PM2.5 organic carbon
in Athens, highlighting significant aging processes, at a regional scale. In the period 15
2011–2013 and during wintertime, an increase in OC and EC levels was observed, attributed to increase of wood burning for domestic heating due to the economic crisis.
1 Introduction
Atmospheric aerosol constitutes a crucial factor of air pollution since it presents ad-verse effects on health, environment and Earth radiative balance (EPA, 1996; WHO, 20
2003). Carbonaceous aerosol contributes to global warming, and black carbon is con-sidered as the second most important agent of global warming after CO2(Probert and Tarrant, 1989; Robock and Graf, 1994; Galdos et al., 2013). Recent epidemiologic stud-ies, have displayed the risks of exposure to increased levels of carbonaceous aerosols, revealing notable associations with cardiovascular mortality and morbidity (Ostro et al., 25
ACPD
14, 17161–17196, 2014Long term characterization of
organic and elemental carbon in
the PM2.5
D. Paraskevopoulou et al.
Title Page
Abstract Introduction
Conclusions References
Tables Figures
◭ ◮
◭ ◮
Back Close
Full Screen / Esc
Printer-friendly Version
Interactive Discussion
Discussion
P
a
per
|
Discus
sion
P
a
per
|
Discussion
P
a
per
|
Discussion
P
a
per
|
The carbonaceous content of atmospheric particles has been the objective of sev-eral studies as it represents an essential fraction of particulate matter (Alastuey et al., 2004; Na et al., 2004; Putaud et al., 2004; Querol et al., 2004; Yu et al., 2004; Yttri et al., 2007; Pey et al., 2010; Pio et al., 2011). These studies provide evidence for the relative importance of wintertime high energy consumption, combined with unfavorable mete-5
orological conditions, and summertime secondary organic aerosol as major sources of carbonaceous aerosol in Europe. The formation mechanisms of organic carbon (OC) and elemental carbon (EC) have been under scrutiny during the last decade (Saylor et al., 2006; Pio et al., 2007, 2011; Schwarz et al., 2008; Grivas et al., 2012; Bougia-tioti et al., 2013), placing emphasis on their biogenic and/or anthropogenic origin and 10
subsequent effects.
Athens is located in Eastern Mediterranean, a well-known crossroads of long range aerosols transported from discrete neighboring sources in excess of other significant local/regional sources of aerosols (Lelieveld et al., 2002; Vrekoussis et al., 2005). A de-scription of the Athens basin and prevailing meteorological conditions has been pro-15
vided in the literature (Chaloulakou et al., 2005; Grivas et al., 2008, 2012; Kanakidou et al., 2011; Theodosi et al., 2011). Studies performed in Athens basin demonstrated the prevailing emissions of carbonaceous aerosol all year long (Chaloulakou et al., 2005; Sillanpää et al., 2006; Grivas et al., 2012; Pateraki et al., 2012; Remoundaki et al., 2013). Nevertheless, it is essential to mark that there are limited studies con-20
cerning PM2.5fraction of aerosol in Athens and the works performed so far have been
conducted for short time periods (4–11 months), mainly at urban locations.
This is the first to our knowledge, long-term (2008–2013) uninterrupted data record of carbonaceous aerosol in an extended area already burdened by long range transport (Eastern Mediterranean) and, in particular, an urban agglomeration with degraded Air 25
ACPD
14, 17161–17196, 2014Long term characterization of
organic and elemental carbon in
the PM2.5
D. Paraskevopoulou et al.
Title Page
Abstract Introduction
Conclusions References
Tables Figures
◭ ◮
◭ ◮
Back Close
Full Screen / Esc
Printer-friendly Version
Interactive Discussion
Discussion
P
a
per
|
Discus
sion
P
a
per
|
Discussion
P
a
per
|
Discussion
P
a
per
|
burning replaced conventional fuels for domestic heating due to the high heating oil prices. The latter, in many cases is reported to have a significant contribution to air pollution levels (Molnar et al., 2005; Sandradewi et al., 2008; Schmidl et al., 2008; Grange et al., 2013). Finally, a direct comparison between the urban background site of this study and a remote background site considered as reference for the extended 5
Eastern Mediterranean area (Finokalia, ACTRIS supersite), helped us shed light on regional patterns and processes, discriminating between regional and local emission sources.
2 Experimental
2.1 Sampling site 10
The measurements were conducted at the National Observatory of Athens premises in Penteli (38◦2.94′N, 23◦51.78′E, 495 m a.s.l.). The site is located on top of a hill facing
the city of Athens to S–SW (17 km from the city center), while to the N-NE sector it is surrounded by the Penteli Mountain. The major sources of air pollution in the close vicinity are expected to be vehicular emissions and residential heating. More details 15
about the Greater Athens Area morphology and meteorological conditions are provided by Kanakidou et al. (2011; and references therein), while internal transport patterns in the urban complex are described by Melas et al. (1998). The station is considered as an urban background site, established and operated by the Institute of Environmental Research and Sustainable Development.
20
2.2 Samples collection
This study covers five years from May 2008 to April 2013, resulting in the collection of 1510 samples on a daily basis. PM2.5aerosol samples were collected using a
ACPD
14, 17161–17196, 2014Long term characterization of
organic and elemental carbon in
the PM2.5
D. Paraskevopoulou et al.
Title Page
Abstract Introduction
Conclusions References
Tables Figures
◭ ◮
◭ ◮
Back Close
Full Screen / Esc
Printer-friendly Version
Interactive Discussion
Discussion
P
a
per
|
Discus
sion
P
a
per
|
Discussion
P
a
per
|
Discussion
P
a
per
|
2000 air sampler (R&P Co), operating at 15.0 and 16.7 L min−1, respectively. Sampling duration was 24 h starting at 14:00 LT.
Samples were collected on quartz fiber filters (4.7 cm, Whatman QMA). Filters were prebaked at 550◦C for 4 h to remove any absorbed organic material and were stored and transported to and from the field into petrislides. After sampling they were stored 5
until analysis. Filter blanks and blank field samples were also prepared and analyzed. For the estimation and correction of the amount of adsorbed organic vapor on the sampling filter, a tandem filter collection method was applied (e.g. Turpin et al., 2000; Kirchstetter et al., 2001; Yttri et al., 2007). Two quartz fiber filters from the same lot were used in series, the front filter collects essentially 100 % of the particulate matter 10
(and some gas-phase material) and the backup filter is exposed only to gas-phase compounds. The measured carbon content of the backup filter can be subtracted from that of the front filter to give an estimate of the particulate phase OC (Turpin et al., 2000; Novakov et al., 2005; Sillanpää et al., 2005). Tandem filters were collected for a selected number of samples, using the aforementioned Partisol samplers. In our 15
analyses, the backup filters indicated a positive OC artifact which was always smaller than 5 %, thus no correction was applied.
2.3 Mass and chemical analyses
2.3.1 Aerosol mass
PM mass was determined by weighing the filters before and after sampling according 20
ACPD
14, 17161–17196, 2014Long term characterization of
organic and elemental carbon in
the PM2.5
D. Paraskevopoulou et al.
Title Page
Abstract Introduction
Conclusions References
Tables Figures
◭ ◮
◭ ◮
Back Close
Full Screen / Esc
Printer-friendly Version
Interactive Discussion
Discussion
P
a
per
|
Discus
sion
P
a
per
|
Discussion
P
a
per
|
Discussion
P
a
per
|
2.3.2 OC – EC analysis
All quartz filters (samples and blanks) were analyzed by a thermal optical transmission technique, using a Sunset Laboratory Inc. (Oregon) carbon analyzer. A punch of 1 cm2 was removed from the filter and loaded into the analyzer as described by Bougiati-oti et al. (2013) and Novakov et al. (2005). OC and EC were determined using the 5
EUSAAR-2 protocol (Cavalli et al., 2010). Briefly, the first phase subsumes 4 stages of heating at 200, 300, 450 and 650◦C at He atmosphere, while, during the second 4-step
temperature program, the sample is heated at 500, 550, 700 and 850◦C at He/O2
at-mosphere. The detection limit of the analysis was 0.26 and 0.05 µg C cm−2for OC and EC, respectively. The reported results were blank-corrected.
10
2.3.3 WSOC analysis
For the determination of the Water Soluble Organic Carbon (WSOC) concentrations, punches of 2 cm2 were removed from the filter and placed in an ultrasonic bath for 45 min using 15 mL of nanopure water. The sample extract was filtered using syringe filters (PALL IC Acrodisc (PES), 0.45 mm, 13 mm). The solutions obtained after the fil-15
tration were analyzed for total organic carbon (TOC) using a Shimadzu TOC-V CSH Total Organic Carbon Analyzer. Total water soluble organic carbon is calculated by ex-tracting inorganic water soluble carbon from total water soluble carbon (TOC=TC−IC)
and is labeled as WSOC. The analytical detection limit for WSOC was 80 ppb. All data were corrected for the obtained blank levels.
20
2.3.4 Ion chromatography
ACPD
14, 17161–17196, 2014Long term characterization of
organic and elemental carbon in
the PM2.5
D. Paraskevopoulou et al.
Title Page
Abstract Introduction
Conclusions References
Tables Figures
◭ ◮
◭ ◮
Back Close
Full Screen / Esc
Printer-friendly Version
Interactive Discussion
Discussion
P
a
per
|
Discus
sion
P
a
per
|
Discussion
P
a
per
|
Discussion
P
a
per
|
the main ionic species concentrations (anions: Cl−, Br−, NO3−, SO42−, PO34−, C2O 2−
4
and cations: NH+4, K+, Na+, Mg2+, Ca2+). Anions were determined using a Dionex-500 ion chromatograph equipped with an Ion Pac AS4A-SC column and an AG4A-SC pre-column, with an ASRS-300 suppressor. Anions’ separation was conducted with isocratic elution of NaHCO3 (3.4 mM)/Na2CO3 (3.6 mM) as an eluent and a flow of
5
1.5 mL min−1. For the determination of cations an Ion Pac CS12A column and a CG12A guard column was used, with a CSRS-300 suppressor, under isocratic elution of 20 mM MSA (Methanesulphonic acid) at a flow rate of 1.0 mL min−1. The detection limit of the analysis was 20, 12, 40, 12 and 40 ppb for NH+4, K+, Na+, Mg2+ and Ca2+, respec-tively, while the corresponding detection limit for all anions (Cl−, Br−, NO3−, SO2−
4 ,
10
PO3−
4 , C2O 2−
4 ) was 20 ppb. The reported concentrations were corrected for blanks.
3 Results and discussion
3.1 Mass concentrations of OC – EC and observed seasonal trends
The daily concentration levels of OC range from 0.1 to 8.5 µg m−3 (average: 2.1±1.3 µg m−3), contributing on average about 11±3 % to the total PM2.5mass.
Ac-15
cordingly, the mass concentration of EC ranges from 0.01 to 3.33 µg m−3 (average: 0.54±0.39 µg m−3), contributing 3±1 % to the total PM2.5. OC and EC values from
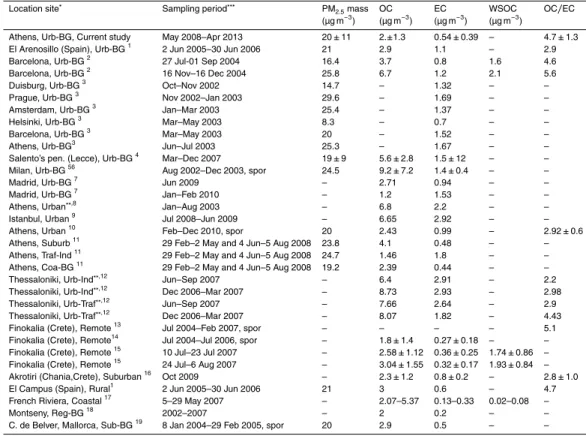
previous studies in Athens and other European sites are presented in Table 1. It should be noted that most of these studies refer to shorter time periods (4–11 months), and for different site types. Compared to OC and EC concentrations in Athens back in 20
ACPD
14, 17161–17196, 2014Long term characterization of
organic and elemental carbon in
the PM2.5
D. Paraskevopoulou et al.
Title Page
Abstract Introduction
Conclusions References
Tables Figures
◭ ◮
◭ ◮
Back Close
Full Screen / Esc
Printer-friendly Version
Interactive Discussion
Discussion
P
a
per
|
Discus
sion
P
a
per
|
Discussion
P
a
per
|
Discussion
P
a
per
|
site in Istanbul during the period 2008–2009 appear much higher compared to the val-ues of this study. Regional background concentration levels at the Finokalia site (Crete Island, 2004–2006) are on average 1.8 and 0.27 µg m−3, for OC and EC, respectively.
Total carbon is calculated as the sum of OC and EC (TC=OC+EC), with OC ac-counting for 79±4 % of the total carbon, constituting the predominant carbon
con-5
tributor, in accordance with findings in other European sites (e.g. Lonati et al., 2007; Sanchez de la Campa et al., 2009). However, the contribution of TC to PM in this study (14±3 %) is lower than what is reported in the literature for other urban/urban
back-ground locations (e.g. about 19 % in Sanchez de la Campa et al. (2009); 27–28 % in Lonati et al. (2007); 29 % in Perrone et al. (2011); 25–46 % in Viana et al. (2006)). 10
Conversion of OC to OM (Organic Matter) is recognized as one of the most critical factors of uncertainty in mass closure calculations (Yttri et al., 2007). Turpin and Lim (2001) suggest the use of different conversion factors per site type: 1.6±0.2 for urban
areas, 1.9–2.3 for aged aerosols, and 2.2–2.6 for biomass burning. Taking into account that our site is an urban background station also affected by long range transport (e.g. 15
Sciare et al., 2005; Kanakidou et al., 2011; Pateraki et al., 2012; Remoundaki et al., 2013), we used the value of 2.1 (OM=2.1·OC). On average, OM accounts for 24±6 %
of PM2.5which is consistent with the value (22 %) provided by Remoundaki et al. (2013) for Athens, while lower to those reported in other European sites (e.g. Sillanpää et al., 2005; Sanchez de la Campa et al., 2009).
20
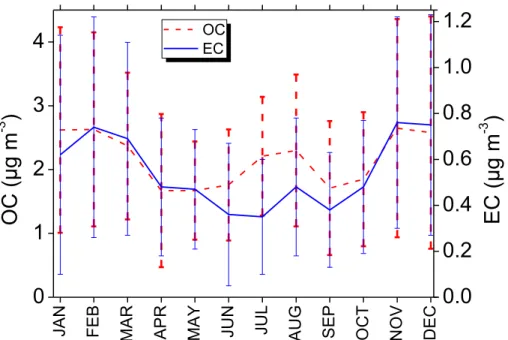
In Fig. 1 the daily concentrations of OC and EC are presented for the whole sam-pling period (May 2008–April 2013). It is observed that OC and EC present significant covariance for most of the period, with maxima mainly during the colder months. The seasonal variability in OC and EC is clearly demonstrated in Fig. 2, which reveals higher concentrations from November to March (the coldest period of the year), due 25
ACPD
14, 17161–17196, 2014Long term characterization of
organic and elemental carbon in
the PM2.5
D. Paraskevopoulou et al.
Title Page
Abstract Introduction
Conclusions References
Tables Figures
◭ ◮
◭ ◮
Back Close
Full Screen / Esc
Printer-friendly Version
Interactive Discussion
Discussion
P
a
per
|
Discus
sion
P
a
per
|
Discussion
P
a
per
|
Discussion
P
a
per
|
EC, minimum concentrations are found during the warmest months of the year, when there is less fuel combustion in Athens (period of summer vacations) and thus lower production of primary EC.
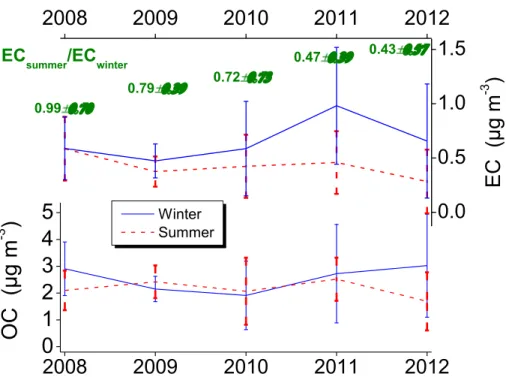
The summer vs. winter contrast is further shown in Fig. 3, on an annual basis. Winter refers to December–February period of the December year, while summer to June– 5
August. The EC summer levels after 2008 appear slightly reduced compared to 2008, coinciding the economic recession period in Greece, which led to reduction of traffic emissions (Vrekoussis et al., 2013). In winter, there is an obvious increase in the last two years (2011–2012), attributed to the massive turn of Athens residents in wood burning for main domestic heating. The same behavior in winter is reproduced also 10
by OC. The summer to winter ratio of EC mass concentration presents a significant declining trend from 1.21 in 2008 to 0.59 in 2012, illustrating the combined effect of summer and winter changes in EC emissions, as related to the economic crisis (see below).
3.2 OC/EC concentration ratios 15
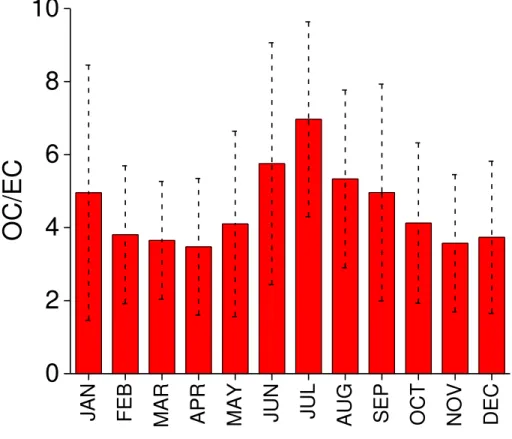
The daily OC/EC ratios range from 0.5 to 29.3, with an average of 4.7±1.3
for the 5 year period. These ratios are generally comparable with results from other Mediterranean sites (see Table 1), however, on a seasonal basis the OC/EC ratios ([OC/EC]winter=4.6, [OC/EC]summer=6.3) are higher than those
re-ported for other urban background sites around the world ([OC/EC]winter=2.4–3.5,
20
[OC/EC]summer=1.3–3.9) as reviewed by Lonati et al. (2008). Higher ratios are ex-pected as a result of secondary production from gas to particle conversion of VOCs during long-range transport of polluted air masses (Pio et al., 2007).
In more detail, the seasonal cycle of OC/EC ratio (Fig. 4) presents maximum values during summer (6.3), when photo oxidation reactions lead to the production of sec-25
ACPD
14, 17161–17196, 2014Long term characterization of
organic and elemental carbon in
the PM2.5
D. Paraskevopoulou et al.
Title Page
Abstract Introduction
Conclusions References
Tables Figures
◭ ◮
◭ ◮
Back Close
Full Screen / Esc
Printer-friendly Version
Interactive Discussion
Discussion
P
a
per
|
Discus
sion
P
a
per
|
Discussion
P
a
per
|
Discussion
P
a
per
|
due to fuel combustion for heating, that coincide with a comparatively smaller increase in the production of EC.
Overall, the high values of OC/EC ratio (>2) year round, indicate the clear impact of additional processes like the production of secondary organic carbon. To estimate the primary and secondary origins of carbonaceous aerosol, the correlation between the 5
OC and EC mass concentrations is investigated (e.g. Turpin and Huntzicker, 1995). In the present study a statistically significant correlation is found between OC and EC for the whole period (not shown,R2=0.49, slope=2.33, n=1365, p <0.001), revealing that OC and EC emission rates are proportional to each other (e.g. Na et al., 2004). A comparable correlation coefficient was reported by Koulouri et al. (2008) for another 10
Eastern Mediterranean, though remote coastal, location (Finokalia, Crete). The above suggest that OC and EC fractions are emitted by common primary sources at a regional scale.
3.3 Water soluble organic carbon
Water soluble organic carbon (WSOC) is considered a major component of carbona-15
ceous aerosol as it serves as a proxy for secondary organic aerosols due to its highly oxidized and soluble nature (Park et al., 2013).
The WSOC concentration in PM2.5ranged from 0.03 to 10.6 µg m− 3
, with an average of 1.5±0.9 µg m−3, and no significant differences between summer (1.7±0.8 µg m−3)
and winter (1.6±1.2 µg m−3). These levels are similar to those reported for the
remote-20
coastal site of Finokalia, Crete, by Bougiatioti et al. (2011), but lower than those re-ported for Istanbul by Theodosi et al. (2010) (PM10 in urban site, see Table 1). The
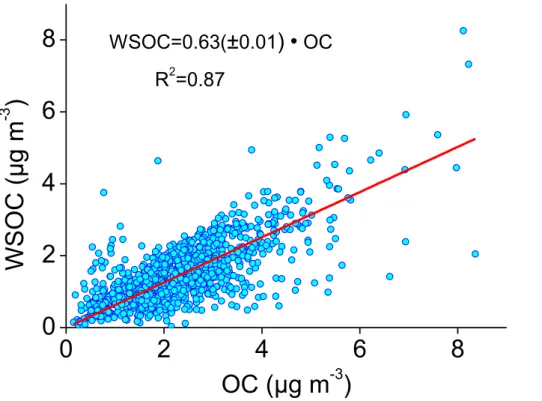
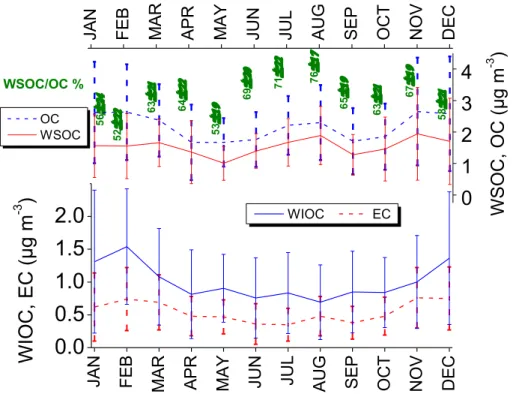
concentration of WSOC presents a statistically significant correlation with OC (Fig. 6) (R2=0.87,n=1000,p <0.001), indicative of their common sources. Moreover, WSOC follows the seasonal trend of OC (Fig. 7) throughout the year, showing maximum values 25
ACPD
14, 17161–17196, 2014Long term characterization of
organic and elemental carbon in
the PM2.5
D. Paraskevopoulou et al.
Title Page
Abstract Introduction
Conclusions References
Tables Figures
◭ ◮
◭ ◮
Back Close
Full Screen / Esc
Printer-friendly Version
Interactive Discussion
Discussion
P
a
per
|
Discus
sion
P
a
per
|
Discussion
P
a
per
|
Discussion
P
a
per
|
WSOC usually consists of organic compounds that derive from the atmospheric ox-idation of VOCs and gas particle conversion (secondary OC), while the oxygenation of particulate OC may also occur in the particulate phase or via multiphase chem-istry by reaction of strong oxidants such as ozone or hydroxy radicals. As a result, the WSOC/OC ratio decreases in urban locations and near fossil fuel sources (∼20 %)
5
and increases at more remote sites due to aerosol aging (Pio et al., 2007).
In this study, the WSOC accounts, on average, for about 63±7 % of the OC, which
is in agreement with the value (67 %) reported by Bougiatioti et al. (2011) for Finokalia, Crete, but higher than the value (42 %) reported by Lonati et al. (2007) for Milan. The above indicate the dominant role of aerosol aging processes at the regional scale. Fi-10
nally, the WSOC/OC ratio shows maximum values during summer (Fig. 7), when there is intense photo oxidation that leads to the production of secondary organic species.
The water insoluble organic carbon (WIOC) has been calculated through subtraction of WSOC from the total OC concentration. On an annual basis WIOC contributes about 39±7 % to OC. Although WIOC shows no significant correlation with EC on a daily
ba-15
sis, their seasonal cycles show covariance (Fig. 7), indicating that part of the production of WIOC can be attributed to primary sources such as fossil fuel combustion.
The concentration of non-sea salt sulfate (nss-SO24−) has been also estimated fol-lowing the procedure described in Sciare et al. (2005) and Pio et al. (2007). The av-erage value for the whole period is 3.0±2.0 µg m−3, which is in agreement with the
20
findings from other studies in Athens (Theodosi et al., 2011; Remoundaki et al., 2013). WSOC is weakly correlated to nss-SO24− (R2=0.15, n=1017, p <0.001), suggesting that secondary organic products, formed through formation pathways similar to those of sulfate, are not the dominant constituents of WSOC. Additionally, the low correlation coefficient of WSOC with nss-K+ (R2=0.05, n=1023, p <0.001) propounds limited 25
production of WSOC from biomass burning. Finally, the higher correlation coefficient of WSOC with EC (R2=0.35,n=993,p <0.001) indicates that there is some contribution to WSOC from primary anthropogenic sources rather than biogenic. The correlation between WSOC and nss-SO2−
4 slightly improves during summer (summer:R 2
ACPD
14, 17161–17196, 2014Long term characterization of
organic and elemental carbon in
the PM2.5
D. Paraskevopoulou et al.
Title Page
Abstract Introduction
Conclusions References
Tables Figures
◭ ◮
◭ ◮
Back Close
Full Screen / Esc
Printer-friendly Version
Interactive Discussion
Discussion
P
a
per
|
Discus
sion
P
a
per
|
Discussion
P
a
per
|
Discussion
P
a
per
|
winter:R2=0.03); while, on the contrary, the dependence of WSOC to EC is improving in winter (summer:R2=0.29; winter:R2=0.44).
Based on the above, the primary fossil fuel and wood combustion sources appear to contribute more to the winter WSOC concentrations, whereas during summer, sources like oxidation processes of secondary products are more efficient in generating WSOC. 5
3.4 Sources of carbonaceous aerosol
The independent contribution of biomass burning and fossil fuel combustion emis-sions to organic matter concentrations could be quantitatively estimated through the potassium–OC and potassium–EC correlations (e.g. Satsangi et al., 2012). In general, biomass burning contributes significantly to the atmospheric concentrations of potas-10
sium (K+) and the latter is applied as an inorganic tracer for aerosol derived from this source (e.g. Currie et al., 1994; Pio et al., 2008; Schmidl et al., 2008), while fossil fuel combustion leads to minor production of potassium (e.g. Yang et al., 2005a, b).
To utilize K+as a representative tracer of pure biomass burning emissions, we have applied a correction for the contribution from sea salt. Sea salt potassium (ss-K+) was 15
calculated in accordance with the composition of sea water (Sciare et al., 2005; Pio et al., 2007; Bougiatioti et al., 2013) and was then subtracted from the total K+ concen-tration, to calculate the remaining non-sea salt potassium (nss-K+). The nss-K+ con-centrations were ranged up to 1.8 µg m−3, with a 5 year average of 0.17
±0.19 µg m−3,
comparable to the values reported by Koulouri et al. (2008). 20
In this study, no significant correlations are calculated between nss-K+ with OC and EC (neither do they improve on a seasonal basis), indicating that during the whole period, biomass burning does not consist the main source of organic carbon and that the dominant primary source of EC is mainly fossil fuel combustion (such as traffic). The nss-K+/OC ratio ranges between 0.03 and 2.4, with an average of 0.11±0.04, while
25
nss-K+/EC ratios vary from 0.01 to as high as 7.4, with an average of 0.45±0.14.
ACPD
14, 17161–17196, 2014Long term characterization of
organic and elemental carbon in
the PM2.5
D. Paraskevopoulou et al.
Title Page
Abstract Introduction
Conclusions References
Tables Figures
◭ ◮
◭ ◮
Back Close
Full Screen / Esc
Printer-friendly Version
Interactive Discussion
Discussion
P
a
per
|
Discus
sion
P
a
per
|
Discussion
P
a
per
|
Discussion
P
a
per
|
fossil-fuel emissions (range: 0.025–0.09) have been reported by Andreae (1983) along a path from Europe to South America, while Satsangi et al. (2012) reported K+/EC and K+/OC ratios of 0.39±0.25 and 0.08±0.02, respectively, for India. However, these
ratios are not corrected for other sources of K+, which according to Reche et al. (2012) is a crucial factor, thus direct comparison with this study is not valid. To our knowledge, 5
such reported ratios of chemical species from biomass burning, do not exist in the Eastern Mediterranean.
The annual means of nss-K+/OC and nss-K+/EC ratios (not shown) exhibit an in-creasing trend through the studied period which, in the case of nss-K+/EC, can be mostly attributed to the notable increase of nss-K+ concentration compared to that of 10
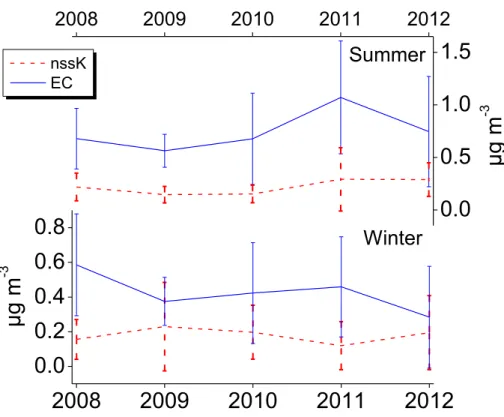
EC, supporting the influence of wood burning during the last years. In Fig. 5, EC and nss-K+ concentrations are presented on a seasonal basis from 2008 to 2013, showing an anti-correlation in summers indicating limited role of biomass burning during that season. This behavior of EC during summers is indicative of accumulative EC from regional sources (such as fossil fuel combustion from traffic), combined with limited 15
atmospheric washout due to precipitation. During winter, frequent rainfalls remove the regional EC, and thus, the covariance between EC and nss-K+ reflects mainly local sources like domestic heating.
3.5 Estimation of secondary organic carbon
Greece is significantly affected by long-range transport of African dust and other 20
aerosol types from distant anthropogenic pollution sources (e.g. Gerasopoulos et al., 2011; Kanakidou et al., 2011). Thus, the comparison between an urban background site and a remote site within the same geographical region would be a useful tool for exploring long range transport vs. local sources in conjunction with aerosol age-ing processes. In this line, OC and EC data from Finokalia (35◦32′N, 25◦67′N; 25
ACPD
14, 17161–17196, 2014Long term characterization of
organic and elemental carbon in
the PM2.5
D. Paraskevopoulou et al.
Title Page
Abstract Introduction
Conclusions References
Tables Figures
◭ ◮
◭ ◮
Back Close
Full Screen / Esc
Printer-friendly Version
Interactive Discussion
Discussion
P
a
per
|
Discus
sion
P
a
per
|
Discussion
P
a
per
|
Discussion
P
a
per
|
for the period from May 2008 to March 2013, and the comparison of the measured levels and their covariance over the different seasons was used to infer the origins and processes responsible for the carbonaceous aerosol loading.
In order to estimate the secondary organic carbon (SOC), we applied the EC tracer method (Turpin and Huntzicker, 1995; Cabada et al., 2002), using the equations: 5
(OC)tot=(OC)pri+(OC)sec (1)
or
(OC)tot=
OC EC
pri
·(EC)pri+(OC)sec (2)
where (OC/EC)pri is the ratio for the local primary sources affecting the measured
10
concentrations. A qualitative estimation of SOC using OC/EC ratios is valid only after careful inspection of local sources of OC and EC on a seasonal basis (e.g. Na et al., 2004). Taking into account the seasonal variation in the primary emissions and also the effect of meteorology on the primary emissions ratio, different primary OC/EC ratios for the cold and the warm period were applied for this study (Gelencsér et al., 2007; 15
Grivas et al., 2012).
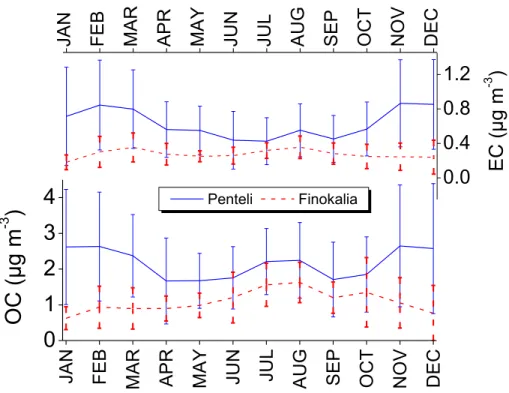
In Fig. 8 the seasonal cycles of OC and EC at Penteli-Athens and Finokalia-Crete are shown. The levels of OC and EC in Athens are constantly higher than those at Finokalia, by 55 % in the warm season up to 200 % in the cold season. By considering Finokalia station as a reference, it is estimated that in Athens during the warm sea-20
son 67±7 % of emitted OC and 53±12 % of emitted EC is regional, while during cold
months, the regional contribution for OC is only 33±7 % and for EC 29±8 %. It is
ob-served that from April to October there is an almost a constant difference between the two sites that increases notably during the coldest period of the year, from November to March.
25
ACPD
14, 17161–17196, 2014Long term characterization of
organic and elemental carbon in
the PM2.5
D. Paraskevopoulou et al.
Title Page
Abstract Introduction
Conclusions References
Tables Figures
◭ ◮
◭ ◮
Back Close
Full Screen / Esc
Printer-friendly Version
Interactive Discussion
Discussion
P
a
per
|
Discus
sion
P
a
per
|
Discussion
P
a
per
|
Discussion
P
a
per
|
the regional context. The increased values in Athens compared to Finokalia, can be attributed to an additional EC fraction due to traffic and a constant fractional input of OC added to the fossil fuel road transport emitted aerosol, in agreement with Theodosi et al. (2011). According to Pio et al. (2007) and Theodosi et al. (2011) the simple use of the same primary OC/EC factor to estimate secondary carbon aerosol in rural and 5
remote European areas in the warm season, is adequate. Thus, from April to October in Athens, we estimated the contribution of primary and secondary organic aerosols in the organic carbon concentrations using Eq. (2) and applying an OC/ECpri ratio equal
to 1, since traffic is the main active source during this time period (e.g. Lonati et al., 2008).
10
During this period, SOC ranges from 0.06 to 5.2 µg m−3, with an average of 1.5±0.9 µg m−3, constituting about 75±6 % of organic carbon in Athens. It is shown
that SOC is a major contributor to OC during the warm season in the area, as also indicated by Bougiatioti et al. (2013) and Lonati et al. (2007), underlying the secondary nature of fine particles (Pateraki et al., 2012). In absolute values, the average in Athens 15
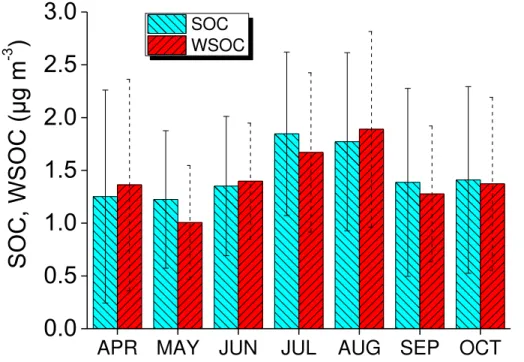
is lower than the one (2.7 µg m−3) reported by Sanchez de la Campa et al. (2009) in an urban background station in Spain. The monthly means of SOC (Fig. 9) in the warm period presents a maximum in summer (July/August), when there is intense photo-chemical activity that leads to the production of secondary organic carbon. WSOC, which is considered to be predominantly a secondary atmospheric product, also follows 20
the seasonal variability of SOC (Fig. 9), a conclusion strengthened by the significant correlation between daily SOC and WSOC values (R2=0.53, slope=0.69, n=591, p <0.001). Contrary, the correlation between SOC and nss-SO24− was much weaker (R2=0.22, slope=1.00,n=785,p <0.001), indicating less common sources between SOC and nss-SO2−
4 . Finally, it is worth noting the decreasing trend of SOC during the
25
five year period of this study, accompanied by a decrease in WSOC and nss-SO2−
4 .
ACPD
14, 17161–17196, 2014Long term characterization of
organic and elemental carbon in
the PM2.5
D. Paraskevopoulou et al.
Title Page
Abstract Introduction
Conclusions References
Tables Figures
◭ ◮
◭ ◮
Back Close
Full Screen / Esc
Printer-friendly Version
Interactive Discussion
Discussion
P
a
per
|
Discus
sion
P
a
per
|
Discussion
P
a
per
|
Discussion
P
a
per
|
In the cold season, for the estimation of SOC and the relevant primary OC/EC ratio, fossil fuel and wood burning combustion from domestic heating should be also taken into account (Gelencsér et al., 2007; Lonati et al., 2007, 2008). Since this ratio can vary largely depending on the site and the different sources, it was not feasible to estimate SOC during the cold period. In Fig. 8, the difference between OC and EC levels at 5
Finokalia (Crete) and Penteli (Athens), increases during the cold season compared to warm, reflecting the contribution of additional local sources in Athens. Assuming that the vehicular traffic is stable throughout the year (Grivas et al., 2012) and long range transport is similar over both sites, the increase in OC and EC during the cold season, can be attributed to an additional primary source, most probably heating. In addition 10
by examining the difference between OC and EC levels during the winter months for the whole studied period a notable increase during the 2011–2013 period compared to 2008–2010 is also observed mainly driven by wood burning activities maximized during the last two winters (2011–2013).
4 Conclusions 15
Continuous sampling of the PM2.5 aerosol fraction on a daily basis was conducted in Athens (Penteli station, urban background) during a five year period (2008–2013). Sub-sequent chemical analyses allowed the determination of organic carbon (OC), elemen-tal carbon (EC) and water soluble organic carbon (WSOC) concentrations and the esti-mation of secondary organic carbon (SOC). A comparison with parallel measurements 20
from a remote site on Crete Island (reference ACTRIS site for Eastern Mediterranean) enabled the identification and quantification of urban sources contribution on regional background. The results of this study, coinciding with the beginning of the economic crisis in Greece, reflect the combinational effect of limited vehicular circulation and in-creased wood combustion for domestic heating. This first long term measurement of 25
ACPD
14, 17161–17196, 2014Long term characterization of
organic and elemental carbon in
the PM2.5
D. Paraskevopoulou et al.
Title Page
Abstract Introduction
Conclusions References
Tables Figures
◭ ◮
◭ ◮
Back Close
Full Screen / Esc
Printer-friendly Version
Interactive Discussion
Discussion
P
a
per
|
Discus
sion
P
a
per
|
Discussion
P
a
per
|
Discussion
P
a
per
|
quantify the rapidly changing air pollution characteristics in the studied area, which is a mandate for future air quality policies.
The main conclusions arising from this study are summarized below:
– OC and EC concentrations in Athens back in 2003, were 3–4 times higher com-pared to this study, while later studies revealed similar (or slightly higher values 5
depending on the site type). Average OC and EC concentration is 2.1±1.3 µg m−3
and 0.54±0.39 µg m−3, respectively. OC and EC present covariance for most
of the sampling period while maximum values are observed during the coldest months of the year, when there is increased fuel combustion. The aforementioned outputs reveal that OC and EC emission rates are proportional to each other, sug-10
gesting hence that OC and EC fractions are emitted by common primary sources at a regional scale.
– On a seasonal basis, summer EC is formed by predominant regional sources (53±12 % of EC), such as fossil fuel combustion (traffic), whereas during win-ter, the prevailing result of local sources such as fuel combustion is highlighted 15
(71±8 % of EC). EC during summertime is decreasing through the years, since
there is a simultaneous reduction in traffic due to the economic crisis in Greece. On the contrary, EC concentration during winter presents a significant increase since 2011, which can be attributed to the selection of wood as the major fuel source for domestic heating. OC concentration does not present a clear seasonal 20
pattern.
– Total carbon for the whole sampling period (sum of OC and EC) constitutes a sig-nificant part of PM2.5 aerosol fraction (TC/PM=∼14 %), while OC accounts for
79±4 % of total carbon, constituting the predominant carbon contributor.
Addi-tionally, the estimated POM accounts for 24±6 % of the collected fine aerosol.
25
– The total of five-year samples provides an average OC/EC ratio of 4.7±1.3, while
ACPD
14, 17161–17196, 2014Long term characterization of
organic and elemental carbon in
the PM2.5
D. Paraskevopoulou et al.
Title Page
Abstract Introduction
Conclusions References
Tables Figures
◭ ◮
◭ ◮
Back Close
Full Screen / Esc
Printer-friendly Version
Interactive Discussion
Discussion
P
a
per
|
Discus
sion
P
a
per
|
Discussion
P
a
per
|
Discussion
P
a
per
|
urban background sites around the world, which is expected for long-range trans-port polluted sites. The elevated measured values of OC/EC ratio highlight the secondary nature of secondary organic carbon in the area. Additionally, the cal-culated correlation between OC and EC suggests that OC and EC fractions are emitted by common primary sources while, simultaneously there is impact of ad-5
ditional sources like production of secondary organic carbon. More specifically, in regards to primary emissions, it appears that the dominant primary source of EC is mainly fossil fuel combustion (such as traffic) while, biomass emission sources contributes mainly during the cold period.
– The calculated WSOC average concentration is 1.5±0.9 µg m−3, and it presents
10
significant dependence on OC concentration, revealing their common sources and subsequently the predominant secondary nature of OC in the studied area. Furthermore, the estimated WSOC/OC ratio is 63±7 %, illustrating the presence
of aged aerosol in the site. In addition, this work indicates that emissions, from primary non-biomass burning sources of water-soluble organic carbon and from 15
secondary organic products, can contribute to some extent to the variability of organic carbon observed in the studied location.
– SOC presents maximum values during summer, when there is intense photo-chemical activity, while the intra-annual variability of SOC is similar to that of WSOC, highlighting significant aging processes as characteristic at the regional 20
scale. SOC estimation was not feasible in the cold period (November to March).
– The comparison of OC and EC levels between the urban background and the remote-coastal site indicated the increasing contribution of local sources in Athens during the cold season of the last two years (wintertime 2011–2012 and 2012–2013), when economic hardship massively led residents to wood burning 25
for heating purposes.
ACPD
14, 17161–17196, 2014Long term characterization of
organic and elemental carbon in
the PM2.5
D. Paraskevopoulou et al.
Title Page
Abstract Introduction
Conclusions References
Tables Figures
◭ ◮
◭ ◮
Back Close
Full Screen / Esc
Printer-friendly Version
Interactive Discussion
Discussion
P
a
per
|
Discus
sion
P
a
per
|
Discussion
P
a
per
|
Discussion
P
a
per
|
Lifelong Learning” of the National Strategic Reference Framework (NSRF) - Research Funding Program: Heracleitus II. Investing in knowledge society through the European Social Fund.
References
Alastuey, A., Querol, X., Rodriguez, S., Plana, F., Lopez-Soler, A., Ruiz, C., and Mantilla, E.: Monitoring of atmospheric particulate matter around sources of secondary inorganic aerosol, 5
Atmos. Environ., 38, 4979–4992, 2004.
Andreae, M. O.: Soot carbon and excess fine potassium: long-range transport of combustion-derived aerosols, Science, 220, 1148–1151, 1983.
Bougiatioti, A., Fountoukis, C., Kalivitis, N., Pandis, S. N., Nenes, A., and Mihalopoulos, N.: Cloud condensation nuclei measurements in the marine boundary layer of the Eastern 10
Mediterranean: CCN closure and droplet growth kinetics, Atmos. Chem. Phys., 9, 7053– 7066, doi:10.5194/acp-9-7053-2009, 2009.
Bougiatioti, A., Nenes, A., Fountoukis, C., Kalivitis, N., Pandis, S. N., and Mihalopoulos, N.: Size-resolved CCN distributions and activation kinetics of aged continental and marine aerosol, Atmos. Chem. Phys., 11, 8791–8808, doi:10.5194/acp-11-8791-2011, 2011. 15
Bougiatioti, A., Zarmpas, P., Koulouri, E., Antoniou, M., Theodosi, C., Kouvarakis, G., Saarikoski, S., Makela, T., Hillamo, R., and Mihalopoulos, N.: Organic, elemental and water-soluble organic carbon in size segregated aerosols, in the marine boundary layer of the Eastern Mediterranean, Atmos. Environ., 64, 251–262, 2013.
Cabada, J. C., Pandis, S. N., and Robinson, A. L.: Sources of atmospheric carbonaceous par-20
ticulate matter in Pittsburgh, Pennsylvania, J. Air Waste Ma., 52, 732–741,2002.
Cavalli, F., Viana, M., Yttri, K. E., Genberg, J., and Putaud, J.-P.: Toward a standardised thermal-optical protocol for measuring atmospheric organic and elemental carbon: the EUSAAR pro-tocol, Atmos. Meas. Tech., 3, 79–89, doi:10.5194/amt-3-79-2010, 2010.
Chaloulakou, A., Kassomenos, P., Grivas, G., and Spyrellis, N.: Particulate matter and black 25
smoke concentration levels in central Athens, Greece, Environ. Int., 31, 651–659, 2005.
Currie, L. A., Sheffield, A. E., Riederer, G. E., and Gordon, G. E.: Improved atmospheric
ACPD
14, 17161–17196, 2014Long term characterization of
organic and elemental carbon in
the PM2.5
D. Paraskevopoulou et al.
Title Page
Abstract Introduction
Conclusions References
Tables Figures
◭ ◮
◭ ◮
Back Close
Full Screen / Esc
Printer-friendly Version
Interactive Discussion
Discussion
P
a
per
|
Discus
sion
P
a
per
|
Discussion
P
a
per
|
Discussion
P
a
per
|
EPA: Air Quality Criteria for Particulate Matter. EPA. 1. US EPA, Research Triangle Park, NC, 1996.
Galdos, M., Cavalett, O., Seabra, J. E. A., Nogueira, L. A. H., and Bonomi, A.: Trends in global warming and human health impacts related to Brazilian sugarcane ethanol production con-sidering black carbon emissions, Appl. Energ., 104, 576–582, 2013.
5
Gelencsér, A., May, B., Simpson, D., Sánchez-Ochoa, A., Kasper-Giebl, A., Puxbaum, H.,
Ca-seiro, A., Pio, C., and Legrand, M.: Source apportionment of PM2.5 organic aerosol over
Europe: primary/secondary, natural/anthropogenic, and fossil/biogenic origin, J. Geophys. Res.-Atmos., 112, D23S04, doi:10.1029/2006jd008094, 2007.
Gerasopoulos, E., Amiridis, V., Kazadzis, S., Kokkalis, P., Eleftheratos, K., Andreae, M. O., 10
Andreae, T. W., El-Askary, H., and Zerefos, C. S.: Three-year ground based measurements of aerosol optical depth over the Eastern Mediterranean: the urban environment of Athens, Atmos. Chem. Phys., 11, 2145–2159, doi:10.5194/acp-11-2145-2011, 2011.
Grange, S. K., Salmond, J. A., Trompetter, W. J., Davy, P. K., and Ancelet, T.: Effect of
atmo-spheric stability on the impact of domestic wood combustion to air quality of a small urban 15
township in winter, Atmos. Environ., 70, 28–38, 2013.
Grivas, G., Chaloulakou, A., and Kassomenos, P.: An overview of the PM10pollution problem,
in the Metropolitan Area of Athens, Greece. Assessment of controlling factors and potential impact of long range transport, Sci. Total Environ., 389, 165–177, 2008.
Grivas, G., Cheristanidis, S., and Chaloulakou, A.: Elemental and organic carbon in the urban 20
environment of Athens. Seasonal and diurnal variations and estimates of secondary organic carbon, Sci Total Environ., 2012; 1, 535–545, doi:10.1016/j.scitotenv.2011.10.058, 2012. Kanakidou, M., Mihalopoulos, N., Kindap, T., Im, U., Vrekoussis, M., Gerasopoulos, E.,
Der-mitzaki, E., Unal, A., Kocak, M., Markakis, K., Melas, D., Kouvarakis, G., Youssef, A. F., Richter, A., Hatzianastassiou, N., Hilboll, A., Ebojie, F., Wittrock, F., von Savigny, C., Bur-25
rows, J. P., Ladstaetter-Weissenmayer, A., and Moubasher, H.: Megacities as hot spots of air pollution in the East Mediterranean, Atmos. Environ., 45, 1223–1235, 2011.
Kirchstetter, T. W., Corrigan, C. E., and Novakov, T.: Laboratory and field investigation of the adsorption of gaseous organic compounds onto quartz filters, Atmos. Environ., 35, 1663– 1671, 2001.
30
ACPD
14, 17161–17196, 2014Long term characterization of
organic and elemental carbon in
the PM2.5
D. Paraskevopoulou et al.
Title Page
Abstract Introduction
Conclusions References
Tables Figures
◭ ◮
◭ ◮
Back Close
Full Screen / Esc
Printer-friendly Version
Interactive Discussion
Discussion
P
a
per
|
Discus
sion
P
a
per
|
Discussion
P
a
per
|
Discussion
P
a
per
|
Koulouri, E., Saarikoski, S., Theodosi, C., Markaki, Z., Gerasopoulos, E., Kouvarakis, G., Makela, T., Hillamo, R., and Mihalopoulos, N.: Chemical composition and sources of fine and coarse aerosol particles in the Eastern Mediterranean, Atmos. Environ., 42, 6542–6550, 2008.
Krall, J. R., Anderson, G. B., Dominici, F., Bell, M. L., and Peng, R. D.: Short-term exposure to 5
particulate matter constituents and mortality in a national study of U.S. urban communities, Environ Health Persp., 121, 1148–1153, doi:10.1289/ehp.1206185, 2013.
Lelieveld, J., Berresheim, H., Borrmann, S., Crutzen, P. J., Dentener, F. J., Fischer, H., Feichter, J., Flatau, P. J., Heland, J., Holzinger, R., Korrmann, R., Lawrence, M. G., Levin, Z., Markowicz, K. M., Mihalopoulos, N., Minikin, A., Ramanathan, V., de Reus, M., 10
Roelofs, G. J., Scheeren, H. A., Sciare, J., Schlager, H., Schultz, M., Siegmund, P., Steil, B., Stephanou, E. G., Stier, P., Traub, M., Warneke, C., Williams, J., and Ziereis, H.: global air pollution crossroads over the Mediterranean, Science, 298, 794–799, 2002.
Lipsett, M. J., Ostro, B. D., Reynolds, P., Goldberg, D., Hertz, A., Jerrett, M., Smith, D. F., Gar-cia, C., Chang, E. T., and Bernstein, L.: Long-term exposure to air pollution and cardiorespi-15
ratory disease in the California teachers study cohort, Am. J. Resp. Crit. Care, 184, 828–835, doi:10.1164/rccm.201012-2082OC, 2011.
Lonati, G., Ozgen, S., and Giugliano, M.: Primary and secondary carbonaceous species in
PM2.5samples in Milan (Italy), Atmos. Environ., 41, 4599–4610, 2007.
Lonati, G., Giugliano, M., and Ozgen, S.: Primary and secondary components of PM2.5in Milan
20
(Italy), Environ. Int., 34, 665–670, 2008.
Melas, D., Ziomas, I., Klemm, O., and Zerefos, C. S.: Flow dynamics in Athens area under moderate large-scale winds, Atmos. Environ., 32, 2209–2222, 1998.
Mirante, F., Salvador, P., Pio, C., Alves, C., Artinano, B., Caseiro, A., and Revuelta, M. A.: Size fractionated aerosol composition at roadside and background environments in the Madrid 25
urban atmosphere, Atmos. Res., 138, 278–292, 2014.
Molnar, P., Gustafson, P., Johannesson, S., Boman, J., Barregard, L., and Sallsten, G.:
Domes-tic wood burning and PM2.5trace elements: personal exposures, indoor and outdoor levels,
Atmos. Environ., 39, 2643–2653, 2005.
Na, K., Sawant, A. A., Song, C., and Cocker III, D. R.: Primary and secondary carbonaceous 30
ACPD
14, 17161–17196, 2014Long term characterization of
organic and elemental carbon in
the PM2.5
D. Paraskevopoulou et al.
Title Page
Abstract Introduction
Conclusions References
Tables Figures
◭ ◮
◭ ◮
Back Close
Full Screen / Esc
Printer-friendly Version
Interactive Discussion
Discussion
P
a
per
|
Discus
sion
P
a
per
|
Discussion
P
a
per
|
Discussion
P
a
per
|
Novakov, T., Menon, S., Kirchstetter, T. W., Koch, D., and Hansen, J. E.: Aerosol organic car-bon to black carcar-bon ratios: analysis of published data and implications for climate forcing, J. Geophys. Res.-Atmos., 110, D21205, doi:10.1029/2005jd005977, 2005.
Ostro, B., Lipsett, M., Reynolds, P., Goldberg, D., Hertz, A., Garcia, C., Henderson, K. D., and Bernstein, L.: Long-term exposure to constituents of fine particulate air pollution and 5
mortality: results from the California Teachers Study, Environ Health Persp., 118, 363–369, doi:10.1289/ehp.0901181, 2010.
Park, S.-S., Schauer, J. J., and Cho, S.-Y.: Sources and their contribution to two water-soluble organic carbon fractions at a roadway site, Atmos. Environ., 77, 348–357, 2013.
Pateraki, S., Assimakopoulos, V. D., Bougiatioti, A., Kouvarakis, G., Mihalopoulos, N., and Vasi-10
lakos, C.: Carbonaceous and ionic compositional patterns of fine particles over an urban Mediterranean area, Sci. Total Environ., 424, 251–263, 2012.
Piazzola, J., Sellegri, K., Bourcier, L., Mallet, M., Tedeschi, G., and Missamou, T.: 2012. Physic-ochemical characteristics of aerosols measured in the spring time in the Mediterranean coastal zone, Atmos. Environ., 54, 545–556, 2012.
15
Perrone, M. R., Piazzalunga, A., Prato, M., and Carofalo, I.: Composition of fine and coarse particles in a coastal site of the central Mediterranean: carbonaceous species contributions, Atmos. Environ., 45, 7470–7477, 2011.
Pey, J., Perez, N., Castillo, S., Viana, M., Moreno, T., Pandolfi, M., Lopez-Sebastian, J. M., Alastuey, A., and Querol, X.: Geochemistry of regional background aerosols in the Western 20
Mediterranean, Atmos. Res., 94, 422–435, 2009a.
Pey, J., Querol, X., and Alastuey, A. S.: Variations of levels and composition of PM10and PM2.5
at an insular site in the Western Mediterranean, Atmos. Res., 94, 285–299, 2009b.
Pey, J., Alastuey, A., Querol, X., Perez, N., and Cusack, M.: A simplified approach to the indirect evaluation of the chemical composition of atmospheric aerosols from PM mass concentra-25
tions, Atmos. Environ., 44, 5112–5121, 2010.
Pio, C. A., Legrand, M., Oliveira, T., Afonso, J., Santos, C., Caseiro, A., Fialho, P., Barata, F., Puxbaum, H., Sanchez-Ochoa, A., Kasper-Giebl, A., Gelencsér, A., Preunkert, S., and Schock, M.: Climatology of aerosol composition (organic versus inorganic) at nonurban sites on a west-east transect across Europe, J. Geophys. Res.-Atmos., 112, D23S02, 30
ACPD
14, 17161–17196, 2014Long term characterization of
organic and elemental carbon in
the PM2.5
D. Paraskevopoulou et al.
Title Page
Abstract Introduction
Conclusions References
Tables Figures
◭ ◮
◭ ◮
Back Close
Full Screen / Esc
Printer-friendly Version
Interactive Discussion
Discussion
P
a
per
|
Discus
sion
P
a
per
|
Discussion
P
a
per
|
Discussion
P
a
per
|
Pio, C. A., Legrand, M., Alves, C. A., Oliveira, T., Afonso, J., Caseiro, A., Puxbaum, H., Sanchez-Ochoa, A., and Gelencser, A.: Chemical composition of atmospheric aerosols during the 2003 summer intense forest fire period, Atmos. Environ., 42, 7530–7543, 2008.
Pio, C., Cerqueira, M., Harrison, R. M., Nunes, T., Mirante, F., Alves, C., Oliveira, C., Sanchez de
la Campa, A., Artinano, B., and Matos, M.: OC/EC ratio observations in Europe: re-thinking
5
the approach for apportionment between primary and secondary organic carbon, Atmos. Environ., 45, 6121–6132, 2011.
Probert, D. and Tarrant, C.: Environmental risks of power generation from fossil fuels and nu-clear facilities, Appl. Energ., 32, 171–206, 1989.
Putaud, J.-P., Raes, F., Van Dingenen, R., Bruggemann, E., Facchini, M. C., Decesari, S., 10
Fuzzi, S., Gehrig, R., Huglin, C., Laj, P., Lorbeer, G., Maenhaut, W., Mihalopoulos, N., Muller, K., Querol, X., Rodriguez, S., Schneider, J., Spindler, G., Brink, H. T., Torseth, K., and Wiedensohler, A.: A European aerosol phenomenology – 2: Chemical characteristics of particulate matter at kerbside, urban, rural and background sites in Europe, Atmos. Environ., 38, 2579–2595, 2004.
15
Querol, X., Alastuey, A., Ruiz, C. R., Artinano, B., Hansson, H. C., Harrison, R. M., Buringh, E., ten Brink, H. M., Lutz, M., Bruckmann, P., Straehl, P., and Schneider, J.: Speciation and origin
of PM10and PM2.5in selected European cities, Atmos. Environ., 38, 6547–6555, 2004.
Reche, C., Viana, M., Amato, F., Alastuey, A., Moreno, T., Hillamo, R., Teinila, K., Saarnio, K., Seco, R., Penelas, J., Mohr, C., Prevot, A. S. H., and Querol, X.: Biomass burning con-20
tributions to urban aerosols in a coastal Mediterranean City, Sci. Total Environ., 427–428 175–190, 2012.
Remoundaki, E., Kassomenos, P., Mantas, E., Mihalopoulos, N., and Tsezos, M.: Composition
and mass closure of PM2.5in urban environment (Athens, Greece), Aerosol Air Qual. Res.,
13, 72–82, 2013. 25
Robock, A. and Graf, H.-F.: Effects of pre-industrial human activities on climate, Chemosphere,
29, 1087–1097, 1994.
Sanchez de la Campa, A. M., Pio, C., de la Rosa, J. D., Querol, X., Alastuey, A., and Gonzalez-Castanedo, Y.: Characterization and origin of EC and OC particulate matter near the Donana National Park (SW Spain), Environ Res., 109, 671–681, doi:10.1016/j.envres.2009.05.002, 30
ACPD
14, 17161–17196, 2014Long term characterization of
organic and elemental carbon in
the PM2.5
D. Paraskevopoulou et al.
Title Page
Abstract Introduction
Conclusions References
Tables Figures
◭ ◮
◭ ◮
Back Close
Full Screen / Esc
Printer-friendly Version
Interactive Discussion
Discussion
P
a
per
|
Discus
sion
P
a
per
|
Discussion
P
a
per
|
Discussion
P
a
per
|
Sandradewi, J., Prevot, A. S. H., Weingartner, E., Schmidhauser, R., Gysel, M., and
Bal-tensperger, U.: A study of wood burning and traffic aerosols in an Alpine valley using a
multi-wavelength Aethalometer, Atmos. Environ., 42, 101–112, 2008.
Satsangi, A., Pachauri, T., Singla, V., Lakhani, A., and Kumari, K. M.: Organic and elemental carbon aerosols at a suburban site, Atmos. Res., 113, 13–21, 2012.
5
Saylor, R. D., Edgerton, E. S., and Hartsell, B. E.: Linear regression techniques for use in the EC tracer method of secondary organic aerosol estimation, Atmos. Environ., 40, 7546–7556, 2006.
Schmidl, C., Marr, I. L., Caseiro, A., Kotianova, P., Berner, A., Bauer, H., Kasper-Giebl, A., and Puxbaum, H.: Chemical characterisation of fine particle emissions from wood stove 10
combustion of common woods growing in mid-European Alpine regions, Atmos. Environ., 42, 126–141, 2008.
Schwarz, J., Chi, X., Maenhaut, W., Civis, M., Hovorka, J., and Smolik, J.: Elemental and or-ganic carbon in atmospheric aerosols at downtown and suburban sites in Prague, Atmos. Res., 90, 287–302, 2008.
15
Sciare, J., Oikonomou, K., Cachier, H., Mihalopoulos, N., Andreae, M. O., Maenhaut, W., and
Sarda-Estève, R.: Aerosol mass closure and reconstruction of the light scattering coefficient
over the Eastern Mediterranean Sea during the MINOS campaign, Atmos. Chem. Phys., 5, 2253–2265, doi:10.5194/acp-5-2253-2005, 2005.
Sillanpää, M., Frey, A., Hillamo, R., Pennanen, A. S., and Salonen, R. O.: Organic, elemen-20
tal and inorganic carbon in particulate matter of six urban environments in Europe, Atmos. Chem. Phys., 5, 2869–2879, doi:10.5194/acp-5-2869-2005, 2005.
Sillanpää, M., Hillamo, R., Saarikoski, S., Frey, A., Pennanen, A., Makkonen, U., Spolnik, Z., Van Grieken, R., Branis, M., Brunekreef, B., Chalbot, M.-C., Kuhlbusch, T., Sunyer, J., Ker-minen, V.-M., Kulmala, M., and Salonen, R. O.: Chemical composition and mass closure of 25
particulate matter at six urban sites in Europe, Atmos. Environ., 40, Supplement 2, 212–223, 2006.
Terzi, E., Argyropoulos, G., Bougatioti, A., Mihalopoulos, N., Nikolaou, K., and Samara, C.:
Chemical composition and mass closure of ambient PM10 at urban sites, Atmos. Environ.,
44, 2231–2239, 2010. 30
ACPD
14, 17161–17196, 2014Long term characterization of
organic and elemental carbon in
the PM2.5
D. Paraskevopoulou et al.
Title Page
Abstract Introduction
Conclusions References
Tables Figures
◭ ◮
◭ ◮
Back Close
Full Screen / Esc
Printer-friendly Version
Interactive Discussion
Discussion
P
a
per
|
Discus
sion
P
a
per
|
Discussion
P
a
per
|
Discussion
P
a
per
|
Theodosi, C., Grivas, G., Zarmpas, P., Chaloulakou, A., and Mihalopoulos, N.: Mass and
chem-ical composition of size-segregated aerosols (PM1, PM2.5, PM10) over Athens, Greece:
lo-cal versus regional sources, Atmos. Chem. Phys., 11, 11895–11911, doi:10.5194/acp-11-11895-2011, 2011.
Turpin, B. J. and Huntzicker, J. J.: Identification of secondary organic aerosol episodes and 5
quantitation of primary and secondary organic aerosol concentrations during SCAQS, At-mos. Environ., 29, 3527–3544, 1995.
Turpin, B. J. and Lim, H.-J.: Species contributions to PM2.5 mass concentrations: revisiting
common assumptions for estimating organic mass, Aerosol Sci. Tech., 35, 602–610, 2001. Turpin, B. J., Saxena, P., and Andrews, E.: Measuring and simulating particulate organics in the 10
atmosphere: problems and prospects, Atmos. Environ., 34, 2983–3013, 2000.
Viana, M., Chi, X., Maenhaut, W., Querol, X., Alastuey, A., Mikuska, P., and Vecera, Z.: Organic and elemental carbon concentrations in carbonaceous aerosols during summer and winter sampling campaigns in Barcelona, Spain, Atmos. Environ., 40, 2180–2193, 2006.
Viana, M., Maenhaut, W., Chi, X., Querol, X., and Alastuey, A.: Comparative chemical mass 15
closure of fine and coarse aerosols at two sites in south and west Europe: implications for EU air pollution policies, Atmos. Environ., 41, 315–326, 2007.
Vrekoussis, M., Liakakou, E., Kocak, M., Kubilay, N., Oikonomou, K., Sciare, J., and Mihalopou-los, N.: Seasonal variability of optical properties of aerosols in the Eastern Mediterranean, Atmos. Environ., 39, 7083–7094, 2005.
20
Vrekoussis, M., Richter, A., Hilboll, A., Burrows, J. P., Gerasopoulos, E., Lelieveld, J., Barrie, L., Zerefos, C., and Mihalopoulos, N.: Economic crisis detected from space: air quality observa-tions over Athens/Greece, Geophys. Res. Lett., 40, 458–463, 2013.
WHO: Health Aspects of Air Pollution with Particulate Matter, Ozone and Nitrogen Dioxide, World Health Organization, Bonn, Germany, 2003.
25
Yang, F., He, K., Ye, B., Chen, X., Cha, L., Cadle, S. H., Chan, T., and Mulawa, P. A.: One-year record of organic and elemental carbon in fine particles in downtown Beijing and Shanghai, Atmos. Chem. Phys., 5, 1449–1457, doi:10.5194/acp-5-1449-2005, 2005a.
Yang, H., Yu, J. Z., Ho, S. S. H., Xu, J., Wu, W.-S., Wan, C. H., Wang, X., Wang, X., and
Wang, L.: The chemical composition of inorganic and carbonaceous materials in PM2.5 in
30
Nanjing, China, Atmos. Environ., 39, 3735–3749, 2005b.
ACPD
14, 17161–17196, 2014Long term characterization of
organic and elemental carbon in
the PM2.5
D. Paraskevopoulou et al.
Title Page
Abstract Introduction
Conclusions References
Tables Figures
◭ ◮
◭ ◮
Back Close
Full Screen / Esc
Printer-friendly Version
Interactive Discussion
Discussion
P
a
per
|
Discus
sion
P
a
per
|
Discussion
P
a
per
|
Discussion
P
a
per
|
Putaud, J. P., and Tørseth, K.: Elemental and organic carbon in PM10: a one year
measure-ment campaign within the European Monitoring and Evaluation Programme EMEP, Atmos. Chem. Phys., 7, 5711–5725, doi:10.5194/acp-7-5711-2007, 2007.
Yu, J. Z., Tung, J. W. T., Wu, A. W. M., Lau, A. K. H., Louie, P. K. K., and Fung, J. C. H.: Abundance and seasonal characteristics of elemental and organic carbon in Hong Kong 5