AMTD
7, 8125–8147, 2014Investigating uptake of N2O
N. J. Cowan et al.
Title Page
Abstract Introduction
Conclusions References
Tables Figures
◭ ◮
◭ ◮
Back Close
Full Screen / Esc
Printer-friendly Version
Interactive Discussion
Discussion
P
a
per
|
Discus
sion
P
a
per
|
Discussion
P
a
per
|
Discussion
P
a
per
|
Atmos. Meas. Tech. Discuss., 7, 8125–8147, 2014 www.atmos-meas-tech-discuss.net/7/8125/2014/ doi:10.5194/amtd-7-8125-2014
© Author(s) 2014. CC Attribution 3.0 License.
This discussion paper is/has been under review for the journal Atmospheric Measurement Techniques (AMT). Please refer to the corresponding final paper in AMT if available.
Investigating uptake of N
2
O in agricultural
soils using a high-precision dynamic
chamber method
N. J. Cowan1,2, D. Famulari1, P. E. Levy1, M. Anderson1, D. S. Reay2, and U. M. Skiba1
1
Centre for Ecology and Hydrology, Edinburgh, UK
2
School of Geosciences, University of Edinburgh, Edinburgh, UK
Received: 20 June 2014 – Accepted: 21 July 2014 – Published: 6 August 2014 Correspondence to: N. J. Cowan ([email protected])
AMTD
7, 8125–8147, 2014Investigating uptake of N2O
N. J. Cowan et al.
Title Page
Abstract Introduction
Conclusions References
Tables Figures
◭ ◮
◭ ◮
Back Close
Full Screen / Esc
Printer-friendly Version
Interactive Discussion
Discussion
P
a
per
|
Discus
sion
P
a
per
|
Discussion
P
a
per
|
Discussion
P
a
per
|
Abstract
Uptake (or negative flux) of nitrous oxide (N2O) in agricultural soils is a controversial
issue which has proven difficult to investigate in the past due to constraints such as instrumental precision and unknown methodological uncertainties. Using a recently developed high-precision quantum cascade laser (QCL) gas analyser combined with
5
a closed dynamic chamber, a well defined detection limit of 4 µg N2O-N m− 2
h−1could be achieved for individual soil flux measurements. 1220 measurements of N2O flux were made from a variety of UK soils using this method, of which 115 indicated uptake by the soil (i.e. a negative flux in the micrometeorological sign convention). Only 4 of these apparently negative fluxes were greater than the detection limit of the method,
10
which suggests that the vast majority of reported negative fluxes from such measure-ments are actually due to instrument noise. As such, we suggest that the bulk of neg-ative N2O fluxes reported for agricultural fields are most likely due to limits in detection of a particular flux measurement methodology and not as a result of microbiological activity consuming atmospheric N2O.
15
1 Introduction
N2O is a naturally occurring greenhouse gas (GHG) which is formed predominantly in
soils and aquatic environments as a by-product of the microbial processes of nitrifica-tion and denitrificanitrifica-tion (e.g. Davidson et al., 2000). Atmospheric N2O has increased from pre-industrial concentrations of 280 nmol mol−1 to over 320 nmol mol−1(Machida
20
et al., 1995; IPCC, 2013). This increase is believed to be primarily due to agricultural activities such as the production and subsequent application of reactive nitrogen fer-tilisers to agricultural soils, which increases microbial activity and the production of N2O on a global scale (IPCC, 2007, 2013). It is estimated that agriculture contributes either directly or indirectly to over 80 % of all anthropogenic N2O emissions; however, there is 25
AMTD
7, 8125–8147, 2014Investigating uptake of N2O
N. J. Cowan et al.
Title Page
Abstract Introduction
Conclusions References
Tables Figures
◭ ◮
◭ ◮
Back Close
Full Screen / Esc
Printer-friendly Version
Interactive Discussion
Discussion
P
a
per
|
Discus
sion
P
a
per
|
Discussion
P
a
per
|
Discussion
P
a
per
|
N2O from various soils often have large uncertainties associated with them due to the large spatial and temporal variability of N2O flux measurements (Velthof et al., 1996;
Zhu et al., 2013; Chadwick et al., 2014). Accurate measurement of N2O flux from
var-ious agricultural soils can also be difficult to perform due to the relatively low concen-trations of N2O in the atmosphere (nmol mol−
1
). With the exception of nitrogen fertiliser
5
application events, fluxes of N2O from agricultural soils are often small, verging on the
detection limits of gas analysers (<20 µg N2O-N m− 2
h−1) (Smith et al., 1994; Flechard et al., 2005).
Reported observations of negative fluxes (or uptake) of N2O from the atmosphere
into agricultural soils are relatively common in literature and have been reported in
10
several studies using different methodologies (sometimes exceeding values as high as 50 µg N2O-N m−
2
h−1) (Ryden, 1981; Papen et al., 2001; Butterbach-Bahl et al., 2002; Flechard et al., 2005). In these studies the authors attribute the uptake of N2O to
microbial denitrification, which is biologically plausible (Okereke, 1993; Davidson et al., 2000). However, there has been much debate over whether the observed negative
15
fluxes of N2O are genuinely a result of microbial uptake or merely experimental or
instrumental artefacts (Chapuis-Lardy et al., 2007).
The static chamber approach is generally deployed to monitor N2O fluxes from
agri-cultural soils (Jones et al., 2007; Hensen et al., 2013). Fluxes derived from static chamber methods are often prone to high instrumental noise from gas chromatograph
20
(GC) instruments, the choice of regression method used and temperature and pres-sure changes within the chamber (Venterea et al., 2009; Levy et al., 2011). N2O fluxes
also show very high spatial variability, which makes it more difficult to judge whether any individual measurement is an erroneous outlier or truly valid (Cowan et al., 2014b, d).
25
Recent advances in infra-red laser technology have resulted in the commercial availability of high precision trace gas analysers such as quantum cascade lasers (QCLs) capable of measuring N2O concentrations with very high precision and
AMTD
7, 8125–8147, 2014Investigating uptake of N2O
N. J. Cowan et al.
Title Page
Abstract Introduction
Conclusions References
Tables Figures
◭ ◮
◭ ◮
Back Close
Full Screen / Esc
Printer-friendly Version
Interactive Discussion
Discussion
P
a
per
|
Discus
sion
P
a
per
|
Discussion
P
a
per
|
Discussion
P
a
per
|
in a measurement system with a significantly lower detection limit than GC-based static chamber methods. We used this system to measure a total of 1220 fluxes at five field sites across the UK at different times of the year. This study aimed to investigate the occurrence and validity of negative fluxes of N2O within this data set, and their relation-ship with commonly measured soil properties.
5
2 Materials and methods
2.1 Dynamic chamber method
All of the N2O flux measurements reported in this paper were made using a
non-steady-state flow-through (or closed dynamic) chamber system which circulated air between a flux chamber and a quantum cascade laser (QCL) gas analyser (as
de-10
scribed in Cowan et al., 2014a). A compact continuous wave QCL (CW-QC-TILDAS-76-CS, Aerodyne Research Inc., Billerica, MA, USA) was used to measure gas mixing ratios within the dynamic chamber system. The instrumentation was either placed in a stationary cabin or secured inside a 4 wheel drive vehicle to allow for mobile mea-surements. The system could be powered from a main power supply when available;
15
and when used in mobile conditions, a diesel generator was required which was kept on a tow trailer to provide a constant supply of electricity to the system.
The chamber consisted of a cylindrical polyvinyl chloride (PVC) plastic pipe of 48 cm inner diameter (ID) and 22 cm height with closed cell neoprene sponge attached to the underside. It was placed onto circular stainless steel collars which were inserted
20
(approximately 5 cm) into the soil and the neoprene sponge formed an airtight seal between the chamber and the collar. Clips were added to the chamber to increase the strength of this seal. Two 30 m lengths of 3/8 inch ID Tygon® tubing were attached to both the inlet of the QCL and the outlet of the pump. This provided a 30 m radius from the analyser in which the chamber could be placed. A flow rate of approximately 6 to
25
AMTD
7, 8125–8147, 2014Investigating uptake of N2O
N. J. Cowan et al.
Title Page
Abstract Introduction
Conclusions References
Tables Figures
◭ ◮
◭ ◮
Back Close
Full Screen / Esc
Printer-friendly Version
Interactive Discussion
Discussion
P
a
per
|
Discus
sion
P
a
per
|
Discussion
P
a
per
|
Discussion
P
a
per
|
The dynamic chamber method records gas mixing ratios at a rate of 1 Hz during flux measurements which allows detailed investigation of an individual flux measurement. During the 180 s enclosure time of each chamber measurement the first 60 s of mea-surements are discarded to give the system time to mix air between the chamber and the analyser. A total of approximately 120 mixing ratio measurements are then used to
5
calculate fluxes of N2O from each chamber location.
Fluxes of N2O were calculated using linear and non-linear asymptotic regression methods using the HMR package for the statistical software R (Pedersen et al., 2010; Levy et al., 2011). Using a mixture of goodness-of-fit statistics and visual inspection the regression method that provided the best fit for the time series of mixing ratio was
cho-10
sen for each individual measurement. The rate of change in mixing ratio of a particular gas can then be used to calculate soil flux for each measurement (Eq. 1).
F = dC
dt0
·ρV
A (1)
Where F is gas flux from the soil (µmol m−2s−1), dC/dt
0 is the initial rate of change
in mixing ratio with time in µmol mol−1s−1,ρ is the density of air in mol m−3,V is the
15
volume of the chamber in m3andAis the ground area enclosed by the chamber in m2.
2.2 Field sites
The dynamic chamber method was developed to improve the precision of N2O flux measurement from soils and verify other chamber methodologies in a national project (InveN2Ory; http://www.ghgplatform.org.uk/) to improve the agricultural greenhouse 20
gas emissions inventory in the UK (Skiba et al., 2012). The dynamic chamber has been used at a variety of field sites run by different research groups across the UK between 2011 and 2014 where N2O flux experiments were taking place using more
common static chamber methodologies (see Table 1; Chadwick et al., 2014). The ma-jority of measurements made during the project were from areas within Easter Bush
AMTD
7, 8125–8147, 2014Investigating uptake of N2O
N. J. Cowan et al.
Title Page
Abstract Introduction
Conclusions References
Tables Figures
◭ ◮
◭ ◮
Back Close
Full Screen / Esc
Printer-friendly Version
Interactive Discussion
Discussion
P
a
per
|
Discus
sion
P
a
per
|
Discussion
P
a
per
|
Discussion
P
a
per
|
Farm Estate (Penicuik, Midlothian), which is run jointly between the Scottish Rural Uni-versity College (SRUC) and the UniUni-versity of Edinburgh (UoE).
Soil samples were collected for individual flux measurements during the farm and grazed grassland field experiments at Easter Bush in order to investigate which soil properties were driving N2O fluxes. From these locations 5 cm deep soil samples were 5
taken from inside the chamber collar using a 2 cm wide corer immediately after the flux measurement was completed. These soils were used to determine soil pH, soil mois-ture content (via oven drying at 100◦C) and available nitrogen in the form of ammonium (NH+4) and nitrate (NO−3) via KCl extraction. Bulk density soil samples also were taken immediately after the flux measurement using a sharp metal cutting cylinder (7.4 cm
10
diameter, 5 cm deep), which was carefully hammered into undisturbed soil. Bulk den-sity samples were used to calculate total carbon and nitrogen content of the soil, soil moisture content and WFPS % (Rowell, 1994). All soils were frozen after collection from the field sites for preservation before lab analysis was carried out. This provided 455 soil samples with individual flux measurements associated with each of them, 61of
15
which were from locations that reported negative N2O flux. It was not possible to take
destructive soil samples directly from the nitrogen fertiliser manipulation chambers, as this would have interfered with the very frequent (at least weekly) flux measurement programme.
3 Results
20
3.1 Measured fluxes of N2O
Flux magnitude measured from the different field sites across the UK varied between
−5.5 to 27 475 µg N2O-N m− 2
h−1. A large variety of soil types, fertiliser treatments and agricultural fields which contained different crops and grazing animals were all mea-sured during the experiments which provided many areas of high and low N2O fluxes.
25
The vast majority of the N2O fluxes measured were below 50 µg N2O-N m− 2
AMTD
7, 8125–8147, 2014Investigating uptake of N2O
N. J. Cowan et al.
Title Page
Abstract Introduction
Conclusions References
Tables Figures
◭ ◮
◭ ◮
Back Close
Full Screen / Esc
Printer-friendly Version
Interactive Discussion
Discussion
P
a
per
|
Discus
sion
P
a
per
|
Discussion
P
a
per
|
Discussion
P
a
per
|
of the 1220 measurements (73 %) fell into this category (Fig. 1). Of these, 115 of the measurements showed negative fluxes of N2O, accounting for 9.4 % of all of the
mea-surements made.
The detection limit of the dynamic chamber system (as defined by double the typical standard deviation (SD) of a zero flux measurement reported in Cowan et al., 2014a) is
5
approximately 2 to 4 µg N2O-N m− 2
h−1. Uncertainty in flux in each chamber measure-ment is calculated by propagating the uncertainty associated with each of the terms in Eq. (1) to estimate the total uncertainty in the flux. Uncertainty in dC/dt was ob-tained from the 95 % confidence interval in the regression slope parameter. As 1 Hz mixing ratios provide approximately 120 measurements over the 2 min enclosure
pe-10
riod and both linear and non-linear regression methods are applied for each individual measurement to see which fits best, the uncertainty in dC/dt caused by the choice of regression method is far less significant than previous studies which used 3–5 mixing ratio measurements over the period of an hour (Parkin et al., 2012).
Uncertainty in the chamber volume could be estimated by taking several
measure-15
ments of height in each chamber, and taking the 95 % confidence interval in the cal-culated chamber volume. Including estimates of the volume of vegetation, this gave values of approximately 10 % of the total volume. Uncertainty in the air density term (ρ) arises from uncertainties in the temperature and pressure measurements. The 95 % confidence interval for the mean temperature and pressure was calculated from the
20
1 Hz data, and added to the instrumental precision of the temperature probe (0.4◦C) and pressure sensor (50 Pa). Of the apparent negative fluxes recorded during all of the experiments only 4 exceed the negative limit of detection (0.3 %) (Fig. 2). Moreover, these fluxes (3 of which are shown in Fig. 3a–c) only slightly exceeded the detection limit of the system varying from−4.1 to−5.5 µg N2O-N m−
2
h−1.
25
AMTD
7, 8125–8147, 2014Investigating uptake of N2O
N. J. Cowan et al.
Title Page
Abstract Introduction
Conclusions References
Tables Figures
◭ ◮
◭ ◮
Back Close
Full Screen / Esc
Printer-friendly Version
Interactive Discussion
Discussion
P
a
per
|
Discus
sion
P
a
per
|
Discussion
P
a
per
|
Discussion
P
a
per
|
the chamber or a gas analyser issue. In certain conditions the sensitivity of the QCL can change due to a rapid temperature change or for example electronic noise from a generator or power supply. In these situations, at near zero flux conditions, it is difficult to determine whether a negative flux of N2O is real or an artefact of instrumental noise (Fig. 3d). Of the 115 apparently negative fluxes measured a mixture of both is likely to
5
have taken place.
3.2 Soil analysis of low flux locations
Soil samples were available for 190 chamber measurements which measured N2O flux below 10 µg N2O-N m−2
h−1
. Multiple linear regression analysis was used to investi-gate the relationship between flux and soil properties for fluxes reported in the range
10
of−10 to 10 µg N2O-N m− 2
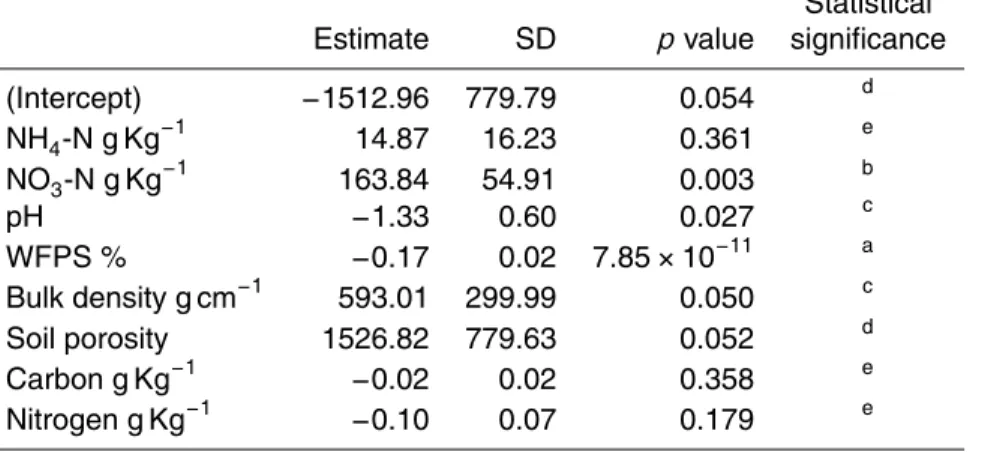
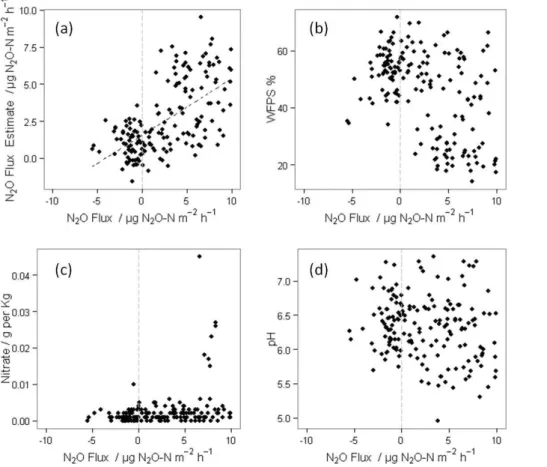
h−1 (see Table 2). The results of the regression analysis suggest that a weak relationship does exist between the measured soil properties and fluxes measured (R2=0.38) (Fig. 4a). The properties which correlate strongest with measured flux are WFPS %, available NO−3, pH and bulk density. Individual compari-son between flux and each of these soil properties reveals no clear indication of which
15
soil conditions would provide ideal conditions for negative flux observations (Fig. 4b– d). From the soil analysis results it could be suggested that in general, negative fluxes of N2O tend to contain very low concentrations of NO−
3 (below 0.01 mg kg
−1), and are
more likely to occur in damper soils (WFPS>40 %) with a pH of approximately 6.5; however the lack of observable difference in the soil properties measured between
20
AMTD
7, 8125–8147, 2014Investigating uptake of N2O
N. J. Cowan et al.
Title Page
Abstract Introduction
Conclusions References
Tables Figures
◭ ◮
◭ ◮
Back Close
Full Screen / Esc
Printer-friendly Version
Interactive Discussion
Discussion
P
a
per
|
Discus
sion
P
a
per
|
Discussion
P
a
per
|
Discussion
P
a
per
|
4 Discussion
The results in this paper show that even when using a high precision flux measurement methodology a relatively high proportion of apparently negative fluxes are recorded; however, these measurements rarely exceed the detection limit of the measurement method (Fig. 2). The frequency of near zero fluxes below the detection limit is very
5
high (28 % of measurements reported fluxes below 4 µg N2O-N m− 2
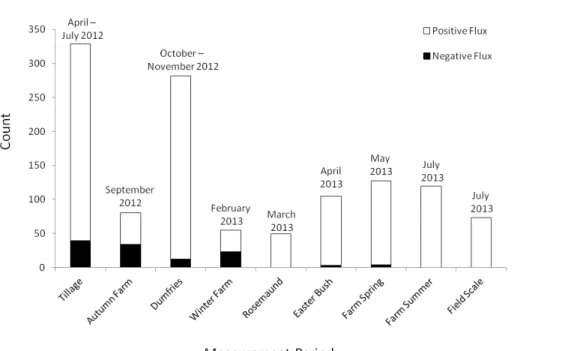
) and many of the negative flux measurements in this experiment are likely to be caused by noise in the gas analyser (as shown in Fig. 3d). A look at the change in ratio of negative fluxes with time also supports this theory. In the development stages of the dynamic chamber method (2012 measurements) the signal to noise ratio of the system was slightly lower
10
due to unstable temperature conditions for the analyser and lack of a stable source of power supply. As the system logistics were optimized, the flux detection limit improved slightly and the number of negative fluxes recorded fell rapidly (see Fig. 5).
It would be too simplistic to assume that instrumental noise is the cause of all of the negative fluxes of N2O measured in these experiments, as can be seen in Fig. 3a–c. 15
In these examples it is clear that concentrations of N2O decreased below the ambient concentrations of N2O in the atmosphere. It is highly unlikely that an increase in N2O
concentration followed by a subsequent leak could cause this effect over the short 120 s measurement period in our dynamic chamber method. However, this explanation would be plausible over the much longer, 30–60 min incubation periods required by
20
static chamber methods (Cowan et al., 2014a). Although very rare, consistent decline in N2O concentrations are observed in some of the measurements (as in Fig. 3) and the reasons for these observations are yet to be found.
One hypothesis which was tested in laboratory conditions using this methodology is that N2O may dissolve in moisture in the tubing of the dynamic chamber system
25
in wetter and colder conditions. This theory was tested early in the development of the dynamic chamber system and no effect on N2O concentration measurements was
AMTD
7, 8125–8147, 2014Investigating uptake of N2O
N. J. Cowan et al.
Title Page
Abstract Introduction
Conclusions References
Tables Figures
◭ ◮
◭ ◮
Back Close
Full Screen / Esc
Printer-friendly Version
Interactive Discussion
Discussion
P
a
per
|
Discus
sion
P
a
per
|
Discussion
P
a
per
|
Discussion
P
a
per
|
have on the system in different temperature conditions may be very small and difficult to detect in lab conditions. Some interference in N2O measurements caused by moisture
and high humidity remains one explanation of N2O uptake in the system using this
methodology. Very slight laser drift and spectra fitting caused by rough environmental conditions and transportation of the delicate instrumentation are other possible reasons
5
for this uptake effect, although we see no evidence from any of the recorded data that this is the case; moreover, there is no reason to believe the decreased signal to noise ratio due to these disturbances would not produce an equal distortion in the positive range of the fluxes.
It is believed that uptake of N2O in agricultural soils may be the result of
denitrifi-10
cation occurring at the surface layer of soils which converts atmospheric N2O into N2 (Yu et al., 2000; Wrage et al., 2004). Past experiments have linked negative fluxes to soil properties such as moisture content, temperature, pH, oxygen and available nitro-gen (Heincke and Kaupenjohann, 1999; Khalil et al., 2002). N2O uptake has also been recorded from forest soils with similar links observed between N2O flux and available 15
nitrogen (Rosenkranz et al., 2006; Goldberg and Gebauer, 2009); however, the influ-ence of these factors seems to vary between different experiments and no clear set of conditions which would favour negative fluxes from different soil types can be estab-lished. It remains plausible that various microbial processes in soils are able to remove N2O from the atmosphere; however, the mechanisms and triggers for N2O uptake need
20
to be studied further to understand these processes (Chapuis-Lardy et al., 2007). The analysis of soil samples taken from locations where negative and low fluxes were measured in this study showed no clear relationship between flux and soil properties. The heterogeneous nature of soils often increases the uncertainty of measured soil properties from a particular location which may be clouding any relationships present,
25
AMTD
7, 8125–8147, 2014Investigating uptake of N2O
N. J. Cowan et al.
Title Page
Abstract Introduction
Conclusions References
Tables Figures
◭ ◮
◭ ◮
Back Close
Full Screen / Esc
Printer-friendly Version
Interactive Discussion
Discussion
P
a
per
|
Discus
sion
P
a
per
|
Discussion
P
a
per
|
Discussion
P
a
per
|
higher instrumental uncertainty which was improved in subsequent measurements or if it is a genuine effect of the wetter soil properties at the time. A moisture effect on the methodology could also have increased the possibility of negative flux measurements during these wetter periods.
What is clear from this study is that true negative fluxes of N2O from the
agricul-5
tural soils examined are rare and very small. The issues that still exist in identifying when negative fluxes of N2O are real or caused by instrumental noise using a high
precision QCL instrument suggests that more commonly used N2O flux measurement
methodologies, such as the static chamber method, would have been unable to mea-sure negative fluxes of N2O with the precision required to identify if they are real or not. 10
The results of this study suggest that large negative fluxes reported in the literature may in fact indicate a larger detection limit of an individual methodology than previ-ously thought, which may explain many reports of negative flux measurements in the literature (Jordan et al., 1998; Flechard et al., 2005; Jones et al., 2011). Certainly, the majority of negative fluxes reported in this study were most likely caused by
instrumen-15
tal noise (as shown by Figs. 2 and 3d). The high frequency of near zero-fluxes of N2O
from soils highlights the need for higher precision measurements (able to detect in the region of 0 to 10 µg N2O-N m−2h−1) when wanting to characterise the N
2O exchange
processes between soil and air in background or unperturbed conditions.
When negative fluxes of N2O are measured during field experiments it can be detri-20
mental to the study as it complicates the calculation of cumulative fluxes and emission factors from certain soils and agricultural practices. This issue has been addressed several ways in the past. Negative fluxes are sometimes treated as real and left in all calculations or declared false measurements and removed or set to zero flux values. In theory when using flux chambers a larger number of measurements should help
25
AMTD
7, 8125–8147, 2014Investigating uptake of N2O
N. J. Cowan et al.
Title Page
Abstract Introduction
Conclusions References
Tables Figures
◭ ◮
◭ ◮
Back Close
Full Screen / Esc
Printer-friendly Version
Interactive Discussion
Discussion
P
a
per
|
Discus
sion
P
a
per
|
Discussion
P
a
per
|
Discussion
P
a
per
|
flux estimates over long periods of time it is important to propagate the large uncer-tainty in measurements with time as well as the average fluxes measured. This may lead to very large uncertainties in these types of experiments; however, if this is the case then it may indicate that a particular cumulative flux methodology is not suitable for purpose.
5
5 Conclusions
Four small negative fluxes of N2O out of 1220 have been recorded in this study greater than the defined detection limit of the measurement methodology. The reason for these four negative fluxes is still not fully understood and these observations do not provide strong evidence for the occurrence of microbial net uptake of N2O. This study suggests
10
that it is likely that many recorded negative fluxes of N2O are significantly smaller and
rarer than reported in previous literature. We also highlight the need to fully understand whether negative flux measurements are real or simply readings below the detection limit of the measurement methodology. For these reasons we wish to highlight the importance of specifying the “real” flux detection limit associated to each dataset, as
15
opposed to a theoretical detection limit associated exclusively with the factory-declared precision of the gas analysers: this would allow a more robust estimate of the net contribution of each agricultural environment investigated.
The drivers of true negative N2O flux in agricultural soils cannot be identified in this study. We suggest that, from the evidence presented here, it can be assumed that
20
negative fluxes measured from agricultural soils are a good indicator of the true detec-tion limit of a flux measurement methodology. The results of this study provide strong evidence against the theory that negative fluxes of N2O in agricultural soils can be a significant sink of atmospheric N2O, as most of the negative N2O fluxes reported are
likely to be an artefact of measurement methodology.
AMTD
7, 8125–8147, 2014Investigating uptake of N2O
N. J. Cowan et al.
Title Page
Abstract Introduction
Conclusions References
Tables Figures
◭ ◮
◭ ◮
Back Close
Full Screen / Esc
Printer-friendly Version
Interactive Discussion
Discussion
P
a
per
|
Discus
sion
P
a
per
|
Discussion
P
a
per
|
Discussion
P
a
per
|
Acknowledgements. We thank SRUC, the University of Edinburgh, and ADAS for providing the field sites from which fluxes could be measured using the dynamic chamber method. We also thank DEFRA and the UK Devolved Administrations for financial support through the UK GHG Platform project AC0116 (The InveN2Ory project).
References 5
Bell, M. J., Rees, R. M., Cloy, J. M., Topp, C. F. E., Bagnall, A., and Chadwick, D. R.: Nitrous oxide emissions from cattle excreta: effects of soil and climatic conditions and a nitrification inhibitor, Sci. Total Environ., submitted, 2014.
Butterbach-Bahl, K., Breuer, L., Gasche, R., Willibald, G., and Papen, H.: Exchange of trace gases between soils and the atmosphere in Scots pine forest ecosystems of the northeast-10
ern German lowlands: 1. Fluxes of N2O, NO/NO2 and CH4 at forest sites with different N-deposition, Forest Ecol. Manag., 167, 123–134, 2002.
Chadwick, D. R., Cardenas, L., Misselbrook, T. H., Smith, K. A., Rees, R. M., Watson, C. J., Mcgeough, K. L., Williams, J. R., Cloy, J. M., Thorman, R. E., and Dhanoa, M. S.: Opti-mizing chamber methods for measuring nitrous oxide emissions from plot-based agricultural 15
experiments, Eur. J. Soil Sci., 65, 295–307, 2014.
Chapuis-Lardy, L., Wrage, N., Metay, A., Chotte, J.-L., and Bernoux, M.: Soils, a sink for N2O? A review, Glob. Change Biol., 13, 1–17, 2007.
Cowan, N. J., Famulari, D., Levy, P. E., Anderson, M., Bell, M. J., Rees, R. M., Reay, D. S., and Skiba, U. M.: An improved method for measuring soil N2O fluxes using a quantum cascade 20
laser with a dynamic chamber, Eur. J. Soil Sci., in press, 2014a.
Cowan, N. J., Famulari, D., Levy, P. E., Reay, D. S., and Skiba, U. M.: The influence of tillage on N2O fluxes from an intensively managed grazed grassland in Scotland, in preparation, 2014b.
Cowan, N. J., Famulari, D., Levy, P. E., Anderson, M., Reay, D. S., and Skiba, U. M.: A farm 25
scale inventory of N2O fluxes from a typical livestock farm in Central Scotland, in preparation, 2014c.
Cowan, N. J., Norman, P., Famulari, D., Levy, P. E., Reay, D. S., Skiba, U. M. Measuring spatial variability of N2O fluxes from grazed grassland soils at a field scale using a high precision dynamic chamber method, in preparation, 2014d.
AMTD
7, 8125–8147, 2014Investigating uptake of N2O
N. J. Cowan et al.
Title Page
Abstract Introduction
Conclusions References
Tables Figures
◭ ◮
◭ ◮
Back Close
Full Screen / Esc
Printer-friendly Version
Interactive Discussion
Discussion
P
a
per
|
Discus
sion
P
a
per
|
Discussion
P
a
per
|
Discussion
P
a
per
|
Davidson, E. A., Keller, M., Erickson, H. E., Verchot, L. V., and Veldkamp, E.: Testing a concep-tual model of soil emissions of nitrous and nitric oxides, Bioscience, 50, 667–680, 2000. Flechard, C. R., Neftel, A., Jocher, M., Ammann, C., and Fuhrer, J.: Bi-directional
soil/atmosphere N2O exchange over two mown grassland systems with contrasting man-agement practices, Glob. Change Biol., 11, 2114–2127, 2005.
5
Goldberg, S. D. and Gebauer, G.: Drought turns a Central European Norway spruce forest soil from an N2O source to a transient N2O sink, Global Change Biol, 15, 850–860, 2009. Heincke, M. and Kaupenjohann, M.: Effects of soil solution on the dynamics of N2O emissions:
a review, Nutr. Cycl. Agroecosys., 55, 133–157, 1999.
Hensen, A., Skiba, U., and Famulari, D.: Low cost and state of the art methods to measure 10
nitrous oxide emissions, Environ. Res. Lett., 8, 025022, doi:10.1088/1748-9326/8/2/025022, 2013.
IPCC: Climate Change 2007: The Physical Science Basis. Contribution of Working Group I to the Fourth Assessment Report of the Intergovernmental Panel on Climate Change, edited by: Solomon, S., Qin, D., Manning. M., Chen, Z., Marquis, M., Averyt, K. B., Tignor, M., and 15
Miller, H. L., Cambridge University Press, Cambridge, UK and New York, NY, USA, 996 pp., 2007.
IPCC: Climate Change 2013: The Physical Science Basis. Contribution of Working Group I to the Fifth Assessment Report of the Intergovernmental Panel on Climate Change, edited by: Stocker, T. F., Qin, D., Plattner, G.-K., Tignor, M., Allen, S. K., Boschung, J., Nauels, A., Xia, 20
Y., Bex, V., and Midgley, P. M., Cambridge University Press, Cambridge, United Kingdom and New York, NY, USA, 1535 pp., 2013.
Jones, S. K., Rees, R. M., Skiba, U. M., and Ball, B. C.: Influence of organic and mineral N fertiliser on N2O fluxes from a temperate grassland, Agr. Ecosyst. Environ., 121, 74–83, 2007.
25
Jones, S. K., Famulari, D., Di Marco, C. F., Nemitz, E., Skiba, U. M., Rees, R. M., and Sutton, M. A.: Nitrous oxide emissions from managed grassland: a comparison of eddy covariance and static chamber measurements, Atmos. Meas. Tech., 4, 2179–2194, doi:10.5194/amt-4-2179-2011, 2011.
Jordan, T. E., Weller, D. E., and Correll, D. L.: Denitrification in surface soils of a riparian forest: 30
AMTD
7, 8125–8147, 2014Investigating uptake of N2O
N. J. Cowan et al.
Title Page
Abstract Introduction
Conclusions References
Tables Figures
◭ ◮
◭ ◮
Back Close
Full Screen / Esc
Printer-friendly Version
Interactive Discussion
Discussion
P
a
per
|
Discus
sion
P
a
per
|
Discussion
P
a
per
|
Discussion
P
a
per
|
Khalil, M. I., Rosenani, A. B., Van Cleemput, O., Fauziah, C. I., and Shamshuddin, J.: Nitrous oxide emissions from an ultisol of the humid tropics under maize-groundnut rotation, J. Env-iron. Qual., 31, 1071–1078, 2002.
Levy, P. E., Gray, A., Leeson, S. R., Gaiawyn, J., Kelly, M. P. C., Cooper, M. D. A., Dins-more, K. J., Jones, S. K., and Sheppard, L. J.: Quantification of uncertainty in trace gas 5
fluxes measured by the static chamber method, Eur. J. Soil Sci., 62, 811–821, 2011. Machida, T., Nakazawa, T., Fujii, Y., Aoki, S., and Watanabe, O.: Increase in the Atmospheric
nitrous-oxide concentration during the last 250 years, Geophys. Res. Lett., 22, 2921–2924, 1995.
Okereke, G. U.: Growth yield of denitrifiers using nitrous oxide as a terminal electron acceptor, 10
World J. Microb. Biot., 9, 59–62, 1993.
Papen, H., Daum, M., Steinkamp, R., and Butterbach-Bahl, K.: N2O and CH4-fluxes from soils of a N-limited and N-fertilized spruce forest ecosystem of the temperate zone, J. Appl. Bot. Food Qual., 75, 159–163, 2001.
Parkin, T. B., Venterea, R. T., and Hargreaves, S. K.: Calculating the detection limits of chamber-15
based soil greenhouse gas flux measurements, J. Environ. Qual., 41, 705–715, 2012. Pedersen, A. R., Petersen, S. O., and Schelde, K.: A comprehensive approach to soil–
atmosphere trace-gas flux estimation with static chambers, Eur. J. Soil Sci., 61, 888–902, 2010.
Rosenkranz, P., Brüggemann, N., Papen, H., Xu, Z., Seufert, G., and Butterbach-Bahl, K.: 20
N2O, NO and CH4exchange, and microbial N turnover over a Mediterranean pine forest soil, Biogeosciences, 3, 121–133, doi:10.5194/bg-3-121-2006, 2006.
Rowell, D.: Soil Science; Methods and Application, Longman Scientific & Technical, 1994. Ryden, J. C.: N2O exchange between a grassland soil and the atmosphere, Nature, 292, 235–
237, 1981. 25
Skiba, U., Jones, S. K., Dragosits, U., Drewer, J., Fowler, D., Rees, R. M., Pappa, V. A., Carde-nas, L., Chadwick, D., Yamulki, S., and Manning, A. J.: UK emissions of the greenhouse gas nitrous oxide, Philos. T. R. Soc. B, 367, 1175–1185, 2012.
Smith, K. A., Clayton, H., Arab, J. R. M., Christensen, S., Ambus, P., Fowler, D., Hargreaves, K. J., Skiba, U., Harris, G. W., Wienhold, F. G., Klemedtsson, L., and Galle, B.: Micrometeoro-30
AMTD
7, 8125–8147, 2014Investigating uptake of N2O
N. J. Cowan et al.
Title Page
Abstract Introduction
Conclusions References
Tables Figures
◭ ◮
◭ ◮
Back Close
Full Screen / Esc
Printer-friendly Version
Interactive Discussion
Discussion
P
a
per
|
Discus
sion
P
a
per
|
Discussion
P
a
per
|
Discussion
P
a
per
|
Velthof, G. L., Jarvis, S. C., Stein, A., Allen, A. G., and Oenema, O.: Spatial variability of nitrous oxide fluxes in mown and grazed grasslands on a poorly drained clay soil, Soil Biol. Biochem., 28, 1215–1225, 1996.
Venterea, R. T., Spokas, K. A., and Baker, J. M.: Accuracy and precision analysis of chamber-based nitrous oxide gas flux estimates, Soil Sci. Soc. Am. J., 73, 1087–1093, 2009.
5
Wrage, N., Lauf, J., del Prado, A., Pinto, M., Pietrzak, S., Yamulki, S., Oenema, O., and Gebauer, G.: Distinguishing sources of N2O in European grasslands by stable isotope anal-ysis, Rapid Commun. Mass Sp., 18, 1201–1207, 2004.
Yu, K., Chen, G., Struwe, S., and Kjoller, A.: Production and reduction of nitrous oxide in agri-cultural and forest soils, Ying yong sheng tai xue bao, J. Appl. Ecol., 11, 385–389, 2000. 10
AMTD
7, 8125–8147, 2014Investigating uptake of N2O
N. J. Cowan et al.
Title Page
Abstract Introduction
Conclusions References
Tables Figures
◭ ◮
◭ ◮
Back Close
Full Screen / Esc
Printer-friendly Version
Interactive Discussion
Discussion
P
a
per
|
Discus
sion
P
a
per
|
Discussion
P
a
per
|
Discussion
P
a
per
|
Table 1.A summary of all InveN2Ory field sites from which N2O fluxes were made using the
dynamic chamber method.
Location Dates of Measurement Soil Total Annual No. of No. of measurements details Texture annual Average air M’mnts negative
rainfall (mm) temperature (◦C) fluxes Nitrogen fertiliser manipulation plotsa
Dumfries (SRUC)b Oct–Nov 2012 Grazed Grassland, SW
Scotland,
Mineral N, or manure appli-cations
Sandy loam 1211 10.2 282 12
Rosemaund (ADAS)c Mar 2013 Barley, SW England Slurry, manure applications
Silty clay loam 418 10.4 49 0
Easter Bush (SRUC) Apr–May 2013 Barley, Central Scotland Slurry, manure applications
Clay loam 937 10.2 105 3
On-farm measurements (UoE and SRUC)
2 grazed grasslandsd Apr–Jul 2012 Adjacent tilled and un-tilled
sheep grazed grasslands
Clay loam 937 10.2 329 39
Autumn-Farme Sep 2012 Mixture of grazed and
arable fields across Easter Bush Farm Estate
Clay loam 937 10.2 80 34
Winter-Farm Feb 2013 As above Clay loam 937 10.2 55 23 Spring-Farm May 2013 As above Clay loam 937 10.2 127 4 Summer-Farm Jul 2013 As above Clay loam 937 10.2 120 0 Grazed grasslandf Jul 2013 Grassland with high
stock-ing density of sheep on Easter Bush Farm Estate
Clay loam 937 10.2 73 0
Total 1220 115
a
Overall experimental design is described in Chadwick et al. (2014).
b
Bell et al. (2014, submitted June 2014).
c
J. R. Williams et al., ADAS, personal communication, 2013.
dCowan et al. (2014b, submitted July 2014). e
Cowan et al. (2014c, submitted August 2014).
f
AMTD
7, 8125–8147, 2014Investigating uptake of N2O
N. J. Cowan et al.
Title Page
Abstract Introduction
Conclusions References
Tables Figures
◭ ◮
◭ ◮
Back Close
Full Screen / Esc
Printer-friendly Version
Interactive Discussion
Discussion
P
a
per
|
Discus
sion
P
a
per
|
Discussion
P
a
per
|
Discussion
P
a
per
|
Table 2.Multiple linear regression correlation of soil properties and N2O flux below 10 µg N2
O-N m−2
h−1
as plotted in Fig. 4a.
Statistical Estimate SD pvalue significance (Intercept) −1512.96 779.79 0.054 d NH4-N g Kg−1
14.87 16.23 0.361 e
NO3-N g Kg−1 163.84 54.91 0.003 b
pH −1.33 0.60 0.027 c
WFPS % −0.17 0.02 7.85×10⁻¹¹ a
Bulk density g cm−1 593.01 299.99 0.050 c Soil porosity 1526.82 779.63 0.052 d Carbon g Kg−1
−0.02 0.02 0.358 e
Nitrogen g Kg−1
−0.10 0.07 0.179 e
AMTD
7, 8125–8147, 2014Investigating uptake of N2O
N. J. Cowan et al.
Title Page
Abstract Introduction
Conclusions References
Tables Figures
◭ ◮
◭ ◮
Back Close
Full Screen / Esc
Printer-friendly Version
Interactive Discussion
Discussion
P
a
per
|
Discus
sion
P
a
per
|
Discussion
P
a
per
|
Discussion
P
a
per
|
Figure 1. Frequency of all N2O fluxes measured from all locations excluding those above
1000 µg N2O-N m−2
h−1
AMTD
7, 8125–8147, 2014Investigating uptake of N2O
N. J. Cowan et al.
Title Page
Abstract Introduction
Conclusions References
Tables Figures
◭ ◮
◭ ◮
Back Close
Full Screen / Esc
Printer-friendly Version
Interactive Discussion
Discussion
P
a
per
|
Discus
sion
P
a
per
|
Discussion
P
a
per
|
Discussion
P
a
per
|
Figure 2. Frequency of all N2O fluxes measured from all locations excluding those above
AMTD
7, 8125–8147, 2014Investigating uptake of N2O
N. J. Cowan et al.
Title Page
Abstract Introduction
Conclusions References
Tables Figures
◭ ◮
◭ ◮
Back Close
Full Screen / Esc
Printer-friendly Version
Interactive Discussion
Discussion
P
a
per
|
Discus
sion
P
a
per
|
Discussion
P
a
per
|
Discussion
P
a
per
|
Figure 3.Examples of 1 Hz N2O mixing ratio data recorded during 4 separate negative flux
AMTD
7, 8125–8147, 2014Investigating uptake of N2O
N. J. Cowan et al.
Title Page
Abstract Introduction
Conclusions References
Tables Figures
◭ ◮
◭ ◮
Back Close
Full Screen / Esc
Printer-friendly Version
Interactive Discussion
Discussion
P
a
per
|
Discus
sion
P
a
per
|
Discussion
P
a
per
|
Discussion
P
a
per
|
Figure 4.Multiple linear regression was carried out to correlate all N2O fluxes measured
be-low 10 µg N2O-N m−2
AMTD
7, 8125–8147, 2014Investigating uptake of N2O
N. J. Cowan et al.
Title Page
Abstract Introduction
Conclusions References
Tables Figures
◭ ◮
◭ ◮
Back Close
Full Screen / Esc
Printer-friendly Version
Interactive Discussion
Discussion
P
a
per
|
Discus
sion
P
a
per
|
Discussion
P
a
per
|
Discussion
P
a
per
|
Figure 5.The number of negative and positive fluxes measured from all InveN2Ory field sites