WalkNRide: Contextualising Feedback in Physical
Activity Trackers
Sérgio Manuel Nóbrega de Barros
Supervisor: Evangelos Karapanos, PhD
Co-Supervisor: Rúben Gouveia, MSc
i
ABSTRACT
Increasing levels of sedentarism and obesity, along with advances in sensor technologies have instigated a market for wearable activity trackers, electronic devices that sense users’ physical
activity levels with the goals of self-monitoring and behaviour change. Nowadays, activity trackers are one of the most desirable technologies, making up for a market of over $230 million in 2013. However, despite the spike of users’ interest, activity trackers have been shown to lose their appeal over time, with a recent survey suggesting that one out of three users discard the tracker in the course of the first six months of use.
The question we pose is: how can we design activity tracker so that users’ interests is sustained over the long term? Our design approach focuses on contextualising physical activity. We do this through sensing users’ locations and activities (such as being still, walking or commuting through a car, bus or other means) and thus providing innovative ways of presenting feedback on users. This thesis presents the design and evaluation of WalkNRide, a physical activity tracker for Google Android. Through a longitudinal field study of WalkNRide, we attempt to inquire into the factors that drive the adoption (or non-adoption) of the tool as well as the ways in which the use of the tool contributes towards habit formation.
iii
RESUMO
O aumento dos níveis de sedentarismo e obesidade, assim como os avanços em tecnologias de sensores têm motivado o recente interesse no desenvolvimento de wearable activity trackers, dispositivos electrónicos que detectam os níveis de actividade física dos utilizadores, que têm como objectivos providenciar uma maneira dos mesmos se monitorizarem a si próprios, assim como motivar uma mudança de comportamento. Hoje em dia, os activity trackers são uma das tecnologias que mais gera interesse, ocupando um mercado estimado acima de $230 milhões em 2013. Contudo, apesar do elevado interesse por parte dos utilizadores, os activity trackers
têm em comum o problema de que os utilizadores começam a perder o interesse pelos mesmos ao longo do tempo, com um inquérito recente a mostrar que um em cada três utilizadores descarta o dispositivo durante os primeiros seis meses de uso.
A questão que se põe é: como podemos desenvolver um activity tracker em que o interesse dos utilizadores se sustém por longo termo? A nossa abordagem foca-se em contextualizar a actividade física. Isto é conseguido recorrendo a sensores que detectam a localização e actividades dos utilizadores (como estando parados, a andar, ou num transporte como um carro, autocarro ou outros) e assim conseguindo formas inovadoras de apresentar feedback aos utilizadores.
Esta tese apresenta o desenvolvimento e avaliação de WalkNRide, um physical activity tracker
desenvolvido para o Google Android. Através da elaboração de um estudo à volta do WalkNRide, tentamos perceber os factores que levam à adopção (ou não adopção) da aplicação, assim como das formas em que o uso desta contribui para a formação de hábitos.
v
ACKNOWLEDGMENTS
I would like to thank my supervisors, Professor Evangelos Karapanos and Rúben Gouveia, for their great contribution, as well as advice and patience when giving feedback. The development of this dissertation was a long journey, and its results highly depended on them.
A very special thanks to my partner Diana for her support and encouragement during this period, which were a really precious help on motivating me to progress in this work with the same enthusiasm since the beginning. Another special thanks to my parents for helping me reach this far and for helping me succeed with my studies.
vii
TABLE OF CONTENTS
ABSTRACT ... i
RESUMO ... iii
ACKNOWLEDGMENTS ... v
LIST OF FIGURES ... ix
1. INTRODUCTION ... 1
1.1. Motivation ... 1
1.2. Activity tracking ... 2
1.2.1. How do activity trackers help towards behaviour change? ... 4
1.2.2. Decreasing users’ engagement over time ... 5
1.3. Objectives of this thesis ... 6
1.3.1. Can we prolong users’ engagement? ... 6
1.3.2. Understanding users’ engagement loops with activity trackers ... 6
1.4. Document structure ... 7
2. LITERATURE REVIEW ... 9
2.1. What are personal informatics systems? ... 9
2.2. Related work ... 9
2.3. Promotion of behaviour change ... 11
2.3.1. Behaviour change theories... 12
3. SYSTEM OVERVIEW ... 21
3.1. Motivation ... 21
3.1.1. Providing users with context ... 21
3.1.2. Giving feedback on users’ behaviours... 22
3.2. Description of WalkNRide ... 23
3.3. Feedback strategies ... 25
3.3.1. Goal completion ... 25
3.3.2. Messages ... 26
3.3.3. Activity ordering ... 29
3.3.4. Colours on locations ... 30
3.3.5. Current activity inference... 31
3.4. Activity detection algorithm ... 31
3.5. Prototyping ... 32
3.6. Architecture ... 36
viii
3.6.2. Communication with web server ... 37
3.6.3. Database ... 39
4. FIELD STUDY ... 41
4.1. Research questions and method ... 41
4.1.1. Study design and procedure ... 42
4.1.2. Participants ... 42
4.2. Findings ... 42
4.2.1. Usage sessions among conditions ... 43
4.2.2. User engagement over time ... 44
4.2.3. Physical activity over time ... 47
4.2.4. Feedback ... 48
5. DISCUSSION ... 49
5.1. Implications for design ... 49
6. CONCLUSION ... 51
6.1. Contributions ... 52
6.1.1. Use of context ... 52
6.1.2. Sedentarism tracking ... 52
6.1.3. Social features ... 52
6.2. Future work ... 52
REFERENCES ... 55
APPENDICES ... 59
ix
LIST OF FIGURES
Figure 1 - The Omron HJ-112 pedometer, used in Houston [18]. ... 3
Figure 2 - Fitbit, Jawbone Up and Nike+ Fuelband, from left to right, respectively. ... 3
Figure 3 - The course of the day on Moves application [22]. ... 4
Figure 4 - Bing Health & Fitness application [26] day summary. ... 5
Figure 5 - Ian Li’s [32] stage-based model of personal informatics. ... 10
Figure 6 - Fish’n’Steps [34] system components, which include: 1) Fish tank – the fish tank contains the virtual pets belong to the participant and his/her team members, 2) Virtual Pet – the participant’s own fish in a frontal view on the right side next to the fish tank, 3) Calculations and feedback – improvement, burned calories, progress bar, personal and team ranking, etc., 4) Chat windows for communicating with team members. ... 13
Figure 7 - UbiFit Garden’s [2] wallpaper example on a phone. ... 14
Figure 8 - Endomondo Sports Tracker [38], during a running activity. ... 14
Figure 9 - Shakra’s [40] interface; a and b show screens for examining relative and individual activity levels: compare Daily Activity and This Week’s Activity Images; c and d show two of the screens showing the estimated current activity level: Stationary and Walking. ... 16
Figure 10 - Fogg’s Behaviour Model (FBM) [44]... 17
Figure 11 - Breakaway’s [45] sculpture positions. ... 19
Figure 12 - Using context as a way to show where users are active, and also as a way to log users’ days. ... 21
Figure 13 - Moves’ approach to display context – using Foursquare venues. ... 22
Figure 14 - Example of a message that helps users understand their behaviours. In this case, as noted by the message, the user has been active. ... 22
Figure 15 –An example of WalkNRide’s interface. ... 24
Figure 16 - Goal completion in WalkNRide. ... 25
Figure 17 - Settings screen, where the user can set his daily goal, together with other settings. ... 26
Figure 18 - Message that tries to motivate users to walk while talking on the phone. ... 27
x
Figure 20 - An example of the just-in-time messages interface, situated on the centre of the
screen. In this case, the message is informing the user about his recent behaviours. ... 29
Figure 21 - Example of the descendant order on the activities list, ordered by the starting time of each activity. ... 30
Figure 22 - User’s sedentary behaviour at a location, which happens to be at home. ... 30
Figure 23 - Activity inference, which is displayed on the centre of the screen. ... 31
Figure 24 - WalkNRide's first version. ... 33
Figure 25 - Day view on the second version. ... 33
Figure 26 - Month view on walking goal achievement (first image), year view on walking goal achievement (second image), and week view on money saving goal achievement (third image). ... 34
Figure 27 - Message shown as an expansion of an activity. ... 35
Figure 28 - WalkNRide’s user interface. ... 35
Figure 29 - Abstract Architecture (Backing up data). ... 38
Figure 30 - Abstract Architecture (Registering e-mail)... 38
Figure 31 - Abstract Architecture (Asking for message-related data)... 39
Figure 32 - EER Diagram. ... 39
Figure 33 - Comparison between the 3 versions of the application (baseline, context and evolving). ... 42
Figure 34 - Number of weeks for which users used the application. ... 43
Figure 35 - Average amount of times the application was opened within the 4-week period. . 45
Figure 36 - Mean duration of engagement with the application. ... 46
Figure 37 - Contexts (namely current activity) in which users access the application, on the baseline, context and evolving conditions, respectively. ... 47
Figure 38 - Time of the day in which users access the application, on the baseline, context and evolving conditions, respectively. Morning (6am – 12pm), afternoon (12pm – 6pm), evening (6pm – 12am) and night (12am – 6am) were the times of the day considered. ... 47
1
1. INTRODUCTION
1.1. Motivation
Obesity is one of the most dominant problems in today’s society, resulting in one of the main catalysers of diseases such as type 2 diabetes and various cardiovascular diseases, which can lead to early death, especially in the case of children and adolescents [1]. It has also been shown that it may also aggravate symptoms such as depression and anxiety [2].
Another problem that obesity can also bring are the high costs associated to it: not only for the government and health organisations, but also for the person himself, who will, for example, deal with high costs for a health insurance. In fact, it is estimated that obesity costs more than 200 billion dollars a year to the U.S. government [3].
In Portugal, on the year of 1996, the direct costs of obesity were estimated as being 46.2 billion escudos [4] (just over 230 million euros). This corresponded to 3.5% of the total healthcare costs, with costs with drugs carrying the largest amount of expenses. However, the total healthcare costs were estimated at just below 400 million euros. Later on, on the year of 2002, the costs of obesity were estimated as being higher than in 1996 [5]: the total healthcare costs were estimated at just below 500 million euros, with direct costs counting for 59.8% of the total, and the indirect costs counting for 40.2% of the total healthcare costs for that year.
In 1994, Seidell and Deerenberg [6] estimated that, in The Netherlands, the healthcare costs associated with overweight and obesity (body mass index higher than 25kg/m2) were approximately 1 billion Dutch guilders, which corresponded to around 4% of the total healthcare costs in the country. In Australia, Segal et al. [7] estimated the cost associated with obesity (body mass index higher than 30kg/m2) for the year of 1989 – including costs for the management of obesity, non-insulin-dependent diabetes mellitus, gallstones, hypertension, coronary heart disease, breast cancer and colon cancer -, as being amounted to 394.7 million Australian dollars. In France, Lévy et al. [8] studied the direct costs related with obesity in that country, and concluded that these (with body mass index equal or higher than 27kg/m2) were around 11.89 French Francs, which represented 2% of the total expenses in healthcare. Hypertension represented 33% of those costs, and cancer 2.5%. Indirect costs were calculated in 0.6 billion French Francs. Moreover, these values were underestimated, since not all costs were included, due to the lack of information.
One of the main causes of these problems with obesity have to do with the lack of exercise and sedentary lifestyles. It has been studied that watching TV has a bad effect on people’s health [9], since food advertising leads to increased food intake (therefore, increased calories intake). Increasing levels of obesity seem to be occurring in parallel with the reduction of physical activity and increase of sedentarism [10], which was justified by the authors with the increase in the use of motorised transport and physically-inactive activities such as TV viewing and computer work. The World Health Organization mentions several examples of energy-saving activity patterns in modern societies [11]:
Transport: increases in car ownership;
2
At the workplace: mechanisation and robotics have reduced the need to expend energy;
Public places: lifts, escalators and automatic doors make people save time and energy; Sedentary pursuits: television viewing is responsible for a lot of inactivity, due to the
reasons stated above;
Urban residence: some urbanised areas of affluent countries are often dangerous for children, women and older people to go out alone or at night, and congested roads prevent children from playing on the streets.
But governments and health organisations are shifting their overall paradigm, which was based on curing, instead of preventing [12]. Common diseases are referred as having their roots in lifestyle, social factors and the environment, and that successful health promotion depends on a strategy of prevention [13]. Therefore, as one of the main causes of obesity relies on sedentary pursuits such as TV viewing, reducing children’s TV viewing and video game usage proved to be a very promising approach to prevent childhood obesity [14]. Khan et al. [15] have built some community strategies and measurements to prevent obesity in the United States, such as requiring physical education in schools, improving access to outdoor recreational facilities, enhancing infrastructure supporting bicycling and walking, locating schools within easy walking distance of residential areas, etc. Globally, organisations are also trying to tackle this problem with their employees, by preventing, and therefore reducing the costs associated with health problems from their workforce. For example, the University of Pittsburgh Medical Center (UPMC) has won several awards for its innovative programs, which promoted a healthy workplace [16]. As a result of these programs, UPMC’s total health care costs have dropped to 1.1%, while national and regional averages are near 7%; there has been a 38% reduction in tobacco use by employees (within 6 years); more than 9000 employees participated in a “weight race”, and lost a combined 16.5 tons over 12 weeks.
And normally, people have no access to information on how much they are sedentary, or how much do they normally walk at a given place. This is why we have been witnessing a boom of wearable devices, which is proven by the fact that 1 in 10 Americans own an activity tracker [17].
1.2. Activity tracking
3
Figure 1 - The Omron HJ-112 pedometer, used in Houston [18].
However, with the recent years’ development of more ubiquitous technologies and devices, other alternatives have arisen. These have the ability to track more details than just the users’ steps, like other wearable devices such as Fitbit [19], Jawbone Up [20] and Nike+ Fuelband [21] (all three displayed in Figure 2), or even other mobile applications such as Moves [22] (displayed in Figure 3). These other details normally include sleep tracking and users’ daily activities, which, in most cases, are classified into:
Idle - when the user is stopped somewhere; Walking;
Cycling;
In a vehicle - which can include buses, cars and trains;
Figure 2 - Fitbit, Jawbone Up and Nike+ Fuelband, from left to right, respectively.
4
Figure 3 - The course of the day on Moves application [22].
The accuracy of the details on our daily lives, present on Moves, highlight the amount of information that activity trackers are now able to monitor, due to the advances on ubiquitous technologies.
1.2.1. How do activity trackers help towards behaviour change?
People consider activity trackers important because they facilitate the collection of where they have been to, how much time they have spent in a place, how much they have walked, etc. A lot of users claim that they start using an activity tracker to optimise their fitness levels [17]. Nowadays, this is probably the usage that most people give to activity trackers, given the details present on these. And by having the possibility to go back and look into the course of the day, we are able to understand, for example, in which situations we walk the most – if after work, or in the evening when we go shopping, etc.
5
Figure 4 - Bing Health & Fitness application [26] day summary.
Bing Health & Fitness [26] (illustrated on Figure 4) is more focused on exercise than, for example, Moves. Therefore, the feedback given by the application will be more focused on motivating the user to exercise more, whereas Moves is more dedicated to recording our daily lives, being able to track the current context (such as locations). Bing Health & Fitness tries to motivate users to walk more by having:
Daily goal – together with a progress bar: it motivates the user to try and reach that mark every day;
Text-based message: it tries to motivate the user to walk more than he did on the previous day;
Daily statistics: make the user aware of his current state, and just by presenting users with the calories they have burned may have a positive effect on them;
1.2.2.
Decreasing users’ engagement
over time
Activity trackers have the goal of changing people’s behaviours (by improving them), which is already a difficult task, since people’s behaviours and routines are not easily changeable. Moreover, keeping users motivated after having used the system for a long time is an even harder task.
6
as they should (which may happen because of unplanned events, or because of an injury, etc.), they should not be punished, nor rewarded, but their interest should be sustained. Also, problems with the technology may occur: not giving the user proper credit for performing a healthy activity - for example, lifting weights, but using a system that does not have the necessary technology to acknowledge that - will make users upset; and giving users credit for something that they have not done is also something that makes users decrease their usage of the system over time. These are issues that are still difficult to solve with the technology existent nowadays, which is always prone to error. For example, data gathered from a device’s accelerometer and then translated into a physical activity requires a lot of study in order to create patterns, and these may not always be correct.
Ian Li’s vision [28] tackles another factor: the context. He mentions that activity trackers should take into account the context with which the user is involved, at every moment. For example, being able to count steps taking into account the user’s location should have a positive effect, since people have different patterns of sedentarism and physical activity at different places.
1.3. Objectives of this thesis
1.3.1. Can we prolong users’ engagement?
Given the already presented fact that users start losing their interest on activity trackers over time, one of the goals of this dissertation is to determine if we can prolong users’ engagement with activity trackers by enhancing users’ activity data with:
a) Contextual information: how will people react if they can understand how much physical activity they perform at different locations? Will this translate to more physical activity? What can context offer that numbers cannot alone? What are the benefits of contextual information in terms of awareness of one’s physical activity behaviours over time?
b) Actionable and evolving feedback strategies: does the presentation of inferences about users’ behaviours help them change their behaviours? And does the constant use of novelty on feedback motivate behaviour change? Additionally, how do different forms of feedback contribute towards prolonged engagement and behaviour changes?
1.3.2. Understanding users’ engagement loops with activity trackers
Our second goal is to develop a richer understanding of the micro-usages of activity trackers, more precisely, users’ engagement loops with these tools.
7
terms of how usage is characterised over prolonged interactions with these tools. Our main focus will be to understand if participants’ usage is characterised by micro-usages - short bursts of interaction with applications -, how time affects these and the reasons why participants engage, disengage and re-engage with these tools. This will possibly shed some light on how people adapt these tools in their life, and how time affects their usage of these tools. We will try to address questions such as: is the usage of activity trackers characterised by micro-usage/habit formation? How often (and for how long) do users engage with these applications? Why do they disengage?
1.4. Document structure
This chapter has introduced the problems with obesity and sedentary lifestyles we are trying to solve, and it has also provided some awareness about the basics of physical activity trackers. On the next chapter, entitled “Literature Review”, some actual activity trackers will be discussed, against some theories around the design of personal informatics systems - which will also be introduced – and, more specifically, some theories around the design for behaviour change. The third chapter is named “System Overview”, and this is where we will turn theories into functionalities, by introducing WalkNRide, which is a physical activity tracker, developed as an Android application. These functionalities, or, more specifically, feedback strategies, will be highlighted and discussed, focusing on the users’ point of view. Other implementation-related information will also be presented in this chapter.
In order to achieve the goals/objectives proposed in this first chapter, we conducted a field study, which will be introduced, together with our approaches to achieve each of those proposed goals. The results and findings will also be presented, always with the focus on these goals.
The fifth chapter, termed “Discussion”, will be used, as the name suggests, to discuss the results and findings of the previous chapter.
9
2. LITERATURE REVIEW
2.1. What are personal informatics systems?
We spend a lot of time searching and getting to know the world around us, but what about knowing more about ourselves and our daily lives? Self-knowledge can be achieved manually, by taking notes of everything that goes through our lives, like keeping track of what we eat every day. However, advances in technology allow us to use sensors that track almost everything, and to have access to loads of information gathered from the Internet, forming some conclusions about ourselves and our behaviours.
Systems that automate this process of tracking ourselves belong to a class of systems known as personal informatics [32], and can range from a lot of fields: since physical activity trackers, to finance trackers, etc. These systems help people collect relevant data about themselves, allowing them to self-reflect, and achieving what is called self-knowledge. This data would be really difficult for a human to track, since we cannot memorise everything that happened, and also because of our lack of ability to track everything that for example sensors can track.
2.2. Related work
HealthVault [33] is a website and a mobile application that helps people manage their health information. Users have a profile, which include information such as allergies, current medications/supplements, family history and emergency contacts, and it also allows users to manage factors such as their weight, height, blood pressure, cholesterol and exercise. Other services and applications such as Moves [22] and Fitbit [19] can be used as an extension of HealthVault, by tracking and adding exercise and activities performed to this system.
In terms of activity trackers, which are gradually being adopted by a lot of people over time [17], a wealth of research prototypes have been developed within HCI: Houston [18], Fish’n’Steps [34] and UbiFit Garden [2] are some examples that will be described on the next sub-chapter. But while significant advances have taken place within Human Computer Interaction with respect to the development of novel personal informatics systems, there has been limited conceptual advancement as to the kinds of questions that people ask when interacting with these systems. So, how can we induce behaviour change?
Ian Li [32] mentions a model with 5 stages (Figure 5) present on the use of personal informatics (which is composed by a description and the barriers for each stage):
Preparation: occurs before people start collecting information, deciding what information they will record, and how they will record it;
o Barriers: a barrier at this stage can be to determine what information to collect,
and which tool to use;
Collection: the collection of data through the observation of the actual context;
o Barriers: some problems may occur if the tool is not the correct one for what
10
Other problems like the lack of information or the use of subjective estimations may also represent a barrier to users;
Integration: this stage consists of transforming all the collected data into its final format, and may be a long process (for example, inserting annotated data into an Excel spreadsheet or even another software), or a short one (for example, what nowadays’ systems do - displaying the data in a “visible” format);
o Barriers: barriers at the integration stage consist on the difficulty of organising
data that comes from multiple inputs, and also when the integration takes a long time (forcing users to have a lot of work to do at this stage);
Reflection: happens when the user reflects on his personal information, which may consist of lists of collected information, or even exploring information visualizations. This may be a “short-term” or a “long-term” reflection. Short-term reflections are useful for making the user aware of his current status (for example, pedometers which show users the step count). Long-term reflections are useful for making users compare their personal information between different times, revealing patterns and trends (for example, devices that have no screen, forcing the user to check the information only after synchronising with the desktop software;
o Barriers: lack of time or difficulties retrieving, exploring or understanding
information are some of the barriers at this stage;
Action: this final stage is the stage when people choose what to do with their new understanding about themselves;
o Barriers: some systems encourage users to take action, but some do not, making
this a barrier to users, who will have some more difficulty on the understanding of their personal information.
11 These stages have 4 properties:
Cascading barriers: problems in earlier stages affect the later ones, so, systems have to be designed for all stages, not being focused on only one;
Iteration: users keep introducing new data, new tools and/or processes as they progress through the stages. Therefore, personal informatics systems have to be flexible, by supporting imports and exports of data to and from other systems, as well as supporting different kinds of information;
User-driven vs system-driven: each stage may be user-driven, system-driven, or a combination of both. User-driven stages are those where the user always has to do everything (for example, at the Integration stage, the user has to manually transcribe the collected information, so that it can then be reflected on, at the Reflection stage), and system-driven stages are those where the system takes the responsibility of performing the tasks for that stage (for example, at the Collection stage, the system may use sensors to collect the data);
Uni-faceted vs multi-faceted information: uni-faceted systems only show one facet of people’s lives (for example, a systemthat tracks users’ physical activity), while multi -faceted systems show various facets of people’s lives (for example, diabetes management systems may associate more than one parameter, such as blood sugar level and food consumption). Uni-faceted systems are simpler, however, only focus on a specific facet, while multi-faceted systems may be much more complicated (having to collect a lot of data), but offer a lot more meaning to people’s lives when the information of all facets can be merged together (instead of presenting information separately for each facet).
This model represents the stages of the use of (mainly) “manual” personal informatics systems, but it still helps on the design of “automatic” personal informatics systems, since almost all of these stages are also present on these systems, except from the preparation stage, which is mainly a user decision on which tool he should use for his goals. For example, the integration stage is one of the main stages on these automatic systems, since on the manual ones everything has to be dealt by a human, which, apart from tiring, can be prone to errors (which is actually another barrier on this stage). On automatic personal informatics systems, this integration is done with no effort from the user, and lots of inputs no longer face a problem to him. The properties of these stages are also important to personal informatics systems, like for example, the cascading barriers, since that if a user is facing difficulties on integrating the data, his reflections and actions will be affected, and this has a great impact, which may lead the user to abandon the system.
2.3. Promotion of behaviour change
12
et al’s [18] study participants also claimed that inclement weather conditions negatively affected their routines of physical activity.
A wealth of theoretically informed strategies to behaviour change exist. One of the most prominent strategies is self-monitoring. For instance, Seligman and Delay [36] did a study where they monitored the electricity usage of two groups of residential homes, on which both groups consumed the same amount of electricity. One of those groups was being given feedback for four times a week, while the other group was not. During the study, the group to whom was given feedback used 10.5% less electricity.
In the following sections we review some of the most prominent theories and their related design strategies.
2.3.1. Behaviour change theories
2.3.1.1. Goal-Setting Theory
The goal-setting theory has long been used on activity trackers, being now almost mandatorily part of these systems. This is because it has already been proven that the fact of having a step goal increased users’ likeliness to change their behaviour in terms of their physical activity [23]. Houston [18] was composed of two pieces of hardware: a wearable pedometer and a mobile phone (Nokia 6600). The phone application would provide users the ability to insert and view their step counts, to have a daily goal, add comments to a step count, share their results with others, etc. Compared to the existing systems nowadays, this was a very simple system. However, it already had a daily goal, which made a difference to the users, who would check it, and if the goal was far from achieved, some would have some unplanned physical activity, in order to meet their goal. Recognising users for meeting their goals certainly also helped for these behaviour changes.
13
Figure 6 - Fish’n’Steps [34] system components, which include: 1) Fish tank – the fish tank contains the virtual pets belong to the participant and his/her team members, 2) Virtual Pet –the participant’s own fish in a frontal view on the right side next to the fish tank, 3) Calculations and feedback – improvement, burned calories, progress bar,
personal and team ranking, etc., 4) Chat windows for communicating with team members.
2.3.1.2. Presentation of Self in Everyday Life
Goffman built a theory called Presentation of Self in Everyday Life [37], which is about people trying to make a good impression to others. The author describes this theory as someone performing at a stage, by also comparing the audience on that stage to those who observe the “actor’s” performance. For example, the actor can be used to refer to a person who is using a social network, and the audience as the people who follow him (i.e. his friends/followers on that social network).
Overall, people always try to show their best side to others. This theory has been widely used, given the existence of social networks, which are the best example within this theory. Nowadays, almost all activity trackers have social features, such as sharing users’ records and achievements. Normally, people would not want to share their negative achievements, so, systems shall allow users to have their own “backstage”. However, if this backstage strategy is not used, users may not like having their negative records showing up to everyone, and this may even lead to them abandoning the system.
14
Figure 7 - UbiFit Garden’s [2] wallpaper example on a phone.
The theory is well reflected on this system, since the wallpaper reflects the user’s behaviour, which may be seen by other people. However, this is not as likely to happen as in social networks, which have an even bigger importance here. As already stated, most activity trackers give users the ability to share their achievements on social networks. For example, Endomondo Sports Tracker [38] (Figure 8) is a mobile application that tracks a wide range of sports, from climbing to playing football, or even just walking.
15
Like many other activity trackers, Endomondo provides users with the ability to share their activities. For example, if the user has been playing cricket, he may want to share it with his friends. However, if his friends have been running long distances, and if he ran a lot less than them, he may decide not to share that run, leaving it at his “backstage”.
2.3.1.3. Transtheoretical Model of Behaviour Change
The Transtheoretical Model (TTM) of Behaviour Change [39] is a model that describes people’s motivation towards change. It argues that different stages occur in behaviour change, each requiring a different intervention strategy. Those stages are:
1. Precontemplation: no intention to take action within the next 6 months. Systems that target people at this stage should focus on educating, since those people are not well informed about the consequences of their behaviour;
2. Contemplation: intends to take action within the next 6 months. At this stage, systems should try to overcome these people’s barriers, and reward them when they have the correct behaviour;
3. Preparation: intends to take action within the next 30 days and has taken some behavioural steps in this direction. In preparation, systems should be even more focused on rewarding people for their good behaviour;
4. Action: changed overt behaviour for less than 6 months. Systems here should focus on tracking people’s progress, to help them maintain consistency;
5. Maintenance: changed overt behaviour for more than 6 months. In maintenance, systems should try to find strategies to solve each person’s previous problems, and keeping them motivated, since people might still suffer a relapse;
6. Termination: no temptation to relapse and 100% confidence.
Activity trackers should be available to be used by any person in any of these stages. Therefore, these systems have to be designed for every stage, with the same focus for each one. People that do not have an intention to take action will have to be informed about the consequences of their behaviour, as well as people who have already changed their behaviour and have no temptation to relapse have to be motivated to keep going.
16
Figure 9 - Shakra’s [40] interface; a and b show screens for examining relative and individual activity levels: compare Daily Activity and This Week’s Activity Images; c and d show two of the screens showing the estimated current
activity level: Stationary and Walking.
2.3.1.4. Theory of Cognitive Dissonance
The Theory of Cognitive Dissonance [41] happens when a person believes their attitudes and behaviours are inconsistent. Depending on how important their beliefs or behaviours are, the user will feel motivated to change his behaviour or knowledge, to reduce the importance of that matter to him, or even to avoid information or situations that cause the dissonance. For example:
Change behaviour: start exercising more;
Change knowledge: stop believing that the lack of exercise is bad for his health;
Reduce the importance: start eating healthier;
Avoid information or situations that cause the dissonance: not listening to people’s advices on how the lack of exercise is bad for his health.
This theory informs us that, in order to change a person’s behaviour (which is what is intended), the implications of not changing it have to be really stressed, in order to pass the message to that person, and to motivate that behaviour change. Comparing this theory with the stages on the Transtheoretical Model of Behaviour Change, we see it is more focused on the Precontemplation stage, since it tries to educate people on having a positive behaviour, so that positive behaviour changes may occur.
UbiFit Garden [2] implements the Theory of Cognitive Dissonance in its design, since it alerts people when “their garden” is not as nice looking as it should be. This motivates people to change their behaviour, starting to walk more than they have, recently.
2.3.1.5. Social Cognitive Theory
17
Therefore, people have to feel good about having a positive behaviour, which, in terms of activity trackers, is about feeling good about exercising.
Shakra [40] was mostly designed using the Social Cognitive Theory, since it only informs users about their activity, not focusing on rewarding them with points or badges. This way, people who change their behaviour, change it by themselves, which is called self-reflectiveness [42].
2.3.1.6. Fogg’s Behaviour Model
Fogg’s Behaviour Model (FBM) [44] suggests that behaviour change happens when all three factors are present: motivation, ability, and triggers.
Figure 10 - Fogg’s Behaviour Model (FBM) [44].
This model, presented on the previous figure, is a conceptual one, so, units are not present. The star (target behaviour) is placed on the circumstances where behaviour change is highly likely – high motivation and high ability. The trigger is placed close to the target, suggesting that there has to be a trigger for the target behaviour to take place. Subcomponents/factors are also suggested to achieve the desired behaviour. For example, to achieve high motivation, factors such as pleasure, hope and acceptance have to be present. To achieve high ability, time, money and physical effort are normally involved.
18
2.3.1.7. Consolvo’s Design Strategies for Lifestyle Behaviour Change Technologies
Consolvo’s Design Strategies [27] were based on four design goals established by Breakaway [45], an ambient display that encourages people to take breaks more often. These four design goals were [45]:
Abstract: We wanted to use data abstraction, rather than raw sensor data collected from the user, to display information to encourage people to be more active, and to draw attention to the harm that is done to the body by sitting for long stretches of time; Non-intrusive: We wanted to present data in an non-obtrusive manner and to make it
available at all times during the work day without interrupting work;
Public: We wanted to present data in a way that people would willingly display it in a public place like the office. We needed to present the data, which is personal by nature, in a way that is appropriate to be presented in a public environment;
Aesthetic: Since the display would function as a personal object within the office space, it would need to be inquisitive and sustaining interest over time.
These goals were specific to the Breakaway Project, therefore, Consolvo transformed these goals into general design strategies, plus, adding four other [27]:
Abstract & Reflective: Use data abstraction, rather than raw or explicit data collected from the user and any technologies, to display information to encourage the user to reflect on his/her behaviors by showing the user what s/he has done and how those behaviors relate to his/her goal;
Unobtrusive: Present and collect data in an unobtrusive manner, and make it available when and where the user needs it, without unnecessarily interrupting his/her everyday life or calling attention to him/her;
Public: Present and collect the data, which is personal in nature, such that the user is comfortable in the event that others may intentionally or otherwise become aware of it. Because the data needs to be available whenever and wherever the user needs it, it is likely to be something that s/he wears/carries, resides in a shared/common space, or uses while in the presence of others. The technology should not make the user uncomfortable in those situations;
Aesthetic: If the display and any accompanying devices function as a personal object(s) that may be used over time, they need to be inquisitive and sustain interest. The physical and virtual aspects of the technology must be comfortable and attractive to support the user’s personal style;
Positive: Use positive reinforcement to encourage change. Reward the user for performing the desired behavior and attaining his/her goal. When the desired behavior is not performed, the user should not receive a reward nor a punishment, but his/her interest should be sustained;
Controllable: When appropriate, permit the user to add to, edit, delete, and otherwise manipulate data so that it reflects the behaviors that s/he deems suitable. The user should be in control of who has access to what aspects of his/her data;
19
Comprehensive: Account for the range of behaviors that contribute to the user’s desired lifestyle; do not artificially limit data collection and representation to the specific behaviors that the technology can sense or monitor.
The best example of a system that uses most of these strategies is certainly the Breakaway Project [45], since these were based on its goals. As already stated, Breakaway is an ambient display that helps people whose jobs require them to be sitting for long periods of time, to take breaks more frequently. Therefore, sensors that detect whether the person is sit on the chair or not, are placed on the chair. After being sit for one hour, the sculpture moves to its first slouching pose. Then, the more time the person remains sit, the sculpture keeps moving to more slouching poses. But after ten minutes absence from the chair, the sculpture moves to its upright position. These positions are reflected on Figure 11.
Figure 11 - Breakaway’s [45] sculpture positions.
21
3. SYSTEM OVERVIEW
3.1. Motivation
Our first research question is: can we design an activity tracker so that it prolongs users’ engagement with it? The application developed (which will be detailed on the next sub-chapters) will try to achieve that goal by providing users with context, and giving feedback on users’ behaviours.
3.1.1. Providing users with context
Providing context makes an application more dynamic, motivating its use, and, we believe, consists in one of the ways to avoid users dropping their motivation about using an activity tracker over time. Li et al. also share this vision [28], and, in the case of activity trackers, by tracking the location, for example, we believe that people can have a better view of the places where they exercise the most.
By taking the information above into account, users’ visited locations (Figure 12) will be added to the basic information already present on activity trackers, like the distance walked, goal achievement status, etc. This will turn the system into a multi-faceted one (suggested by Li’s model [32] as having a greater impact on users), which will, in other words, retrieve more than one type of data from the user’s behaviour.
Figure 12 - Using context as a way to show where users are active, and also as a way to log users’ days.
By providing users with a way to view where they have been, together with how active they are at each place, we believe that this will lead to a better understanding of their activity lifestyle around the places they have visited, and also about their life in general. This can be seen as a way to track physical activity, and also as a lifelogging application, which adds a lot more information to the physical activity detected.
22
Moves [22] has been successful in using context, by also allowing users to choose from a range of Foursquare venues near them – illustrated on the next figure.
Figure 13 - Moves’ approach to display context – using Foursquare venues.
However, Moves’ approach has a small, but, from what we believe, important difference: it does not tell users how active/sedentary they are at different locations. By using colours, we can give more feedback to users, which will be discussed on the next sub-chapter.
3.1.2. Giving feedback on users’ behaviours
Users’ behaviours will be analysed, and feedback will be given, in a way to motivate behaviour change (by improving it), or trying to keep users motivated when they are performing well. The discussion on the previous chapter consisted on informing users about how active/sedentary they are at a given location. Moves’ approach does not tackle this very important factor, given the fact that obesity seems to be growing in parallel to sedentarism [10]. This is important because activity trackers have the goal to tackle obesity, and by not tackling sedentarism, they are losing “one branch of the tree” of obesity’s leading behaviours.
The small row shown in Figure 12 (and also given the size of a smartphone’s screen) cannot have more information than it already has. But this problem was tackled with the use of colours, not crowding the smartphone screen with information. The colours used, colour codes and other information will be discussed on the next chapters.
Another type of feedback that will be given will be by using messages (example shown in Figure 14). These messages will help users understand their behaviours, and some will also suggest changes that can be made, as a way to improve their behaviours.
23
Other approaches have been taken into showing messages to users, such as Health Mashup [46], which collects a wide range of health and wellness data. When correlations are found within the data, messages are presented to the user, which explain these correlations in an everyday language. For example: “You walk 80% further on weekends vs. weekdays (1500 vs. 8300 steps)” [46].
Jawbone Up [20] also presents textual feedback, trying to make more sense of the data that is gathered from the user. For example: “You got from 500,000 steps to 1 Million steps in 56 days averaging 9,259 steps per day along the way. (…)” [20].
Houston [18] used simple textual messages, informing the user about how many steps did he miss until his daily goal, while entering his step count. A congratulations message was also shown when the goal was met.
The main advantages of this type of feedback [47] are:
Providing users with information that would not have been discovered: machine learning algorithms, or even just algorithms that check correlations have the power to detect correlations and patterns that would be difficult to spot in the point of view of a user. This type of feedback allows applications to provide user-friendly information to users about these patterns, and also the possibility of providing suggestions for behaviour change;
Overcome the problem of monitoring to users with low-numeracy: manual self-monitoring sometimes requires users to do some calculations and involves a lot of work, and applications which have this ability of providing feedback from users patterns are a great help, since users do not have to do any calculations or have any work with gathering or integrating multiple sources of data;
Make changes in the detected activity more salient: increases or decreases in activity within a day or a week are not always spotted by users, and messages have the power to provide this information, by warning the user that he is getting behind, or even congratulating him if he is doing better.
The presentation of feedback as textual messages is relatively recent, so, limitations and disadvantages are not yet well known. Consolvo et al. [47] mention framing, frequency, length and how uncertainty is presented as properties that may affect the effectiveness of textual feedback.
3.2. Description of WalkNRide
WalkNRide (illustrated in Figure 15) is a mobile application developed for Android, as an activity tracking application, with a focus on trying to encourage users to walk more and sit for less time, by having a personal and detailed approach. It tracks users’ everyday activities, including:
Idle; Walking;
24
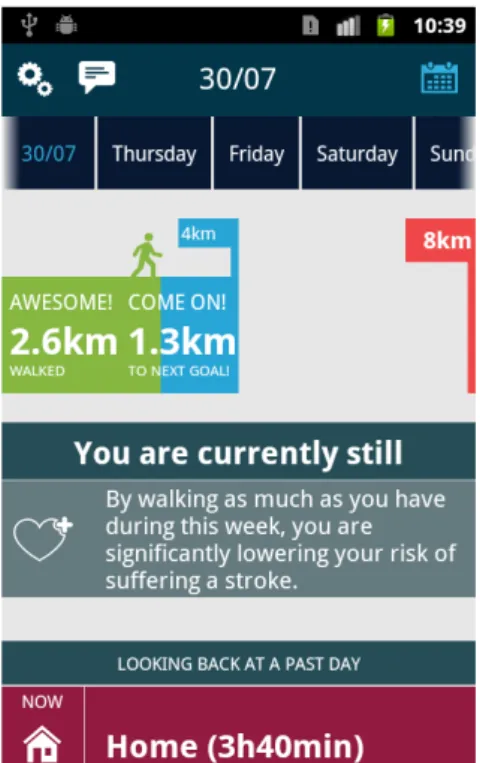
Figure 15 – An example of WalkNRide’s interface.
Each activity is represented by a row, with the activities within a location being always filled with red, orange or green. These colours tell the user how sedentary he is being at the moment, at that given place, and they change whether the user has been walking (which can be subtended as a break) on the last hour or not. These walking activities, if inside that same location, are not displayed as a separate row, but are hidden “inside” the location/idle activity row, being part of that same row. The name of each place is picked from the Foursquare venues existent nearby, with the exception of “Home” and “Work”, which are there by default from WalkNRide.
The application is also powered by a (software) pedometer, which is a precious help to tell the user how much he has walked. The user’s covered distance is calculated taking into account his genre, height, and of course the steps he took. “In vehicle” distances were not as straightforward to calculate as the walking ones, since the accelerometer would not give us all the information we needed, so, the distance is calculated taking into account the user’s previous and next location, and also how much he walked between those two locations (which is subtracted from the total distance between those locations).
25 Facts;
Low-level feedback; High-level feedback.
The facts are simple messages that advise the user, but do not take his data into account; low-level feedback messages use the user’s data, and provide him with an advice, while high-level feedback messages provide him with a curiosity, also taking into account his data.
WalkNRide does not have any traditional way of sharing data, but it still has a social focus, which is believed to be developed in an innovative way. The messages provide users with data from other users, both in a broader, and also in a direct way. The broader way is when the application provides users with messages that compare the user’s locality (or city, or even country), with other users’locations. For example: it can compare how much people from a user’s city walk, with people from the other user’s city. The direct way happens when, for example, the user has been to a place, and it tells the user that he is the second most active person at that place, just behind “John”. We believe this introduces an interesting way of competing with others, both knowing, or not knowing that person in question.
3.3. Feedback strategies
3.3.1. Goal completion
This strategy, as already stated, is already part of all activity trackers, given its importance [23]. Therefore, it had to be implemented in WalkNRide. An example follows in Figure 16.
Figure 16 - Goal completion in WalkNRide.
The design of this goal completion was focused on trying to motivate users to reach it, obviously, but it did not only consist on a single goal. Our strategy to motivate users was to divide their goal into 4 “mini goals”. On this example, the user’s goal is 8km and he has walked a bit more than 1 km. By dividing the 8km into 4 sub-goals, we know that we will have the sub-goals 2km, 4km, 6km and 8km (which is the only one that was defined by the user: the final goal). This way, we can motivate users to reach their sub-goals, so that they can reach their final goal with less effort. This can also be seen as a strategy of divide and conquer.
26
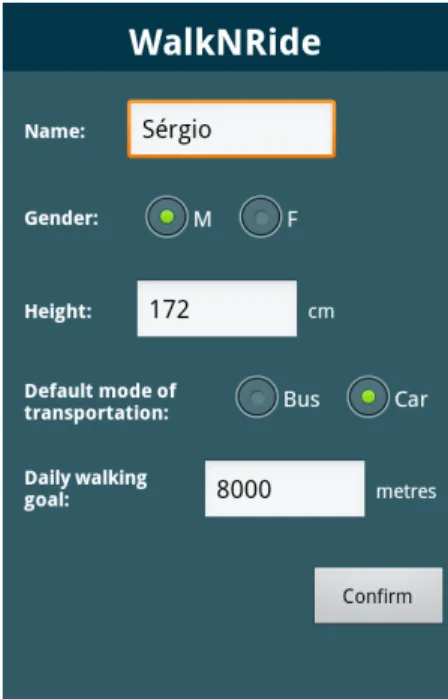
Figure 17 - Settings screen, where the user can set his daily goal, together with other settings.
3.3.2. Messages
The feedback messages were built with the primary goals of motivating a positive behaviour change in users and prolonging their usage of WalkNRide. As a secondary goal, feedback messages would provide users with some information about their own day-to-day behaviours, as a way to reach self-knowledge.
There is a total of 91 distinct textual feedback messages. Of these, 28 (31%) are shown on the “Idle” activity (within a location), 22 (24%) belong to the “Walking” activity, 15 (16%) to the “In a vehicle” activities, and 26 (29%) exclusively to the messages shown within the application itself (52 if we account for repetitions) – not referring to any activity in particular -, which we called “just-in-time”, since most of them are in a form of advice given to the user at the time that he can listen to that advice and take an action.
The messages were categorised using a traditional affinity diagram technique. Overall, as already stated, 3 groups were identified:
Facts: these are composed by factual information related to each category and presented to users independently of their performance/use of the application, i.e. they are not data-driven (e.g. “Simple movements such as fidgeting, which includes knee shaking or pen tapping can burn up to 3,600 calories per day.”);
Low-level feedback: these provide explicit recommendations about how to change or improve specific behaviours based on users’ performance (e.g. “You have been sitting for 45 minutes, try taking breaks every 30 minutes.”);
27
Two researchers independently mapped all messages into the three previous categories (the summary of this categorisation can be seen in Table 1). Iterator agreement was almost perfect (Cohen’s K=0.84). Cases of disagreement were resolved jointly by both researchers. Results of this categorisation can be found in Appendix A.
Facts Low-level High-level TOTAL
Idle
10
8
10
28Walking
12
5
5
22In a vehicle
7
4
4
15Just in time (exclusive)
0
13
13
26Just in time (total)
17
18
17
52Table 1 – summary of messages categorisation.
At each interface responsible to show the messages –both at the “just-in-time” and at the level of each activity – a maximum of three messages are displayed, one for each category. If there are not messages to be displayed in one of the categories (for example when the user is just starting to use the application, there is not any data to be analysed), only the messages applicable to the other two categories are showed. At least one message is always displayed, which belongs to the facts, since these do not take into account users’ data, and can be shown even if the user is just starting to use WalkNRide. These messages can be accessed through swipes to the left or right.
The idea of having these feedback messages as a way to prolong the usage of WalkNRide was to always have different messages popping up to the user. This way, users would not always be seeing the same messages, which would, in theory, make them always want to see new messages. This was achieved by showing the messages that the user had seen less times (or had not seen at all), but still following the strategy of showing a message for each category. This could even be improved if different messages could be created within the web service (detailed on chapter 3.6), and shown on each user’s application, but this strategy was not followed. As already stated, these messages were also built to help bring positive behaviour changes to users, and this was achieved through each message content. For example, WalkNRide has access to users’ calls, and, by having that information, together with the user’s activity during each call, we could build a message that would congratulate the user if he had been walking during his last call, or, giving him the advice to try and walk while talking on the phone if he had not been (Figure 18) – this, we believe, would motivate a positive behaviour change to users, since this is normally a small change to a person’s behaviour, and can end up being a very healthy one, especially on long calls.
28
WalkNRide’s social feature – which is achieved through these messages – was also believed to motivate positive behaviour changes, since it compares different localities, cities and countries, as well as different people. There was the assumption that if we compare, for example, the activity in the user’s locality with the activity in another locality (where WalkNRide is present with at least one user), each of these users will try to make their locality the leader on the ranking. The same was believed to happen when comparing different people: if the user is within, for example, a university, and if there is another WalkNRide user in that same university (both would have to have “checked-in” there before, but do not have to be there at the same time), we believed that, by comparing these two people’s activity, just by informing each one the other’s nickname (which is defined by each user), even if they do not know each other, this would start a competition between them, motivating a positive behaviour change in each one of them. And the more the people within a given venue, the better the competition would get, since each user’s activity would be ranked, and compared with the person on the position below or above on the ranking.
It should also be noted that these messages respect users at different stages (as seen on the Transtheoretical Model of Behaviour Change [39]), by trying to motivate behaviour change, and also by motivating those who have changed their behaviour (Figure 19).
Figure 19 – Congratulating a user about his behaviour. In this case, at a given place, where he was active.
3.3.2.1. Just-in-time messages
29
Figure 20 - An example of the just-in-time messages interface, situated on the centre of the screen. In this case, the message is informing the user about his recent behaviours.
3.3.3. Activity ordering
The ordering of the activity rows was designed to be in a descendant way, instead of ascendant, in terms of time. It was decided to be designed in this way since the focus is on the current activity (the last one performed), and not the one on the beginning of the day. If an ascendant order was followed, users would always see the first activity of the day on the beginning of the list, which would not bring anything new, and several application consultations would always show the same activities – starting from the beginning of the day -, forcing the user to scroll down the list of activities just to check his last activity/activities.
30
Figure 21 - Example of the descendant order on the activities list, ordered by the starting time of each activity.
3.3.4. Colours on locations
Each activity row within a location (walking or idle) is not represented separately, but instead, is treated as being part of that same location, therefore, only one row represents all those activities. Besides helping with context, it prevents the user from seeing a lot of activities within the same location, which we believe only makes sense if together in one row. This is possible since the application recognises walking activities inside a location, which happens if the user’s phone is always connected to the same Wi-Fi hotspot, or if he is within 100 metres of that location (no matter how the location is gathered – GPS, Wi-Fi or by using mobile data). The colours used were red, orange and green, and they change whether the user has been taking breaks or not. For example: if the user is stopped at a place, for more than 1 hour, the row will be red (Figure 22). However, if he starts to walk, the row turns into green, telling him that he is doing great, since he is taking a break (Figure 19). But after he is stopped again for more than half an hour, the row turns orange, before going red again, after 1 hour idle. We think that by using these colour codes, the user is aware of the places he is most sedentary at, so, if he wants to walk, why not go to the shopping centre, where he always has a green row? Again, this strategy was used to promote a positive behaviour change.
31
3.3.5. Current activity inference
It was also decided to include on the app a small row with textual feedback about the user’s current detected activity (Figure 23). For example, “You are currently walking”. This supports seamfulness and informs the user about the correctness of the activity inference.
Figure 23 - Activity inference, which is displayed on the centre of the screen.
3.4. Activity detection algorithm
An API and an algorithm were used to detect users’ activities:
An activity detection API, developed by Google, for Android [48, 49];
An algorithm included in an open source pedometer application for Android [50]; The activity detection API sends updates about the current activity to WalkNRide (around every 30 seconds), and the information provided is a list of the most probable activities, taking into account the patterns of movement on the accelerometer. This list not only contains the types of activities themselves, but also the confidence that that activity is the correct one. Therefore, the most probable activity is easily gathered, by going through the list and selecting the one that has a greater confidence. In this case, only most probable activities with confidence higher than 50% are considered.
Each activity row was created with the feedback from the activity detection API. But there was a problem: too many “Idle” activities were being detected. For example, when walking through stores on the street, if the user would sometimes stop just to take a look at the storefronts, a lot of “Idle” activities were created, as well as “Walking”, since the walk had been interrupted, and then started again. Therefore, it was decided that “Idle” activities were only going to be created as long as the user had been stopped for 10 minutes, with consecutive “Idle” activities detections. This way, the daily lists of activities were drastically shortened, and were now more meaningful to the user.
Since we had access to a pedometer, running in parallel, and also because the activity detection was not immediate, walking activities were not always detected, if performed by just a few seconds, or just a few steps. Therefore, we tried using the pedometer to quicker detect walking activities. It consisted on detecting 10 steps in less than 10 seconds, and if this was achieved, a walking row was created. At first, it was seen as a great improvement, since walking activities were now detected much faster. But we then realised it was prone to errors, such as when using a phone with a very sensitive accelerometer, and being on a sloppy road, causing the accelerometer to move a lot, and the algorithm to detect inexistent steps. Therefore, the activity detection algorithm was kept as the primary one, as it was on the beginning.
32
an “Idle” row was used for this problem as well (but not the time variable), causing “In vehicle” activities to be detected within 1 minute of consecutive “In vehicle” detections. This also improved vehicle detections, lowering the case of “false alarms”.
But then, when going to, for example, a shopping centre, it is expected that people walk a lot, and not to be stopped for 10 minutes consecutively, so, only walking activities would be detected, even if the user had been there for a long time. The solution was to rely not only on the activity detection API, but also on the location capabilities of the phone. Therefore, when the user spent 10 minutes (purposely similar to detecting “Idle” activities) within 100 metres, or if always connected to the same Wi-Fi hotspot, an “Idle” activity would be created, with his current location. This allowed locations like shopping centres or other places where we do not usually stop, but stay there for some time, to be detected as a location, not only relying on the fact that the user will be stopped for 10 minutes at that given place.
However, the algorithm had to be dynamic, to fit bigger spaces like airports as well, and those 100 metres were not flexible or dynamic, and there was not another way to detect the size of certain spaces. Therefore, we gave that task to the user: if he spent some time in a part of the airport, but then walked for more than 100 metres away from that place (but still in the airport), the location would be detected as another one. But if the user repeated the process of registering that location as the airport as well, the range of detected places as being the airport would increase, accepting locations within 100 metres of his first location, and also within 100 metres of his second location. This, we believe, was a dynamic way of tackling this problem, giving the user the chance to correct his location.
The algorithm was finished, but there was still another issue: the battery usage. The application was draining the phones’ batteries, and the solution was simple: not to run the 2 algorithms in parallel. The pedometer was not being used, but was still running in parallel, so, we made the decision to only start it when a walking activity was being detected, so that information about steps taken would be retrieved from it.
3.5. Prototyping
33
Figure 24 - WalkNRide's first version.
The images also show the text “This week”, “This month” and “This year”, since there was also the idea that the day view (“Today” or previous days –for example: “Thursday”), would show users’ goal achievement and activities for that day (what is shown on the first 2 images), and that the other views (week, month and year view), would show messages summarising the days within that week/month/year.
The next iteration already brought the general aesthetics of the final version of the application (Figure 25) – except for some details -, and also maintained the ideas of the previous one, not present on the final version –money saving’s goal achievement and week/month/year views.
34
However, these week, month and year views were changed, and now there was a custom view (Figure 26), instead of just showing messages summarising those days.
Figure 26 - Month view on walking goal achievement (first image), year view on walking goal achievement (second image), and week view on money saving goal achievement (third image).
It is also worth noting that, as these were previous weeks, months and years, the goal achievement could not be changed, so, instead of having the “Keep it up” blue bar, the remaining distance (and money, in the case of this version) was filled with red, informing the user of how much he missed to reach his goal.
Another factor worth noting is the goal calculation for these views. There was only the possibility to choose the goal (walking and money saving) for each day, therefore, the goal for the year view, for instance, would be the sum of all the goals for each day within that year.

![Figure 3 - The course of the day on Moves application [22].](https://thumb-eu.123doks.com/thumbv2/123dok_br/15660984.622181/17.892.339.554.102.523/figure-course-day-moves-application.webp)
![Figure 4 - Bing Health & Fitness application [26] day summary.](https://thumb-eu.123doks.com/thumbv2/123dok_br/15660984.622181/18.892.309.583.101.549/figure-bing-health-amp-fitness-application-day-summary.webp)
![Figure 5 - Ian Li’s [32] stage-based model of personal informatics.](https://thumb-eu.123doks.com/thumbv2/123dok_br/15660984.622181/23.892.138.769.745.1047/figure-ian-li-stage-based-model-personal-informatics.webp)
![Figure 6 - Fish’n’Steps [34] system components, which include: 1) Fish tank – the fish tank contains the virtual pets belong to the participant and his/her team members, 2) Virtual Pet – the participant’s own fish in a frontal view on the right side](https://thumb-eu.123doks.com/thumbv2/123dok_br/15660984.622181/26.892.134.772.107.359/figure-components-include-contains-virtual-participant-virtual-participant.webp)
![Figure 9 - Shakra’s [40] interface; a and b show screens for examining relative and individual activity levels: compare Daily Activity and This Week’s Activity Images; c and d show two of the screens showing the estimated current](https://thumb-eu.123doks.com/thumbv2/123dok_br/15660984.622181/29.892.127.765.103.321/interface-examining-relative-individual-activity-activity-activity-estimated.webp)
![Figure 10 - Fogg’s Behaviour Model (FBM) [44].](https://thumb-eu.123doks.com/thumbv2/123dok_br/15660984.622181/30.892.182.711.403.790/figure-fogg-s-behaviour-model-fbm.webp)