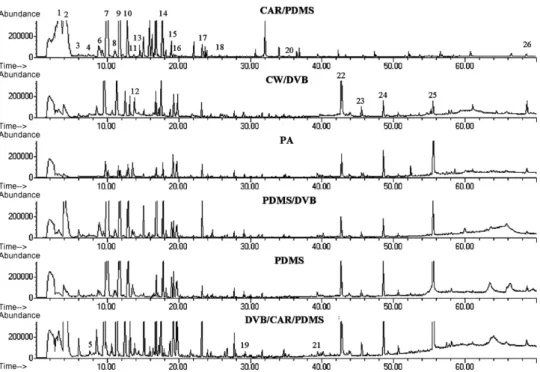
Comparative analysis of the volatile fraction from Annona cherimola Mill. cultivars by solid-phase microextraction and gas chromatography–quadrupole mass spectrometry detection
Texto
Imagem


Documentos relacionados
De acordo com o terceiro objetivo de investigação, que passa por comparar os resultados obtidos num questionário, sobre a relação de compromisso entre os consumidores e as
Analysis by Gas Chromatography and Gas Chromatography/Mass Spectrometry of the essential oils obtained from leaves of Echinodorus grandiflorus (“Chapéu de couro”) from two
The objective of this study is to evaluate the chemical composition of volatile compounds in sonication extracts of fruits and leaves of Morinda citrifolia Linn., looking
The volatile compounds emitted by phloem samples of pines were extracted by headspace solid-phase micro extraction, using a 2 cm 50/30 mm
A distortion of an artistic object might, on the other hand, be present in marketing and publicity in a broader sense, in which brands that intend to associate with street art
Sendo assim, trabalhar com este grupo exigiu planificações mais elaboradas em termos de pormenores na forma de propor as atividades, maior número de passos para cada
Approximately seventy volatile compounds were identified in the these samples, pertaining at several chemical groups, mainly fatty acids ethyl esters, higher alcohols, fatty
Total concentration of the main chemical classes of volatile compounds (HA: higher alcohols; EE: ethyl esters; FA: fatty acids; CC: carbonyl compounds) determined in TNM red wines
