UPGRADING OF THE MODEL TO DETERMINE THE
ECONOMIC AND FINANCIAL FEASIBILITY OF A
HOTEL
Beatriz Serrano Gião Silveira Neves
20231
A project carried out on the Master in Management Program, under the supervision
of:
Professor Sonia Dahab
2
Index
Key concepts in the hospitality industry ... 3
Abstract ... 4
Introduction ... 5
Characterization of the hospitality industry ... 5
Hospitality industry in Portugal ... 7
Blue Shift ... 9
Goal of the Work Project ... 11
Upgrading of the model to determine the economic and financial feasibility of a hotel ... 12
Basic variables of the model and their relationship ... 12
Contractual relationship in the hospitality industry ... 14
Financial Analysis ... 15
Benchmarking ... 16
Main aspects of the model ... 19
Comparison between the upgraded model and the initial ... 21
Conclusion ... 24
3
K
ey concepts in the hospitality industry
Online Travel Agency (OTA) – a website used to book accommodation or, just to read the reviews of hotels that other users share. Examples of OTA´s are Booking, Expedia,
Trivago, among others.
Occupation rate – ratio between the number of rooms occupied and the number of rooms available.
MI – Meetings, Incentives
Average Daily Rate (ADR) – the average rental income per occupied room in a given
time period.
Revenue per Available Room (RevPAR) – average revenue generated by each available room.
Guest Capture Rate – number of guests that use some services of the hotel. Considering the F&B area, the guest capture rate is the number of guests that eat in the hotel.
Considering the other areas, is the number of guests that use this specific services, such as
Spa, Gymnasium.
Outlet - areas of the hotel where food and beverages are sold to both in-house and outside guests.
Full-time Equivalent (FTE) - the number of hours worked by one employee on a full-time basis.
4
Abstract
This work project encompasses the upgrading of an already existing model to determine a hotel´s
economic and financial feasibility, by adding some figures that give more information to the
hotel managers and, therefore, can guide them in their strategic decisions. This upgrading was
conducted to adapt the model to the changes that are going on in the hospitality industry such as,
the growing importance of digital technology, that is changing the balance of power towards the
consumer side and the change in the consumer behaviours and expectations since the new
generations value more the local experiences and plan their trips using online sources.
The model will be based in the principles of the Uniform System of Accounts to the Lodging
Industry (USALI), published by the American Hotel Lodging Educational Institute. The first
edition was published in 1926 with the objective of enable the hotels to recording, classifying and
publishing the hotel´s internal results in a format that is equal among all hotels in the world. This
will allow the results to be compared worldwide and, also, contribute to the creation of reliable
indicators in the industry, crucial for all players in this market. USALI was the first successful
accounting system and, nowadays, is the most accepted worldwide.
5
Introduction
Characterization of the hospitality industry
Tourism is not easy to define since its definition can vary from source to source and there is no
consensus. According to United Nations World Tourism Organization (UNWTO), “Tourism
comprises the activities of persons travelling to and staying in places outside their usual
environment for not more than one consecutive year of leisure, business and other purposes not
related to the exercise of any activity remunerated from within the place visited”.
Tourism can be divided into four categories: international tourism, internal tourism, domestic
tourism and national tourism. International tourism can be divided into two sub-categories,
inbound, travel of foreign citizens to a different country, outbound, travel of national citizens
from one country to the other. Internal tourism consists on travel to a country by both citizens and
non-citizens. Domestic tourism is travels of citizens within their own country. National tourism is
a combination of outbound and internal tourism.
Accommodation is considered to be part of the tourism product and there are several forms of
housing such as hotels, guesthouses, bed and breakfast, self-catering apartments, camping and
caravan sites, campus accommodation, house swapping, time sharing, cruise lines and, finally,
visiting friends and relatives. Hotels are considered to be the most common type of
accommodation.
According to the definition of “Instituto Nacional de Estatística”, hotel is an establishment that
occupy a building or just an independent part of it with exclusive access to the clients to which it
supplies services of temporary lodging and others, such as restaurant. This establishment should
have, at least, 10 rooms.
The classification of hotels can be based on different criteria and there are several entities who
are responsible for it. Hotels can be classified on the basis of size, star, location, guests,
ownership, and level of services. The classification based on size includes four categories, small
(with 25 rooms or less), medium (with 26 to 100 rooms), large (101 to 300 rooms) and very large
(more than 300 rooms). The classification based on stars varies from one country to another and,
sub-6
urban, resort (located near the sea) or an airport hotel. Based on the type of guests, the hotel can
be a business, a transient, a boutique, a residential, a suite, a bed and breakfast and a green hotel.
Based on the ownership, it can be an independent hotel or part of a hotel chain. Finally, based on
the level of services, the hotel can be upmarket/luxury services hotel which offers personalized
services of the highest standards, mid-market service hotels which appeals to a large segment of
travellers such as business, individuals and groups or budget/economy which focus on fulfilling
the basic needs of guests providing clean, comfortable and cheap rooms.
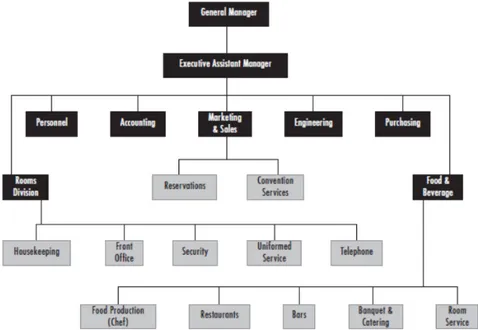
The hotel operations are organized in several areas such as rooms and Food and Beverage (F&B).
Guests come to the front desk to register, receive room assignments, make inquires and check
out. The support areas are housekeeping, accounting, maintenance and human resources.
Housekeeping is, perhaps, the most important support function of the front office. They clean
occupied and emptied rooms and inspect them before selling them. The hotel organization, as
shown in Figure 1, includes the top management level, the middle management and the junior management.
Figure 1: Organizational Structure of a hotel
7
Hospitality industry in Portugal
In Portugal, tourism is one of the most important sectors in the economy and its direct
contribution is 6,4% of the GDP in 2015.
The hospitality industry in Portugal has experienced a significant growth. The annual growth rate
between 2010 and 2015 was 6.5%. The total economic contribution of hospitality to the GDP, in
2015, was 2 478 982 397€, which represents 1,3% of the GDP.
In Portugal, there are several types of accommodation such as hotel establishment, that is divided
into several categories: hotels, apartments with the service of hotel and “pousada”; touristic
apartments; resorts; rural tourism; camping sites.
In 2015, there were 1864 hotel establishments in Portugal. The majority of these hotel
establishments are hotels, 73%, 10% are touristic apartments and the others are rural hotels and
apartment hotels.
Considering the hotels, the majority of them are independent hotels, 1117 (59.9% of the total
number of hotels), according to Atlas of Hospitality by Deloitte Portugal. The most popular hotel
groups and the biggest with Portuguese capital are Pestana Hotels & Resorts alongside with
“Pousadas de Portugal” that have a total of 67 hotels in Portugal and “Vila Galé Hóteis” with 20 hotels in Portugal.
Regarding the classification based on the star criteria, 8% of the total hotel establishments are
five-star, 37% are four-star, 34% are three-star, 16% are two-star and 3% are one-star.
Despite of the positive figures, this industry faces some challenges, in Portugal, namely in human
resources management. Likewise many business and industries, the hospitality industry needs to
be aware that employees are the most important asset of the organization. In the hotel industry,
having a good, qualified and hardworking workforce can distinguish between a more and a less
attractive hotel since these industry is about providing the best service to clients. So, in order to
be more competitive, a hotel should invest in attract and select the best employees.
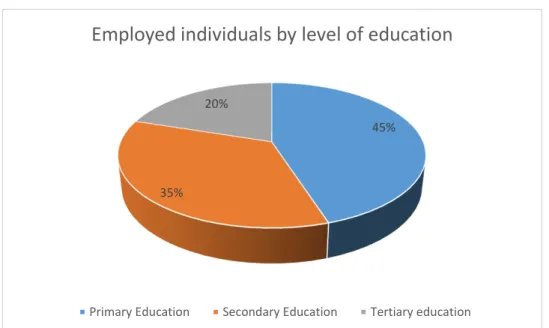
According to figures of “Turismo de Portugal”, in 2016, the number of employees in the hotel
8
45%
35% 20%
Employed individuals by level of education
Primary Education Secondary Education Tertiary education
Figure 2, the majority of employees in the hotel industry have only primary education. So, there is a clear need for qualified employees in this industry in order to improve the quality of the
services provided to the clients and, therefore, contribute to increase the client satisfaction. This
need is more obvious in top management levels of the hotels since they are responsible for the
strategic decisions.
Figure 2: Employed individuals by level of education in the hotel industry
9
Blue Shift
Being aware of this challenge, Blue Shift believes that it can make a difference in the industry by
contributing to the development of competences of the professionals, since, it strongly believes
that the industry needs professionals with management skills, that are able to think strategically
instead of just focus on managing the daily operations. It is important, in Portugal, since the
hospitality industry and tourism have a strong impact in the economy and, this impact, is
expecting to grow in this following years.
Blue Shift, founded in 2012, is a consulting company focused on increasing Hotels & Resorts
profitability and therefore its asset value. The company is composed by a group of professionals
with previous achievements in some of the best international hotel chains. So, their expertise in
the hospitality industry is the main competitive advantage of the company compared to other
consulting firms.
The goal of the company is to ensure a tailor made solution that maximize the hotel investments,
optimize the revenues and ensure the strategic alignment for each project with costumers. This
individual solution for each project is supported by two principals, transparency and respect for
all the employees, partners and customers.
The mission of the company is to contribute for the value creation in the hotel industry by
improving the managerial skills of the hotel managers through consulting projects and hotel
management services.
The values of the company are, innovation and creativity since it believes that the hotel managers
should questioning themselves every day, because past accomplishments of a strategy do not
imply future ones; make it happen, since the change and the results happen with the client and
his/her teams, instead of focusing on theoretical concepts; coaching, since its key that the client
have the know how to continue implementing the change.
The aspirations of the company are increase the competitiveness of the hospitality industry and
attract the best talent in management to work in this industry.
The mantra of the company is achievers make the change since the employees of the company
10
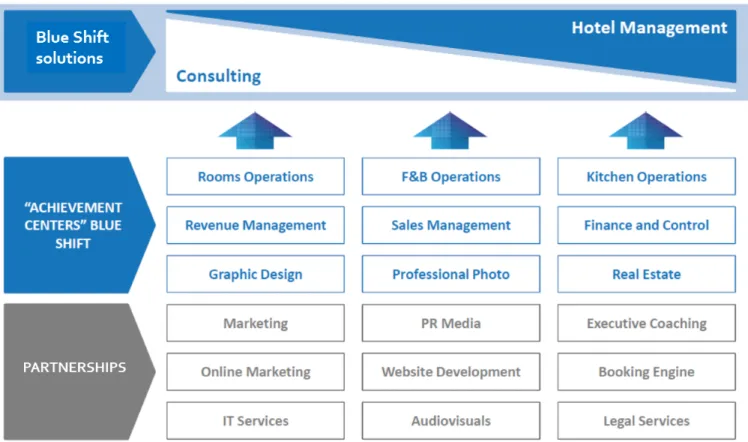
The business model of Blue Shift is based on different solutions tailored to the needs of the
client. The company can manage the whole hotel or just be accountable for certain areas such as
rooms operations, F&B, marketing, as shown in Figure 3.
Figure 3: Business model of Blue Shift
11
Goal of the Work Project
The goal of this work project is to upgrade an already existing model to determine the hotel
profitability by adding some figures and details that give more information to the hotel manager
and, thus, are useful to guide his/her strategic decisions.
This upgrading of the model is relevant for the hotel industry since it is going through an
unprecedented change. On one side, digital technology is changing the balance power to the
costumer side since, nowadays, there are more information available than ever before due to the
pop up of comparison websites that show the reviews of other guests. So, online hotel reputation
management is crucial currently, in order to deal with negative feedback and highlight the
positive. According to TripAdvisor, 93% of clients consider reviews important for the choice of
the hotel and 53% of people would not book a hotel without having access to reviews of other
guests. On the other side, the consumer is changing. Nowadays, millennials have a strong desire
for casual local experiences from which they can learn something and use, mostly, online sources
to plan visits such as OTA´s. Thus, the new generations are not the traditional guests that take
leisure trips just because they want to rest and have some fun. They are looking for something
that makes a difference in their vacations.
So, the digital technology and the changing consumers are contributing to a disruption in the
hospitality industry and leads to the creation of new businesses such as Airbnb.
In order to survive in the hospitality industry, it is important tracking the revenues and the costs
12
Upgrading of the model to determine the economic and financial feasibility of
a hotel
The model will be based in the principles of the Uniform System of Accounts to the Lodging
Industry (USALI), published by the American Hotel Lodging Educational Institute. The first
edition was published in 1926 with the objective of enable the hotels to recording, classifying and
publishing the hotel´s internal results in a homogenous format worldwide. This will allow the
results to be compared worldwide and also contribute to the creation of reliable indicators in the
industry, crucial for all players in this market. USALI was the first successful accounting system
and, nowadays, is the most accepted worldwide.
Basic variables of the model and their relationship
There are three main sources of revenues of a hotel, rooms operations, F&B and other areas such
as Spa and Gymnasium.
Considering the time path, there will be determined the revenues and the costs of operating a
hotel during ten years. This time path is enough to cover all life cycle stages of a hotel from the
introduction to the maturity and decline. The monthly values will be from the year when the hotel
reaches the stage of maturity.
The room operations are a service and it is highly perishable which means that if a room is not
occupied during one night, the revenue is lost. So, the revenue will be directly related to the
number of rooms occupied, that will be determined by segment, such as corporate clients and by
channel, such as online channels like Booking, Expedia or offline channels, as shown in Exhibit 1. This will allow the hotel manager to have a deep knowledge of the demand. Besides of having the data for the first ten years of operations, the model will include the revenues per month in
order to understand the effects of seasonality and to adapt the offer to the segment of clients that
is expected in each month, as depicted in Exhibit 2. It is also important to know the number of guests per room and also per segment/channel because it will have an impact in other areas such
as F&B.
The Key Performance Indicators in the room area are: the number of room nights and number of
13
month. This indicator will be measured monthly because it varies a lot from one month to
another. Finally, the RevPAR (Revenue per available room) is the most important indicator in
this area because it incorporates the occupation rate and the average price. Refer to Exhibit 3-6
for a detailed description of the Key Performance Indicators.
Considering the costs side, the most important are personnel costs and commissions. The
personnel costs will be based on the Full-time Equivalent (FTE). There will be considered several
sections such as reception and several functions inside this section, as shown in Exhibit 7. The goal is to have the cost per FTE for each section and, after this, determine the personnel cost per
area. There will also be consider the costs with extra personnel needed in some seasons when the
occupation rate is higher.
Commissions are a percentage of the rooms sales that are paid to some distribution channels such
as Booking and Expedia, refer to Exhibit 8 for exhaustive description of the commissions by segment. Commissions have a significant impact in the room revenues because a large part of the
clients book the rooms through this online channels.
F&B is the other main area of a hotel. Its revenues will depend on the sales of food and
beverages, on the costs of food and beverages, on the personnel costs and also on commissions.
The indicators will be measured per outlet. The outlets considered in this model are breakfast,
restaurant, restaurant gourmet, bar, room service, minibar, pool bar, banquets and coffee break.
The unit of measure of this area will be the couvert which represents a full meal including food
and beverage.
The Key Performance Indicators in the F&B area are the guest capture rate, the number of
couverts per outlet and the average expenditure on food and beverage per outlet, as shown in
Exhibit 9-11. These indicators will help the hotel manager to understand which outlets are the most profitable and which ones are not attractive to guests.
The costs of F&B will be a percentage of the revenues, the personnel costs and commissions.
Commissions will only exist in the banquets and the coffee breaks and these outlets are typically
demanded by two segments of clients, corporate and groups. So, commissions will be measured
14
The other areas will include the following outlets, Meeting Rooms, Spa, Gymnasium,
Telephone/Internet and garage. The revenue side of this areas will also be measured according to
guest capture rate and to the average expenditure per guest on each outlet, as shown in Exhibit 13 and 14. The number of guests per outlet is useful to figure out which outlets are the most attractive and therefore require a higher investment.
The cost side of these areas include the personnel costs and the operating costs. The last ones are
measured as a relatively small percentage of the total revenues.
The big difference in this area is that the FTE´s extra are measured per month which is
particularly useful, because the months when the demand is higher may not correspond to the
months when the number of FTE´s extra required is higher. Considering the example of meeting
rooms, the months of higher demand are related to the months when the clients corporate and
groups occupied the hotel.
Besides of the operational areas, the hotel also has overhead areas that support all operational
activities of the hotel and have a contribution to the revenues generated by them. These areas
include administrative and general, sales and marketing, maintenance, utilities, Information
Technology (IT), and management fees. These departments do not generate, directly, revenues
but generate costs such as personnel costs, that are detailed in Exhibit 15.
The margin of the room´s area, F&B and other areas are the main revenues of operating a hotel.
Contractual relationship in the hospitality industry
Usually, the hotel manager is not its owner for several reasons such as, the lack of appropriate
managerial skills of the owner. The owner, typically, sign a management agreement with other
entity. The most common types of management agreements are, management contracts and
franchising.
Franchising is an agreement between a hotel chain and an owner of an independent hotel. The
hotel chain will provide the access to the brand reputation, knowledge and services. However, the
owner will have to pay certain management fees to the hotel chain which includes an initial fee,
paid per room in the first year of operations, a royalty fee, a marketing fee and a booking fee
15
which is a percentage of the room revenue generated by the clients that belong to the loyalty
programme. In franchising, the owner is fully responsible by the results of the hotel.
The management contract is an agreement between a management firm or an operator and the
owner of the hotel where the management firm or operator has fully responsibility for the hotel
management. The fees paid are the pre-opening fee which is a fixed amount per room, a basic
fee, a percentage of the total revenues, an incentive fee, a percentage of the Gross Operational
Profit (GOP), in order to make sure that incentives of the management firm are aligned with the
incentives of the owner. Refer to Exhibit 16 for a full description of the management fees.
Financial Analysis
In order to decide whether should invest or not in a hotel, there is a need to conduct a financial
analysis. First, it is necessary to determine the working capital requirements that is the money
that a hotel is required to keep in order to be able to pay its debt obligations and other business
expenses. Managing working capital includes managing inventories, accounts payable, accounts
receivable and stocks. The important value is the net working capital requirements which are the
difference between current assets and current liabilities. Considering that the cash flow of each
year as the net profit, it is necessary to have the value of the free cash flow which is the
difference between cash generated by the operations of a business during a period and the cash
outlays for working capital, capital expenditures and depreciation during the same period. The
financial analysis is detailed in Exhibit 17.
In order to have the Net Present Value (NPV) of the investment, it is necessary to have the
discounted cash flows and the Weighted Average Cost of Capital (WACC) that will be the
discount rate. If the NPV is positive, the investor should invest in the project.
The formula of the NPV is the following,
𝑁𝑃𝑉 = ∑
𝑇𝑡=1(1+𝑟)𝐶𝑡 𝑡− 𝐶
016
There will also be computed the Internal Rate of Return, that is the discount rate that makes the
NPV equals to zero.
This feasibility analysis is an advantage because it is an indicator of how well is the hotel
performing and how much it is expecting to grow in the following years. It is also useful to
understand how the profitability of the hotel can change just by changing one variable. For
instance, to determine the impact of different occupancy rates in the profitability is common to
build two or three possible scenarios; one that is the best case scenario, a regular scenario and the
worst case scenario, and analyse the NPV in these three scenarios.
Benchmarking
Benchmarking is the systematic procedure of comparison with the purpose of achieving
continuous improvement. It is considered to be a prime opportunity for a hotel to increase its
profitability and its guest satisfaction.
There are two different types of benchmarking, the internal and the external one. The internal is
the comparison between the divisions in the same hotel and it is the most used practice. This is
useful to help the manager understand the strengths and weakness of the hotel and to improve the
efficiency of the company. The external benchmarking can also be denominated competitive
since the hotels compare themselves with other hotels and with other companies from a different
industry that are consider to have some best practices that can be applied to the hotel industry.
There is also benchmarking with some key indicators from the sector which is called sector
benchmarking. This type of benchmarking is useful to understand the practices of the best
performing players in the market and is, usually, undertaking by industry associations.
Considering the hotel industry, benchmarking can demonstrate the enormous potential of a hotel
to improve the quality of services and lead to significant changes in accommodation and F&B
processes. The ultimate goal of benchmarking is understanding the best practices of the most
important players in the industry and, therefore, improve the quality of the service.
The benchmarking in hotels should take into account the hotel category that can be measured in
17
accurate because the criteria used to determine the star varies greatly from country to country and
it is conferred by several organizations such as government or independent ones.
However, it is also necessary to assess the market and to understand that several differences
between the hotels can have impact on the performance such as the location because a city hotel
is different from a resort, the profile of the customers of these hotels are also different and,
therefore, the services need to be necessarily different.
The hotels used as references for the benchmarking in the model are the twelve Tivoli Hotels &
Resorts in Portugal and the data are from 2015. The Key Performance Indicators compared, in the
room area, will be the occupation rate, the number of guests per room, the average price, the
commission´s online, offline and loyalty (commissions as a percentage of the revenues generated
by the clients who are members of the loyalty programme), personnel costs, other costs and also
the room area margin, as shown in Exhibit 18.
Considering the F&B area, the Key Performance Indicators will be the guest capture rate per
outlet, the average expenditure per couvert for each outlet, the revenue of the room service and
minibar per occupied room, the food ratio (the costs of food/ the sales of food), the beverages
ratio, personnel costs, other costs and the F&B area margin, as detailed in the Exhibit 19.
Considering the other area, the Key Performance Indicators are the revenue of meeting rooms as
a percentage of the revenue generated by the clients MI (Meetings and Incentives), the revenue of
Spa, garage, telephone/Internet per occupied room and the other area´s margin, as show in
Exhibit 20.
The Key Performance Indicators of the overhead areas are the personnel costs as a percentage of
the total revenues and per occupied room, the other costs as a percentage of the total revenues
and per occupied room and the total costs as a percentage of total revenues, as depicted in
Exhibit 21.
In utilities, the Key Performance Indicators are the cost per occupied room and the total cost as a
percentage of the total revenue.
Finally, there should also be considered some global indicators of the overall performance in
18
of the total revenues or the number of FTE´s per occupied room, refer to Exhibit 22 for a detailed description of these indicators.
The practice of benchmarking has several advantages such as the opportunity of monitoring the
quality of services of the hotel and, thus, the guest satisfaction which is the most important issue
in the hotel business. Continuous improvement is key to remain relevant in the hotel industry and
compare the services among different hotels is important. For the model, benchmarking is useful
to understand which areas of the hotel are performing better and which ones need improvements.
This technique helps to keep the business focused on satisfying clients, improving procedures and
19
Main aspects of the model
After considering this analysis, it will be possible to compute the GOP and also the GOP as a
percentage of the total revenues. The total revenues are the sum of the sales of each operational
department, the rents and other departmental revenues.
In order to have the value of the net profit of the year, it is necessary to take into account the
fixed costs such as taxes and insurance expenses. These expenses will be a fixed amount per
month.
After this, there will be computed the rents which are a fixed value per room and then the
amortizations, depreciations and the financial costs. Finally, the income taxes and the net profit of
the year.
In order to compute the depreciation, it is necessary to determine the investments made by the
hotel in the initial years. The initial investment general includes the land, the licensing to build
the hotel and the construction. These investments will occur during the first three years of
operation. After that, the investment needed is a percentage of the total revenues since a hotel
requires a high investment if the number of guests is higher.
In this model, the values will take into consideration the annual inflation and the inflation
accumulate over the years in several areas, namely, to update the values of the personnel costs
through the years. Another important issue is that it will be considered three years before the
hotel opening that represent the investment in order to build it. So, during these years there are
only several costs.
The model will also include a detailed plan of areas of the hotel including, not only the rooms,
but the restaurants and bars, the kitchen among others. This plan will help to determine the
investment needed based on the area of each functional space.
Obviously, there will also be included the taxes and the financial costs and the final calculation
will be net profit of the hotel which is important to understand how the hotel is performing and its
20
This Profit & Loss analysis is one of the main aspects of the model since it gives a clear idea of
the performance of the hotel and of the areas that are contributing more and less to it, refer to
Exhibit 23 for a detailed description of the Profit & Loss.
The Profit & Loss statement is in the following equation:
Revenues = rooms´ revenues (occupancy rate; average price) + F&B´s revenues
(guest capture rate; number of guests; average expense) + other areas´ revenue
(guest capture rate; number of guests; average expense per outlet ) - general and administrative costs
(personnel costs)-IT and telecommunications (personnel costs)-marketing and sales
21
Comparison between the upgraded model and the initial
There are several differences between this model and the previous one regarding the variables,
the level of detail and the drivers of the model.
In the room operations area, the methodology used to compute the room sales for each segment is
different from the previous model. In this model, the variables independent are the percentage of
room nights per segment annual and monthly, the number of guests and the average price per
occupied room and, also, detailed per segment. These variables are obtained based on the data
that is recorded by the hotel and, thus, the values are easily obtain. In the initial model, the
independent variable is the percentage of room nights per segment, as shown in Exhibit 24.
Another relevant expenditure in the rooms area, are the commissions since, nowadays, the
majority of guests book online and, therefore, the weight of commissions in the rooms revenue is
increasing. Despite of that, commissions are not relevant to all segments because some guests
book directly with the hotel, which means, that it is important to determine commissions per
segment. This approach is different from the previous model due to the fact that the impact of this
variable in the revenues is greater compared to 2010, the year of the previous model.
Regarding the personnel costs, the cost of extra FTE´s per month and per section is also new in
this model. This variable was included in the upgraded model for several reasons such as the fact
that the number of extra FTE´s required varies from month to month. Obviously, in the months
with higher occupation rate, the number of FTE´s required is higher too to ensure the quality of
the service. The detailed number of FTE´s per section is significant since, only some sections and
some functions required more FTE´s namely the ones directly related to the operational side of
the business.
It is assumed that the values of personnel cost report to a year when the hotel reaches the maturity
since there is a stabilize income level at this stage. Besides of this, at this stage, there are several
clients that are already loyal and, thus, it is possible to predict with a higher level of confidence,
the number of guests and, consequently, the number of FTE´s needed. The model assumes that
the personnel costs in other years are a percentage from the ones indicated previously since, for
example, in the first years the number of FTE´s required might be lower than in the others due to
22
Finally, the key revenue indicators will also be indicated in monthly terms which represents a
great advantage to understand the impact of seasonality.
Regarding the F&B area, the differences between the two models are huge since the initial model
only includes general indicators while this provides a full picture of this area. It will be
considered several outlets, as mentioned above, and the guest capture rate per outlet which help
the manager to be aware of the profitability of each outlet.
The average expense in food and beverage is also measured per outlet which is extremely useful
since, for example, the cost of breakfast is differ from a cost of dinner.
The upgrade of the model will include the commissions in F&B that are related to the banquets
and coffee breaks because, usually, another firm is hired to organize these events. These events
are organized, usually, for corporate clients that are only a part of the total clients and, therefore,
commissions will be measured per segment.
In personnel costs, the extra FTE´s will also be measured annual and monthly for the same reason
explained above.
Considering the other areas, variables will be expressed in outlets such as meeting rooms, Spa,
laundry, golf among others. The guest capture rate will be measured per outlet due to the
difference between the number of guests that use the meeting rooms and the ones who use the
Spa, for example. The average expense and the net sales will also be expressed per outlet.
Regarding the personnel costs, the extra FTE´s will also be measured per month.
The overhead areas also face some upgrades namely the fact that marketing and sales are a single
area, contrary to the initial model that consider it two different areas.
In the financial analysis, this model does not have significant differences compared to the initial
one.
The model will include a benchmarking with other hotels which represents an advantage in
relation to the initial one, since it is possible to easily compare the Key Performance Indicators of
a hotel with other similar hotels. Benchmarking is useful to compare the performance of the hotel
considered with other hotels with similar characteristics in order to understand which areas could
23
thus, customers can easily compare among several hotels and understand if the other guests are
satisfied or not with the service. Competition became even more significant than before and the
quality of service become even more relevant. Ensuring guest´s satisfaction must be the priority
24
Conclusion
The majority of the hotel managers are concerned about the brand of the hotel since they strongly
believe that it contributes to the attraction of new costumers and will retain the loyal ones.
However, the brand value is decreasing in the hotel industry, which that the brands need to make
an effort to remain significant for the guests, by adapting its offer to their needs and desires.
However, the environment in which a hotel operates is complex since they need to integrate a
growing number of technologies and manage the challenges that come from outside. These
challenges came from home rental companies like Airbnb, since they offer to travellers a solution
that is more aligned to their needs and, thus, obliging the hotels to review the way they do
business.
This model aims to help the hotel managers to cope with the fierce competition of the industry by
providing them a tool that have all the relevant information about the factors that will influence
their business´ profitability such as the demand for room nights and the average price of each
room night. If the hotel manager is able to know which type of customers visit the hotel in each
season, the engagement with the costumer will be higher since it is possible to target the offer of
the hotel to a specific type of costumer. This personalized service will, certainty, make the
difference and contribute to build customer loyalty.
So, the model is a powerful tool to help a hotel to stand out of its competitors and offer different
services based on its customer base instead of trying to offer a one-size-fits-all service that, in the
end of the day, does not make any customer totally satisfied. If the customers are totally satisfied
with the service, they will recommend the hotel to their friends and family and this
word-of-month will positively impact the hotel revenues.
This model can make a difference since it generates value for customers, for the hotels that used
25
References
Humphreys, Davidson, and J. Christophe Holloway. 2009. “The Business of Tourism”. London: Pearson Education.
Rutherford, and Michael J. O’Fallon. 2007. “Hotel Management and Operations”. New Jersey: Wiley.
Welch, Benito and Bent Petersen. 2007. “Foreign Operation Methods”. Northampton, MA: Edward Elgar.
Radzi, Hashim, Tamby Chik, Abu and Artinah Zainal. 2012. “Current Issues in Hospitality and Tourism Research and Innovations”. Boca Raton: CRC Press.
J. Sucher, Sandra and Stacy E. Mcmanus. 2005. “The Ritz-Carlton Hotel Company”. Harvard Business School.
Turismo De Portugal, I.P. 2016. Turismo de Portugal.
http://www.turismodeportugal.pt/Portugu%C3%AAs/AreasAtividade/dvo/empreendimentos-turisticos/Pages/classificacao.aspx (accessed November 10, 2016)
EY. 2013. Hotrec (Hospitality Europe), EY.
http://www.ey.com/Publication/vwLUAssets/The_Hospitality_Sector_in_Europe/$FILE/EY_The _Hospitality_Sector_in_Europe.pdf (accessed November 17, 2016)
Atlas da Hotelaria. 2016. Deloitte Portugal. http://atlasdahotelaria.com/2016/#nav-index (Accessed: November 5, 2016)
Travel BI. 2016. Turismo de Portugal. http://travelbi.turismodeportugal.pt/pt-pt/Paginas/Populacãoempregada2016.aspx (accessed: November 2, 2016)
PGAV Destinations. 2011. PGAV Destinations.
http://www.pgavdestinations.com/images/insights/Meet_the_Millennials.pdf (accessed: December 1, 2016)
World Travel & Tourism Council. 2016. World Travel & Tourism Council. http://www.wttc.org/media/files/reports/economic%20impact%20research/countries%202016/por tugal2016.pdf (accessed: December 3, 2016)
EY. 2016. EY. http://www.ey.com/gl/en/industries/real-estate/ey-global-hospitality-insights-2016 (accessed: December 5, http://www.ey.com/gl/en/industries/real-estate/ey-global-hospitality-insights-2016)