Evaluation of entrance surface air kerma rate
and clinical images quality in chest radiography*
Avaliação do kerma no ar na superfície de entrada e da qualidade da imagem em radiografias de tóraxAngelo Bernardo Brasil de Souza1, Simone Kodlulovich Dias2, Fernando Mecca Augusto3, Winston Andrade Marques4
OBJECTIVE: To evaluate technical factors involved in posteroanterior chest radiography in standard patients, and correlating them with entrance surface air kerma rate and with the clinical images quality. MATERIALS AND METHODS: The present study was developed at three hospitals in Rio de Janeiro, Brazil, involving a total of five x-ray rooms, with ten patients per room. The images were evaluated by the radiologists of the institutions, in accordance with the European protocol. The estimation of surface entrance air kerma rate was based on the x-ray equipment output curve obtained with an ionization chamber coupled with an electrometer. Variance analysis was performed to evaluate the significance of the difference between entrance surface air kerma rates. RESULTS: Entrance surface air kerma rates ranged between 0.05 and 0.26 mGy, with a mean value 60% lower than the reference level established by the Order (Portaria) 453. Among the images evaluated, 98% fulfilled > 65% of the images quality criteria. CONCLUSION: For a standard image quality that is acceptable for diagnosis purposes, a significant variation was observed in the entrance surface air kerma rate for standard patients, demonstrating the lack of technical factors standardization and a potential for decreasing the entrance surface air kerma rate.
Keywords: Reference levels; Optimization; Quality; Radiographic techniques.
OBJETIVO: Avaliar os fatores de técnica utilizados durante exames de tórax póstero-anterior em pacien-tes-padrão e correlacioná-los aos valores de kerma no ar na superfície de entrada e à qualidade das imagens clínicas. MATERIAIS E MÉTODOS: O estudo foi realizado em três hospitais do Rio de Janeiro, num total de cinco salas de raios X, com dez pacientes por sala. As imagens foram avaliadas pelos radiologistas dos serviços segundo o protocolo europeu. O kerma no ar na superfície de entrada foi estimado a partir da curva de ren-dimento do equipamento de raios X, que foi obtida utilizando câmara de ionização acoplada a um eletrôme-tro. Análise de variância foi realizada para verificar se a diferença entre os valores de kerma no ar na super-fície de entrada é significativa. RESULTADOS: Os valores de kerma no ar na supersuper-fície de entrada variaram entre 0,05 e 0,26 mGy, com média 60% inferior ao nível de referência publicado na Portaria 453. Das ima-gens avaliadas, 98% atenderam acima de 65% dos critérios de qualidade. CONCLUSÃO: Para um padrão de qualidade da imagem, aceitável para o diagnóstico, verificou-se ampla variação do kerma no ar na superfície de entrada para pacientes-padrão. Isto demonstra a falta de padronização dos fatores de técnica e a existên-cia de um potenexistên-cial de redução do valor do kerma no ar na superfície de entrada.
Unitermos: Níveis de referência; Otimização; Qualidade; Técnicas radiográficas.
Abstract
Resumo
* Study developed at Instituto de Radioproteção e Dosimetria/ Comissão Nacional de Energia Nuclear (IRD/CNEN), Rio de Ja-neiro, RJ, Brazil.
1. Fellow Master degree (Scholarship), Program of Biomedical Engineering – Instituto Alberto Luiz Coimbra de Pós-Graduação e Pesquisa em Engenharia/Universidade Federal do Rio de Janeiro (COPPE/UFRJ), Rio de Janeiro, RJ, Brazil.
2. PhD, Researcher, Instituto de Radioproteção e Dosimetria/ Comissão Nacional de Energia Nuclear (IRD/CNEN), Rio de Ja-neiro, RJ, Brazil.
3. Master, Head of the Unit of Medical Physics Radiodiagnosis – Instituto Nacional de Câncer (INCA), Rio de Janeiro, RJ, Brazil. 4. Specialist in Radiology, MD, Radiologist at Instituto Nacio-nal de Câncer (INCA), Rio de Janeiro, RJ, Brazil.
Mailing address: Dr. Angelo Bernardo Brasil de Souza. Rua Barão de Piracinunga, 15, ap. 102, Bloco A, Tijuca. Rio de Ja-neiro, RJ, Brazil, 20521-170. E-mail: [email protected] Received May 25, 2009. Accepted after revision August 14, 2009.
dose differences above two orders of mag-nitude for the same type of radiological study, demonstrating that the dose s re-ceived by the patients during medical pro-cedures can be significantly reduced with-out compromising the diagnosis(2,3). These
results evidence the need to reevaluate the procedures in order to reduce the dose without compromising image quality. Such objective may be reached using as a refer-ence the minimum radiation dose required for obtaining acceptable quality images. Such values were initially defined in the Souza ABB, Dias SK, Mecca FA, Marques WA. Evaluation of entrance surface air kerma rate and clinical images quality in chest radiography. Radiol Bras. 2009;42(5):315–319.
INTRODUCTION
The dose absorbed by the patient sub-mitted to a conventional radiology proce-dure is low when compared with other medical practices using ionizing radiation. However it is a known fact that among all other artificial sources, it is the one with the largest contribution to collective dose(1).
nineties by the International Atomic Energy Agency (IAEA) with the support of the European Community (EC) and were de-nominated levels of reference(4,5).
In Brazil, the Ministry of Health estab-lished in the Order (Portaria) 453(6), the
reference levels based on values published in the Basic Safety Standards (BSS)(7). The
research in radiodiagnosis in the country is developed by researchers working isola-tedly, applying different methods(8–11). In
order to determine local reference levels, a coordinated and standardized large-scale study must be undertaken in Brazil.
The objective of the present study is to evaluate the techniques employed in pos-teroanterior chest radiography, the entrance surface air kerma (ESAK) received by each patient as well as the resulting images qual-ity, based on quality criteria established by EC(5), in a sample of ten standard patients,
as recommended by IAEA(4).
MATERIALS AND METHODS
The research was divided into the fol-lowing phases: obtaining the performance curves of the x-ray equipment; recording the technical factors (voltage, focus–film distance and current × time product); evaluation of images quality; ESAK calcu-lation and results analysis.
The study was developed in three hos-pitals in the city of Rio de Janeiro, as fol-lows: Hospital A, with three x-ray rooms, all of them with a Heliophos unit (Siemens; São Paulo, Brazil), and hospitals B and C, with one room each, using a Compacto 500unit (VMI; Minas Gerais, Brazil) and a RT 500/125 unit (Ray Tec; São Paulo, Brazil), respectively. All of the x-ray units had a 2.5 mmAl filter and all the studies were performed with grids. For each one of the rooms, ten standard patients (1.60 to 1.80 m in height and weighting 60 to 80 kg) were selected, in compliance with the IAEA TECDOC 1423(4) recommendations.
The three hospitals have a quality assurance program maintained by their respective medical physicists, including periodic quality control testing of their processors. The performance curve was obtained using a dosimetric set manufactured by Radcal (Radcal Corp.; Monrovia, USA) comprising a 10X5-6 ionization chamber
connected with 9060 current-frequency converter and with a 9015 measurement unit. The ionization chamber was posi-tioned over a base of non-scattering mate-rial at the center of the radiation field and at a distance of 100 cm from the x-ray fo-cal point. The collimator was opened until the radiation field entirely covered the sen-sitive volume of the ionization chamber, with a maximum excess of 5 cm. The ion-ization chamber was kept at a distance of approximately 15 cm from the table, in or-der to minimize the effect of scattered ra-diation. Keeping the current × time prod-uct fixed at 32 mAs, three readings for each voltage level between 60 and 117 kVp were performed. The performance was deter-mined by the ratio between the mean of the air kerma readings for each voltage level and the current × time product utilized. The uncertainty level of the equipment used in the measurements is 4% of the reading val-ues. The performance curve as a function of applied voltage was adjusted by the ex-ponential function shown on equation (1).
y(x) = Aexp(x /t) + yo eq. (1)
where: y is the performance for a voltage x e A; t and y0 are the coefficients of the
ex-ponential curve, whose values vary for each equipment.
In the hospitals, forms were utilized for the acquisition of the following data: date and room where the studies were per-formed; identification of the patient for ensuing access to the images; weight and height in order to verify whether or not the patient could be considered a standard pa-tient(4); voltage applied in the tube; current × time product; patient–focus distance; focus–film distance and type of projection. Each patient was informed about the pur-pose of the study before submitting per-sonal data. Height and weight were checked before the performance of the studies. The technical factors were com-pared with the following values recom-mended by EC(5): voltage of 125 kVp;
fo-cus–film distance of 180 cm, considering an interval of 140 to 200 cm as acceptable, and maximum exposure time of 20 ms.
At hospital A, the images are kept on file and were evaluated after the end of the technical data acquisition and patient data acquisition. At hospitals B and C, the
evaluation of image quality was performed immediately after the study, as the images were given to the patients after the medi-cal reports were issued. The criteria for as-sessment of image quality presented below were based on those published by EC(5):
1) full inspiration; 2) thoracic symmetry;
3) medial border and scapula out of the pulmonary field;
4) accurate visualization of the vascu-lar pattern of the entire lung;
5) accurate visualization of the trachea; 6) accurate visualization of the main bronchi;
7) accurate visualization of cardiac and aortic margins;
8) accurate visualization of the costo-phrenic angles;
9) accurate visualization of the dia-phragm.
Images complying with at least 65% of the above criteria were considered good quality. The ESAK was estimated only on studies whose images met this criterion.
The ESAK calculation was made at the end of all phases, using equation (1) ob-tained from the performance curve, and the equation (2), as follows:
Ke = KiB = YPit(dref/d)
2B eq. (2)
where; Ke is the surface entrance air kerma; Kiis the incident air kerma; B is the
back-scattering factor; Y is the tube performance defined by equation (1); Pit is the product
current × time used during the studies; dref
is the distance between the focus end the ionization chamber during the obtainance of the performance curve; d is the distance between the focus and the patient during the studies.
At the rooms in hospital A, three perfor-mance curves were obtained in different dates. The curve related to the date closest to that when the study was actually per-formed, was utilized in the ESAK estima-tion. Once the ESAK values were esti-mated for each patient, the mean, maxi-mum and minimaxi-mum values were calculated for each room. The third quartile of all ESAK values was calculated, defining a preliminary value of the reference level for posteroanterior chest studies(2,3,12).
signifi-cant differences between the performance curves and ESAK values of the different rooms. The statistical software R(13) was
utilized for statistical analysis.
RESULTS
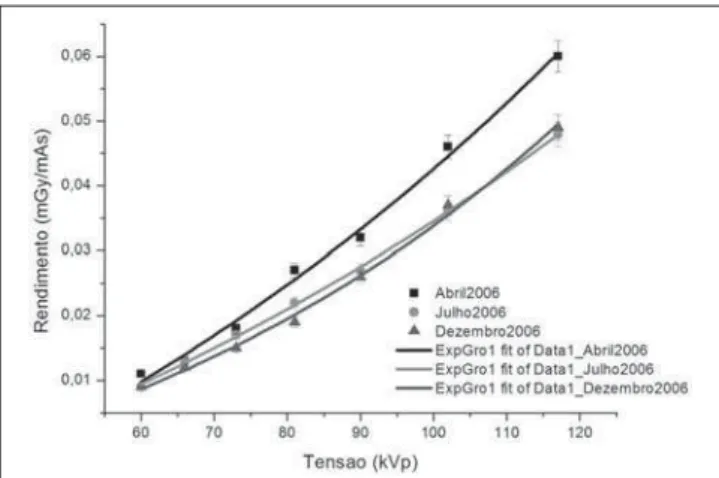
Figures 1, 2 and 3 show the performance curves of hospital A. The levels of statisti-cal significance (P-values) obtained after ANOVA for rooms A-1, A-2 and A-3 were, respectively, 0.76, 0.82 and 0.9. Consider-ing a significance level of 95% (P = 0.05), such values indicate that it is not possible to affirm that the differences between the curves are statistically significant. Such result indicates that the equipment of this hospital can be considered as stable.
Figure 4 shows the voltage values used during the studies performed in all the
rooms. It is possible to observe that the mean voltage values used were lower than those recommended by EC(5). With regard
to the difference between minimum and maximum values, the largest voltage varia-tion used in the studies was verified in the rooms of hospital A, in particular at A-1 room and in room C. Room A-3 presents a lower variation than the other rooms at that hospital. In spite of presenting the lowest variation in the voltage values, the room B presented mean voltage much inferior to the recommended level(5).
Figure 5 shows the variation of focus– film distances in the different rooms. At room A-1, the difference between the maxi-mum and minimaxi-mum values was 34 cm. At the room B, the distances were only 150 and 180 cm, and at room C the distance was fixed at 180 cm for all studies.
Exposure times in each room are pre-sented on Figure 6. The largest variation in exposure time was observed at room C. Also, in this room, the exposure times in studies were longer than those in the other rooms and significantly above recom-mended value. At room A-2, the studies were performed with exposure times clos-est to the recommended ones(5). Room B
was the only room that kept a constant ex-posure time at 50 ms. Such value is higher than twice the recommended threshold(5).
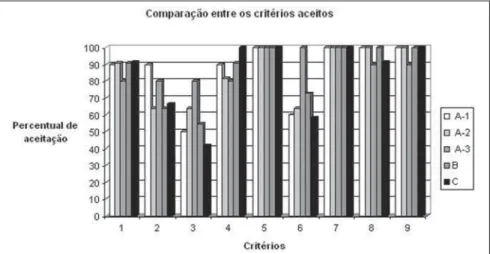
Fifty-five images were evaluated in all rooms, and of those, 22% met 100% of the criteria, 76% were considered as useful for diagnosis purposes and 2% met less than 65% of the criteria. Figure 7 shows the ac-ceptance percentages for each one of the criteria. The criteria 5 and 7 were met on all the images. Such criteria depend upon
Figure 3. Performance curves obtained in April, July and December of 2006 for room A-3, with uncertainties of 4% inherent to the measurement device.
Figure 4. Variation of voltage applied in studies at the different rooms. The recommended value of 125 kVp for posteroanterior chest studies(5) is
high-lighted. The central points on each bar represent the mean values for voltage in each room.
Figure 1. Performance curves obtained in April, July and December of 2006 for room A-1, with uncertainties of 4% inherent to the measurement device.
contrast resolution, i.e., depend upon tech-nical factors utilized during the studies, and the criterion 5 is considered as being criti-cal for the diagnosis. Criterion 3 had the lowest acceptance index, with a percentage of 40% at room C. This criterion depends upon the positioning of the patient and is not considered as being critical for the di-agnosis.
By observing Figure 8, one can see that in all the rooms the mean ESAK values were lower than the value recommended at by the order (Portaria) 453 (0.3 mGy) for films with speed of 400(6). The third
quartile value of 0.12 mGy represents a pilot value for the reference level for pos-teroanterior chest studies at the hospitals in which the present study was developed. The mean ESAK at rooms A-1and C was above such value. The differences between these mean values and the others are sta-tistically significant and the p-values can be seen on Table 1. The largest variation in the ESAK values occurred in room A-1 (0.06 to 0.23 mGy), where the largest varia-tions on technical factors were observed. Room B presented the smallest variation of the ESAK values (0.05 to 0.09 mGy). The mean ESAK in this room was 0.06 mGy, the lowest observed.
DISCUSSION
The long data acquisition period at hos-pital A made it necessary to obtain more updated performance curves in order to evaluate the equipment stability. However,
Figure 7. Comparison between the percentages of acceptance of quality evaluation criteria of images at rooms A-1, A-2, A-3, B and C.
Figure 8. Variation of the ESAK values for each x ray room. (a) Reference level recommended by the Order (Portaria) 453 for posteroanterior chest studies using 400 speed films(6). (b) 75% quartile for all
the ESAK values obtained in the study. (c) Mean ESAK value obtained during the study. The points indicate the mean ESAK values for each room.
Figure 6. Variation of exposure time for all five rooms. The recommended value of 20 ms for posteroanterior chest studies(5) is highlighted. The central
points in each bar represent the mean values for exposure time in each room. Figure 5. Variation of the focus–film distance at the different rooms. The
recommended value of 180 cm for posteroanterior chest studies is high-lighted(5). The central points in each bar represent the mean values for focus–
from the ANOVA results it was possible to observe that the difference between perfor-mance values was not significant.
With regard to the investigation of the technical factors applied on the studies, one observed that the room 1 at hospital A did not present a standardization of radio-graphic techniques. In this room the larg-est variation in voltage applied to the tube was observed, as well as in the focus–film distance for patients with similar physical characteristics. Consequently, in this room the ESAK value variations were higher than those in the other rooms. This fact may be related to the absence of a radiographic technique chart specific for the equipment and for the studies performed by different technicians.
In spite of the fact that hospitals B and C presented more standardized techniques, the values for exposure times were higher than those recommended by EC(5). Thus, an
increase in the ESAK values was observed, particularly in room C. It is important to observe that a long exposure time in chest studies compromises image quality, due to the blurring caused by involuntary move-ments of the organs involved in the study. In spite of the fact that images met the quality criteria, variations of up to 74% were observe in ESAK values. Such result demonstrates a considerable potential for
dose reduction. Only 22% of the total of 55 images met 100% of the quality criteria. On the other hand, only 2% of the images were not considered as useful for diagnosis.
CONCLUSION
The variation of technical factors caused up to 74% variation in ESAK val-ues, for images considered of good qual-ity. Such result indicates that patients are being unnecessary exposed to radiation. Additionally, a large potential for dose re-duction was observed, and such rere-duction can be achieved by establishing a standard protocol to be followed by the technicians in the centers. The implementation of stan-dard technical factors is troublesome due to the absence of periodical training pro-grams at the centers. In order to optimize the radiological procedures, a training ef-fort will need to be deployed amongst the technicians, medical physicists and radiolo-gists in these centers.
Acknowledgments
The authors wish to thank the institu-tions that participated in the present study, the responsible physicists, the radiologists that evaluated the images quality, and the technicians that collaborated in the acqui-sition of data on technical factors.
REFERENCES
1. International Atomic Energy Agency. Radiation doses in diagnostic radiology and methods for dose reduction. IAEA-TECDOC-796. Vienna: IAEA; 1995.
2. Gray JE, Archer BR, Butler PF, et al. Reference values for diagnostic radiology: application and impact. Radiology. 2005;235:354–8. 3. Vassileva J, Dimov A, Slavchev A, et al.
Bulgar-ian experience in the establishment of reference dose levels and implementation of a quality con-trol system in diagnostic radiology. Radiat Prot Dosimetry. 2005;117:131–4.
4. International Atomic Energy Agency. Optimiza-tion of the radiological protecOptimiza-tion of patients undergoing radiography, fluoroscopy and com-puted tomography. IAEA-TECDOC-1423. Vienna: IAEA; 2004.
5. European Commission. European guidelines on quality criteria for diagnostic radiographic im-ages. Report EUR 16260 EN. Luxembourg: Of-fice for Official Publications of the European Communities; 1996.
6. Ministério da Saúde. Diretrizes de proteção ra-diológica em radiodiagnóstico médico e odonto-lógico. Portaria nº 453. Brasília: Diário Oficial da União, nº 103, 2/6/1998.
7. Food and Agriculture Organization of the United Nations, International Atomic Energy Agency, International Labour Organisation, OECD Nuclear Energy Agency, Pan American Health Organization, World Wealth Organization. International basic safety standards for protection against ionizing radiation and for the safety of radiation sources. Safety Series No. 115. Vienna: IAEA; 1996.
8. Azevedo ACP, Mohamadain KEM, Osibote OA, et al. Estudo comparativo das técnicas radiográ-ficas e doses entre o Brasil e a Austrália. Radiol Bras. 2005;38:343–6.
9. Oliveira ML, Khoury H. Influência do procedi-mento radiográfico na dose de entrada na pele de pacientes em raios-X pediátricos. Radiol Bras. 2003;36:105–9.
10. Kotsubo MTK, Marchiori E, Azevedo ACP. Es-tudo dosimétrico de radiografias de tórax com o emprego de técnicas de alta quilovoltagem. Ra-diol Bras. 2003;36:163–7.
11. Osibote AO, Azevedo ACP, Carvalho ACP, et al. Exposição de pacientes e qualidade da imagem em radiografias de tórax: uma avaliação crítica. Radiol Bras. 2007;40:119–22.
12. Acuerdo Regional de Cooperación para la Promo-ción de la Ciencia y la Tecnología Nucleares en América Latina y el Caribe. Determinación de niveles orientativos para radiología convencional e intervencionismo. Informe de reunión final de coordinadores. Proyecto ARCAL LXXV, 2005. [cited 2007 Aug 28]. Available from: http://tc. iaea.org/tcweb/projectinfo/projectinfo_body.asp 13. R Development Core Team. R, version 2.5.1.: R Foundation for Statistical Computing, 2007. [cited 2007 Aug 28]. Available from: http:// www.r-project.org
Table 1 Significance p-values for each comparison between means of ESAK values obtained using ANOVA in the statistical software R(13).
Analysis
All rooms Rooms A-1 and A-2 Rooms A-2 and A-3 Rooms A-3 and B Rooms B and C Rooms A-1 and A-3 Rooms A-1 and B Rooms A-1 and C Rooms A-2 and B Rooms A-2 and C Rooms A-3 and C
P-value
7753 × 10–9
0.017 0.779 0.156 3099 × 10–8
0.033 2405 × 10–4
0.117 0.269 5632 × 10–5
1471 × 10–4
Significance 0.001* 0.05† 1‡ 1 0.001 0.05 0.001 1 1 0.001 0.001