1
Radiol Bras. 2011 Jan/Fev;44(1):1–6
Hepatic vein Doppler flowmetry in patients with nonalcoholic
steatosis
*
Dopplerfluxometria da veia hepática em pacientes com esteatose não alcoólica
Valéria Ferreira de Almeida e Borges1, Angélica Lemos Debs Diniz2, Helma Pinchemel Cotrim3, Haroldo Luis Oliva Gomes Rocha4, Frederico Chaves Salomão5
Objective: To evaluate the correlation between right hepatic vein Doppler flowmetry and degree of steatosis, inflammation and fibrosis at biopsy in nonalcoholic fatty liver disease. Materials and Methods: Doppler ultrasonography was performed in 80 patients divided into two groups as follows: 40 patients diagnosed with nonalcoholic fatty liver disease and also submitted to biopsy, and a control group including 40 healthy adults with no risk factor for nonalcoholic fatty liver disease. The Doppler waveform patterns of right hepatic vein were classified into triphasic, biphasic and monophasic. Biopsy specimens were classified according to the degree of steatosis, inflammation and fibrosis. Results: Triphasic flow was observed in 38 (95%) patients of the control group and in nine (56%) patients with mild steatosis, whereas in patients with severe steatosis, the pattern was monophasic in 60%. A statistically significant difference was observed in the distribution of Doppler patterns (p < 0.01). A significant negative correlation between the Doppler waveform pattern of right hepatic vein and steatosis degree was observed (r = 0.57; p < 0.01). Conclusion: An abnormal Doppler waveform pattern of right hepatic vein in patients with nonalcoholic fatty liver disease may suggest the presence of decreased vascular compliance caused by fatty infiltration.
Keywords: Fatty liver; Hepatic steatosis; Ultrasonography; Doppler flowmetry; Hepatic vein; Liver biopsy.
Objetivo: Avaliar a correlação entre a dopplerfluxometria da veia hepática direita e o grau de esteatose, inflamação e fibrose à biópsia na doença hepática gordurosa não alcoólica. Materiais e Métodos: Foi realizada ultrassonografia com Doppler em 80 pacientes, sendo 40 portadores de doença hepática gordurosa não alcoólica, também submeti-dos à biópsia. Quarenta controles normais saudáveis, sem fatores risco para doença hepática gordurosa não alcoólica foram submetidos a ultrassonografia com Doppler. O padrão ao Doppler da veia hepática direita foi classificado em trifásico, bifásico e monofásico. Os espécimes de biópsia foram classificados conforme o grau de esteatose, inflama-ção e fibrose. Resultados: O fluxo foi trifásico em 38 (95%) dos controles e em 9 (56,3%) dos pacientes com estea-tose discreta, enquanto nos com esteaestea-tose acentuada o padrão foi monofásico em 60%. Encontrou-se diferença sig-nificante na distribuição dos padrões ao Doppler (p < 0,01). Houve correlação negativa e significante entre o padrão ao Doppler da veia hepática direita e grau de esteatose (r = –0,57; p < 0,01). Conclusão: A alteração do padrão ao Doppler da veia hepática direita em pacientes com doença hepática gordurosa não alcoólica pode sugerir redução da complacência vascular consequente a infiltração gordurosa.
Unitermos: Fígado gorduroso; Esteatose hepática; Ultrassonografia; Dopplerfluxometria; Veia hepática; Biópsia hepática. Abstract
Resumo
* Study developed at Universidade Federal de Uberlândia (UFU), Uberlândia, MG, Brazil.
1. Master, MD, Unit of Gastroenterology at Universidade Fe-deral de Uberlândia (UFU), Uberlândia, MG, Brazil.
2. PhD, Associate Professor, School of Medicine and Program of Post-graduation in Health Sciences, Universidade Federal de Uberlândia (UFU), Uberlândia, MG, Brazil.
3. Post-doctorate, Associate Professor, School of Medicine of Bahia, Coordinator for the Program of Post-graduation in Medi-cine and Health, Universidade Federal da Bahia (UFBA), Salva-dor, BA, Brazil.
4. Fellow Master degree, MD, Unit of Gastroenterology, Uni-versidade Federal de Uberlândia (UFU), Uberlândia, MG, Brazil. 5. Professor of Pathology at Faculdade Atenas, Paracatu, MG, Brazil.
Mailing Address: Dra. Angélica Lemos Debs Diniz. Avenida Getúlio Vargas, 909, Centro. Uberlândia, MG, Brazil, 38400-299. E-mail: [email protected]
Received October 13, 2010. Accepted after revision Decem-ber 8, 2010.
Borges VFA, Diniz ALD, Cotrim HP, Rocha HLOG, Salomão FC. Hepatic vein Doppler flowmetry in patients with nonalcoholic steatosis. Radiol Bras. 2011 Jan/Fev;44(1):1–6.
INTRODUCTION
Steatosis is chemically defined as he-patic triglyceride content greater than 5% of the hepatic volume or of the liver weight(1) or, histologically, when 5% or more of the hepatocytes contain triglycer-ides(2).
Ultrasonography is the imaging method most frequently indicated in the diagnosis and evaluation of hepatic steatosis, consid-ering its noninvasiveness, wide availabil-ity and low cost(3–5).
MATERIALS AND METHODS
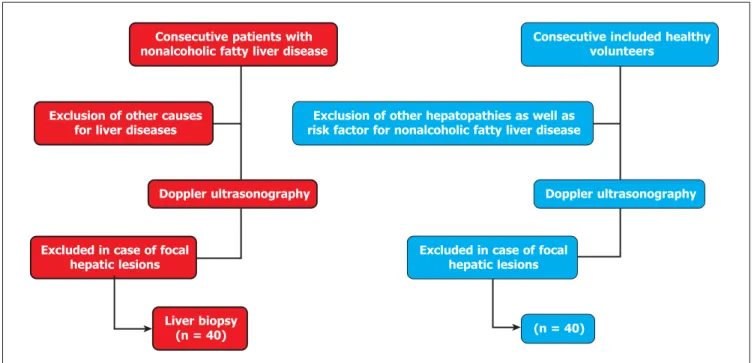
This is an observational study, in which the data were prospectively collected. It was developed in a single research center at Universidade Federal de Uberlândia (UFU), Uberlândia, MG, Brazil. The vol-unteers were consecutively included (Fig-ure 1). The study was approved by the UFU Committee for Ethics in Research under number 065/08. Only those patients who signed a term of free and informed consent after verbal explanation were included in the present study.
In the period between October/2008 and November/2009, 182 patients with nonalcoholic fatty liver disease were evalu-ated at the fatty liver unit of Hospital das Clínicas of UFU. Among those patients, 40 were included in the present study after clinical evaluation, laboratory tests, ultra-sonography and histopathological evalua-tion of liver fragments obtained by biopsy, thus constituting the group of steatotic pa-tients.
Also, a group with 40 healthy volun-teers without risk factors for nonalcoholic fatty liver disease, with minimal or no al-cohol ingestion, neither diabetes nor obe-sity were included as a (nonsteatotic) con-trol group. Such concon-trol group was submit-ted to the same evaluations as the patients
with the disease, except for hepatic biopsy, for ethical reasons.
All the volunteers in the steatotic group met the specific inclusion and exclusion criteria described below. The volunteers included in the control group met the same exclusion and inclusion criteria, except for the presence of hepatic steatosis at ultra-sonography. Additionally, for the control group, any evidence of insulin resistance and risk factor for nonalcoholic fatty liver disease were exclusion criteria.
Inclusion criteria were the following: presence of steatosis at US; age between 18 and 70 years, both sexes; written consent after verbal explanation.
Exclusion criteria were: alcohol inges-tion > 140 g/week for men and > 70 g/week for women(7); use of drugs known to be hepatotoxic, such as tetracycline, amio-darone, tamoxifen and alpha-methyldopa; presence of chronic viral hepatitis B or C; hemochromatosis; Wilson’s disease; defi-ciency of alpha-1-antitrypsin; autoimmune hepatitis; other chronic liver diseases, por-tal hypertension, cirrhosis, ascites and liver failure; any form of coagulation disorder, no matter how slight it might be; presence of heart disease, acute coronary, cerebral or peripheral ischemia; presence of respira-tory failure, kidney disease, ectopic or ab-sent right kidney; focal hepatic lesions;
focal renal lesions, which might interfere with the comparison between liver and kidney;pregnancy and lactation; refusal to participate in the study.
Clinical evaluation
Demographic data and the anthropo-metric measurements such as weight and height were obtained during outpatient consultations. The body mass index (BMI) was calculated by means of the Quetelet’s formula: BMI = weight in kg/(height in m2). Waist circumference was measured in
centimeters, by utilizing an inelastic tape, at the midpoint located between the last rib and the iliac crest, at the end of normal expiration. The circumference of the hip was measured at the level of the greatest gluteal protuberance. The waist/hip ratio was obtained by the division of waist cir-cumference by the hip circir-cumference.
Laboratory tests
The following tests were performed: complete blood count, plasma lipid profile, coagulation, total protein and fractions, aspartate aminotransferase, alanine ami-notransferase, alkaline phosphatase, gamma-glutamyltransferase, total bilirubin and fractions, glucose, insulin, markers for hepatitis B and C, autoantibodies, serum copper and ceruloplasmin and iron profile.
Figure 1. Flowchart representing the inclusion of individuals in the study.
Excluded in case of focal hepatic lesions Consecutive patients with
nonalcoholic fatty liver disease
Consecutive included healthy volunteers
Exclusion of other causes for liver diseases
Exclusion of other hepatopathies as well as risk factor for nonalcoholic fatty liver disease
Doppler ultrasonography Doppler ultrasonography
Excluded in case of focal hepatic lesions
Liver biopsy
(n = 40) (n = 40)
Evaluation of insulin resistance
For the cases that did not met DM2 di-agnostic criteria, and did not present gly-cemic risk for diabetes, the HOMA-IR (ho-meostasis model assessment for insulin resistance) index was calculated. For such purpose, material for insulin and glycemic tests was collected after fasting and the calculations were made according to the following formula: glycemia (mg/dl) × in-sulin (UI/ml) ÷ 405(8).
Sonographic evaluation
All the 80 patients were submitted to Doppler ultrasonography, with 2–5 MHz multifrequency transducer (Voluson 730 Pro V; General Electric, Milwaukee, WI, USA).
The patients were examined under fast-ing conditions, between 8:00 and 10:00 a. m., in dorsal decubitus, with arms ex-tended besides their head.
All liver segments were scanned, and the presence of vascular malformations, cysts, focal parenchymal lesions was ruled out.
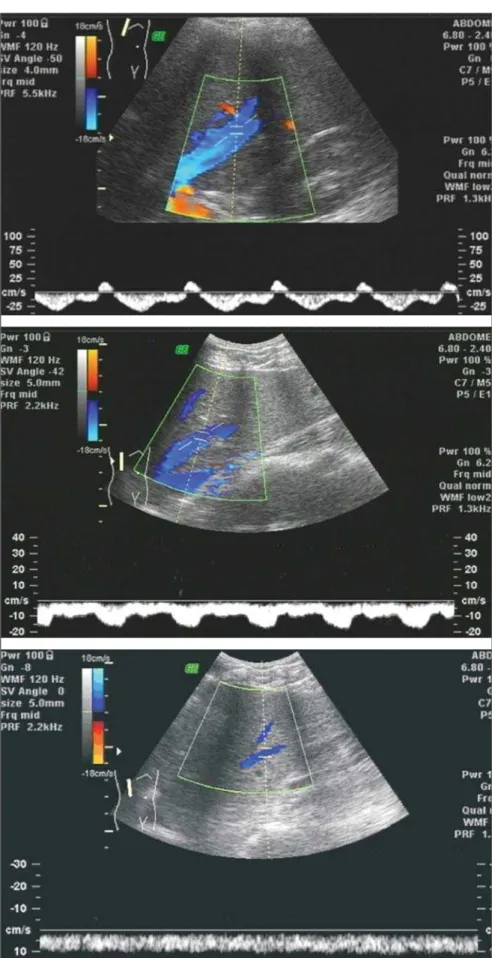
The color Doppler mode was utilized for identification of the hepatic veins, and to evaluate their pulsatility pattern and flow direction. The evaluation of the right he-patic vein was standardized at the level of the 10th or 11th right intercostal space dur-ing a short breath-hold period, at a distance of 2.0 cm distal to the hepatic veins conflu-ence, to avoid artifacts in the waveform pattern. The analysis was recorded for at least four cardiac cycles (approximately 6 seconds). The transducer angle was 30°. The waveform patterns were classified into three groups: normal triphasic waveform with a short reversed flow,biphasic wave-form without reversed flow but fluttering of more than 10% of the mean phasic am-plitude, and monophasic flat waveform with fluttering of < 10% of the mean pha-sic amplitude (Figure 2). Because of alter-ations in the vessel diameter, of up to 2 mm per cardiac cycle at systole and diastole, besides different flow directions, veloci-metry in the hepatic veins was not calcu-lated.
Histological evaluation
Hepatic biopsy specimens were col-lected under US guidance by means of
Trucut needle, at the right hepatic lobe. The hepatic tissue fragment with approximately 10 mm was fixed in 4% formol-saline and stained with hematoxylin-eosin and Masson’s trichrome techniques according to the method adopted at the division of Pathological Anatomy of Hospital das Clínicas of UFU. A single observer, an ex-perienced pathologist, performed a blind evaluation of the material. The biopsy was performed one week after the ultrasonog-raphy.
The histopathological evaluation was based on the reviewed standardized classi-fication of the Pathology Committee of the NASH Clinical Research Network(2), which designated and validated the histo-logic characteristics and a score system for nonalcoholic fatty liver disease activity, for the purposes of clinical studies.
The histopathological variables were described and subdivided into hepatocellu-lar changes, fibrosis and inflammatory in-filtrate. The hepatocellular changes that were systematically searched were the fol-lowing: steatosis, hepatocellular balloon-ing and Mallory bodies. Steatosis was clas-sified as mild (up to 33% of hepatocytes infiltrated by fat droplets), moderate (from 33% to 66%) and severe (more than 66% of fatty infiltration in the hepatocytes). The inflammatory infiltrate intensity was clas-sified into mild, moderate and accentuated. Fibrosis was described according to loca-tion in the hepatic acinus, appearance and intensity.
Statistical analysis
The statistical analysis was performed with the aid of the software Statistical Package for the Social Sciences (SPSS for Windows, version 16.0) (SPSS Inc.; Chi-cago, IL, USA).
The Lilliefors normality test was uti-lized in the analysis of the data distribution. The continuous variables were expressed as mean ± standard deviation, median and quartiles, as appropriate, and compared by means of the analysis of variance between means (ANOVA) and Tukey’s range test for post-hoc analysis. The categorical vari-ables were expressed by absolute (n) and relative frequencies, and were analyzed by means of the Fisher’s and Mann-Whitney’s tests. The correlation analyses were
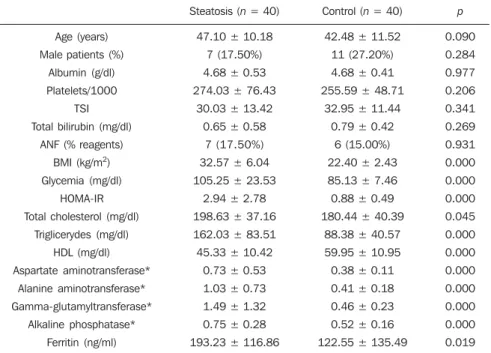
per-Table 1 Clinical and laboratory characteristics of the group with steatosis and the control group, ex-pressed in mean ± standard deviation, except for the categorical variables, exex-pressed, whenever indi-cated, in absolute and percentage frequencies.
Age(years) Male patients(%)
Albumin(g/dl) Platelets/1000
TSI Total bilirubin(mg/dl)
ANF(% reagents) BMI (kg/m2) Glycemia(mg/dl)
HOMA-IR Total cholesterol(mg/dl)
Triglicerydes(mg/dl) HDL(mg/dl) Aspartate aminotransferase* Alanine aminotransferase* Gamma-glutamyltransferase* Alkaline phosphatase* Ferritin (ng/ml)
Steatosis (n = 40)
47.10 ± 10.18 7 (17.50%) 4.68 ± 0.53 274.03 ± 76.43
30.03 ± 13.42 0.65 ± 0.58
7 (17.50%) 32.57 ± 6.04 105.25 ± 23.53
2.94 ± 2.78 198.63 ± 37.16 162.03 ± 83.51 45.33 ± 10.42
0.73 ± 0.53 1.03 ± 0.73 1.49 ± 1.32 0.75 ± 0.28 193.23 ± 116.86
Control (n = 40)
42.48 ± 11.52 11 (27.20%) 4.68 ± 0.41 255.59 ± 48.71
32.95 ± 11.44 0.79 ± 0.42
6 (15.00%) 22.40 ± 2.43 85.13 ± 7.46 0.88 ± 0.49 180.44 ± 40.39
88.38 ± 40.57 59.95 ± 10.95 0.38 ± 0.11 0.41 ± 0.18 0.46 ± 0.23 0.52 ± 0.16 122.55 ± 135.49
p 0.090 0.284 0.977 0.206 0.341 0.269 0.931 0.000 0.000 0.000 0.045 0.000 0.000 0.000 0.000 0.000 0.000 0.019
TSI, transferrin saturation index in %; ANF, anti-nuclear factor; BMI, body mass index; HOMA-IR, homeostasis model assessment for insulin resistance; HDL, high density lipoprotein. * The hepatic enzymes were described in relation to the respective upper normality limit.
formed by utilizing the Spearman coeffi-cient.
All significance tests were bilateral, adopting a significance level of 0.05 (α = 5%), with descriptive levels (p) lower than this value being considered as statistically significant.
RESULTS
Clinical characterization of patients and controls
The clinical characteristics of steatotic patients as compared with controls are shown on Table 1.
The groups were paired with respect to age and sex. The ages of volunteers in the control group ranged from 27 to 70 years, with a mean age of 42.48 ± 11.52 years. The mean age of the steatotic patients was 47.10 ± 10.18 years. By utilizing the vari-ance analysis (ANOVA for one variable) no significant difference was found between mean ages (p = 0.061). The control group comprised 11 men and 29 women, while the steatotic group comprised seven men and 33 women. By utilizing the Fisher’s test, no statistically significant difference was observed between these ratios (p =
0.284). No statistically significant differ-ence was found between the groups with respect to the albumin serum level, biliru-bin, platelet count and transferrin saturation index.
The patients with nonalcoholic fatty liver disease presented altered obesity, dyslipidemia, insulin resistance, hepatic enzymes indices and ferritin levels as com-pared with the control group.
Histological evaluation
The histological evaluation was only performed in the group of diseased pa-tients, confirming the presence of steatosis in all of them. Among those patients, 16 presented mild steatosis, i.e., with up to 33% of affected hepatocytes; 19 presented moderate steatosis (33% to 66% of affected hepatocytes); and five presented severe ste-atosis, with more than 66% of the hepato-cytes infiltrated by fat droplets.
Sonographic evaluation
Differences were observed in the he-patic vein flow velocity waveform pattern at Doppler between the steatotic and the control groups. In the control group, the predominant waveform pattern was tripha-sic, while in the group with the disease the pattern was either biphasic or monophasic. At Doppler, 22 of 40 steatotic patients (55%) presented abnormal hepatic vein pattern, with 16 (40%) with monophasic pattern and six (15%) with biphasic pat-tern.
At Mann-Whitney test, the difference in the frequency of the abnormal hepatic vein flow velocity waveform pattern between the two groups was statistically significant (p < 0.0001).
A reversed and statistically significant correlation between the fatty infiltration degree and the hepatic vein flow velocity waveform pattern was observed (r = –0.57 ± 0.08; p < 0.01).
The difference in the frequency of the abnormal hepatic vein flow velocity wave-form pattern among the subgroups of steatotic patients was not statistically sig-nificant (p = 0.33). Table 2 demonstrates the distribution of flow velocity waveform patterns according to the degree of steato-sis detected at histology.
DISCUSSION
Nonalcoholic fatty liver disease is a common cause of chronic hepatopathy in insulin-resistant individuals(9). The disease presentations range from steatosis, with possible progression to steatohepatitis, fi-brosis, cirrhosis and hepatocellular carci-noma(10). At ultrasonography, the most fre-quent presentation is the finding with an appearance suggestive of steatosis(11).
In the present study, a control group of individuals with no risk factor risk for non-alcoholic fatty liver disease was utilized for comparison. Such group was confirmed to be comprised of healthy individuals, with-out any sign characterizing insulin resis-tance, which clearly differentiated it from the group of patients with the disease. The mean HOMA-IR index for the healthy vol-unteers was quite low (0.88) and the cut-off point between the control group and the group with the disease (> 1.35) was lower
Dietrich et al.(14), in a study published in 1998, demonstrated that the relationship between the left hepatic lobe and the heart, often leads to artifacts in the Doppler sig-nal, particularly because of heart motion. For this reason, the evaluation of the left hepatic vein, particularly, is not always re-liable. In 35 of 135 patients the evaluation of the middle hepatic vein was only possible during deep inspiration, with respiration artifacts initially producing a monophasic flow velocity waveform, then changing to biphasic and triphasic during the examina-tion. The most reproducible evaluation of the flow velocity waveform was obtained on the right hepatic vein through the inter-costal pathway, at a 30º angle, as performed in the present study.
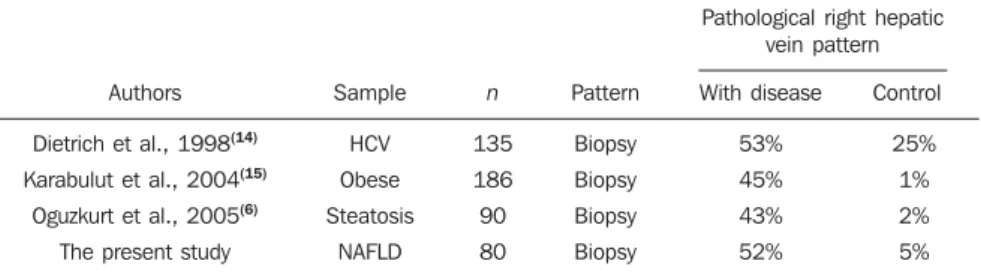
Other studies approaching hepatic vein flow velocity waveform also have not found its capacity to differentiate groups with the disease (Table 3), finding frequen-cies similar to those observed in the present study regarding the pathological hepatic vein pattern in patients with the disease and in the controls(6,14,15).
CONCLUSION
The triphasic hepatic vein flow veloc-ity waveform pattern was more frequent in the controls as compared with the diseased patients. However, no statistically signifi-cant difference was observed between the than the ones reported in other Brazilian
studies(10,11).
In the present sample, the mean values for hepatic enzymes in relation to the up-per normal limit demonstrated to be com-patible with very subtle increases, with normal aminotranferases levels in most of the cases, as already described in the litera-ture. On the other hand, at histology, all the patients submitted to biopsy met some cri-teria for nonalcoholic steatohepatitis, con-firming, as previously known, that hepatic enzymes are falsely normal in the majority of such patients(12,13).
In the setting of portal hypertension, the clinical value of Doppler in the hepatic and portal veins hemodynamics is well estab-lished. On the other hand, the contribution of steatosis, inflammation and fibrosis in the setting of nonalcoholic fatty liver dis-ease, to change the hepatic and portal veins flow velocity waveform is the focus of more recent interest.
In the present study, Doppler ultra-sonography and hepatic biopsy were pro-spectively performed in a same week, in a group of volunteers with diffuse and homo-geneous steatosis caused by nonalcoholic fatty liver disease, with the objective of reducing eventual biases. Other conditions that might interfere with Doppler, such as pregnancy, cardiac failure, valvulopathies and chronic pulmonary disease, were ruled out.
Table 2 Distribution of the right hepatic vein flow waveform patterns at Doppler, in the control group and in the group with steatosis at biopsy, expressed in absolute and percentage frequencies.
Group Control Mild steatosis Moderate steatosis Severe steatosis Monophasic pattern 1 (2.5%) 5 (31.3%) 8 (42.1%) 3 (60.0%) Biphasic pattern 1 (2.5%) 2 (12.5%) 3 (15.8%) 1 (20.0%) Triphasic pattern 38 (95.0%) 9 (56.3%) 8 (42.1%) 1 (20.0%) Total 40.0 16.0 19.0 5.0
Table 3 Characteristics and partial results of the main published studies utilizing the hepatic vein flow pattern, as compared with the present study.
Authors
Dietrich et al., 1998(14) Karabulut et al., 2004(15)
Oguzkurt et al., 2005(6) The present study
Sample HCV Obese Steatosis NAFLD n 135 186 90 80 Pattern Biopsy Biopsy Biopsy Biopsy
Pathological right hepatic vein pattern With disease 53% 45% 43% 52% Control 25% 1% 2% 5%
right hepatic vein flow velocity waveform patterns in the three steatotic sub-groups.
REFERENCES
1. Hoyumpa AM Jr, Greene HL, Dunn GD, et al. Fatty liver: biochemical and clinical consider-ations. Am J Dig Dis. 1975;20:1142–70. 2. Kleiner DE, Brunt EM, Van Natta M, et al.
De-sign and validation of a histological scoring sys-tem for nonalcoholic fatty liver disease. Hepa-tology. 2005;41:1313–21.
3. Saadeh S, Younossi ZM, Remer EM, et al. The utility of radiological imaging in nonalcoholic fatty liver disease. Gastroenterology. 2002;123: 745–50.
4. Hamaguchi M, Kojima T, Itoh Y, et al. The sever-ity of ultrasonographic findings in nonalcoholic fatty liver disease reflects the metabolic syndrome and visceral fat accumulation. Am J Gastroenterol. 2007;102:2708–15.
5. Charatcharoenwitthaya P, Lindor KD. Role of ra-diologic modalities in the management of
non-alcoholic steatohepatitis. Clin Liver Dis. 2007;11: 37–54, viii.
6. Oguzkurt L, Yildirim T, Torun D, et al. Hepatic vein Doppler waveform in patients with diffuse fatty infiltration of the liver. Eur J Radiol. 2005; 54:253–7.
7. Farrell GC, George J, Hall PM, et al. Fatty liver disease: NASH and related disorders. Oxford, UK: Blackwell Publishing; 2005.
8. Turner RC, Holman RR, Matthews D, et al. In-sulin deficiency and inIn-sulin resistance interaction in diabetes: estimation of their relative contribu-tion by feedback analysis from basal plasma in-sulin and glucose concentrations. Metabolism. 1979;28:1086–96.
9. Cusi K. Role of insulin resistance and lipotoxicity in non-alcoholic steatohepatitis. Clin Liver Dis. 2009;13:545–63.
10. Guidorizzi de Siqueira AC, Cotrim HP, Rocha R, et al. Non-alcoholic fatty liver disease and insu-lin resistance: importance of risk factors and his-tological spectrum. Eur J Gastroenterol Hepatol. 2005;17:837–41.
11. Geloneze B, Vasques AC, Stabe CF, et al. HOMA1-IR and HOMA2-IR indexes in identi-fying insulin resistance and metabolic syndrome: Brazilian Metabolic Syndrome Study (BRAMS). Arq Bras Endocrinol Metabol. 2009;53:281–7.
12. Browning JD, Szczepaniak LS, Dobbins R, et al. Prevalence of hepatic steatosis in an urban popu-lation in the United States: impact of ethnicity. Hepatology. 2004;40:1387–95.
13. Suzuki A, Lymp J, Sauver JS, et al. Values and limitations of serum aminotransferases in clini-cal trials of nonalcoholic steatohepatitis. Liver Int. 2006;26:1209–16.
14. Dietrich CF, Lee JH, Gottschalk R, et al. Hepatic and portal vein flow pattern in correlation with intrahepatic fat deposition and liver histology in patients with chronic hepatitis C. AJR Am J Roentgenol. 1998;171:437–43.