Introduction
Cycling is one of the most traditional sports in the world, es-pecially in Europe, where the “Tour de France” is a renowned event worldwide1 . Cycling is an Olympic sport divided into track (velodrome) and street racing (road), where individuals compete either individually or in teams2. Track races include short-distance (200 m), medium-distance (~50 km) and long-distance events (~250 km).
According to Ronnestad and Ellefsen3, maximal oxygen uptake (VO2 max), economy of movement and lactic anaerobic power (i.e., in sprints) are the main indicators of performance in road cycling. It is important to note that the difference between victory and defeat in many road cycling events can be deter-mined in the inal sprint, which requires great lactic anaerobic power from athletes. Thus, it is important to analyze factors that interfere with the lactic anaerobic power of road cyclists. Road cycling is categorized as an endurance cycle sport4.
Ronnestad and Ellefsen3 emphasize the importance of identifying factors that interfere with cyclists’ performance. According to these authors, certain physical training techniques (i.e., block periodization) and nutritional ergogenic aids tend to have a positive effect. However, certain aspects that have a negative repercussion on the performance of athletes practic-ing endurance cycle sports have been revealed5, such as poor quality of sleep and inadequate recovery. Moreover, recently,
Bratland-Sanda and Sundgot-Borgen6 and El Ghoch, Soave, Cafugi and Grave7 emphasized the possibility of disordered eating behaviors (DEBs) reducing athletes’ performance. Most importantly, to the best of our knowledge, no studies aiming to conirm the statements made by Bratland-Sanda and Sundgot-Borgen6 and El Ghochet al.7 have been conducted until now.
DEBs are unhealthy methods used to reduce body mass8: long periods without consuming foods, use of laxatives/diuretics/ appetite suppressants, use of plastic clothes to cause dehydration during physical training sessions, and self-induced vomiting9. Evidence reveals that approximately 25% of male athletes prac-ticing endurance sports adopt DEBs as a way to reduce body mass10-12. According to Chapman and Woodeman10, trainers frequently associate body mass reduction with improvement in physical performance, thus justifying DEBs among athletes. Furthermore, clothing that accentuates body shape (i.e., cycling clothes) can cause feelings of embarrassment and, as a result, lead athletes to adopting DEBs to reduce body mass9.
Durguerianet al.13 investigated 11 Olympic lifters. Fast body mass reduction (~5%) was induced through certain DEBs in the week prior to a competitive event. The present study did not reveal a difference in anaerobic performance after nutritional intervention, thus suggesting that adopting DEBs for fast body mass reduction may not be an effective strategy to maximize athletes’ performance. However, until this mo-ment no studies analyzing the relationship between DEBs and Original Article (short paper)
Can power and anaerobic capacity
reduce according to disordered
eating behaviors in cyclists?
Leonardo de Sousa Fortes
Lilyan Carla Vaz Mendonça
Pedro Pinheiro Paes
Universidade Federal de Pernambuco, Recife, PE, Brasil
Jeferson Macedo Vianna
Universidade Federal de Juiz de Fora, Juiz de Fora, MG, Brasil
Fernando Diefenthaeler
Universidade Federal de Santa Catarina, Florianópolis, SC, Brasil
Abstract — The present study aimed to compare the power, anaerobic capacity (AC) and performance in a road bicycle race among cyclists with and without risk of disordered eating behaviors (DEB). The sample was selected in a non-probabilistic way, totaling 69 male road cyclists aged between 19 and 30 years. The Wingate test was used to evaluate peak power (PP) and mean power. Time in minutes was adopted to determine performance in a 120-km road cycling race (competitive event). The Eating Attitudes Test (EAT-26) was completed to assess DEBs. The results did not indicate a difference in PP among cyclists with and without risk of DEBs (F(2, 67)=3.92; p=0.13). Findings showed a difference in mean power among cyclists with and without risk of DEBs (F(2, 67)=36.43; p=0.01). The results revealed a difference in performance in 120-km cycling races among cyclists with and without risk of DEBs (F(2, 67)=46.03; p=0.01). It could be concluded that DEBs were associated with a lower mean power and performance in a competitive event among male road cyclists, although the same was not true for PP.
physical performance have been performed with endurance cycle sport athletes.
From a more practical perspective, this type of investigation contributes to the area of sports science, as the identiication of factors that inluence athletes’ physical performance is con -sidered to be essential. According to what has been described here, the present study compared the power, anaerobic capacity and performance in road cycling races among cyclists with and without risk of DEBs. Consequently, based on the recommenda-tions from Bratland-Sanda and Sundgot-Borgen6 and El Ghoch et al.7, the following three hypotheses were formulated: a) cyclists at risk of DEBs show lower alactic anaerobic power than those without risk; b) cyclists at risk of DEBs show lower AC than those without risk; and c) cyclists at risk of DEBs show lower performance in road events than those without risk.
Methods
Participants
The study sample was selected in a non-probabilistic way, totaling 76 male cyclists aged between 19 and 30 years, participating in the Brazilian national road cycling championship. Cyclists trained
three hours per day on average, ive times per week. Inclusion
criteria were as follows: a) to have been a cycling athlete for at least two years; b) to systematically train road cycling for at least ten hours per week; c) to have signed up for the national champi-onship organized by the Brazilian Cycling Federation; and d) to
be available to respond to the questionnaire, and to participate in
anthropometric measurements and the anaerobic performance test (Wingate test). However, seven athletes were excluded as they did
not fully complete the questionnaire or did not participate in the test. As a result, this study included a inal sample of 69 cyclists.
After receiving information about the procedures to which they would be submitted, participants signed an informed con-sent form, agreeing with the methodological procedures from this study. The procedures adopted in the present study met the Helsinki norms for human research. This research project was approved by the Human Research Ethics Committee.
Experimental procedures
Authorization was requested from the Brazilian Cycling Federation to perform data collection during a competitive event. Consequently, a meeting was held with cyclists to explain all the ethical procedures of this study.
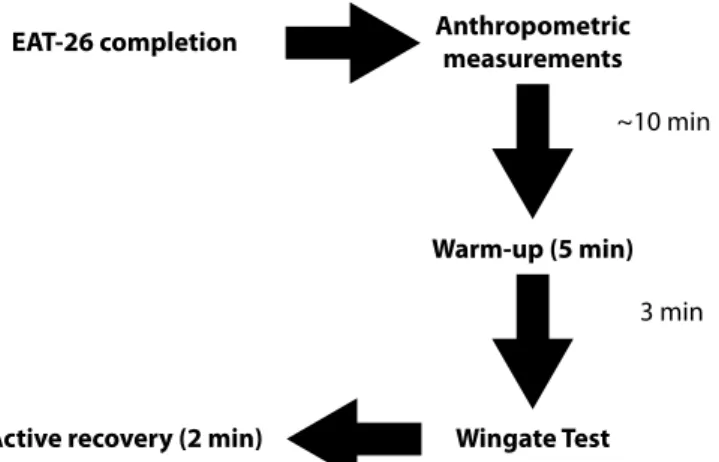
Data collection was performed in two stages on a single day (Figure 1). In the irst stage, athletes responded to the Eating Attitudes Test questionnaire (EAT-26, Bighetti, Santos, Santos, Ribeiro14) and subsequently participated in the anthropometric measurements (body mass, height and skin folds). It should be emphasized that athletes received the same instructions verbally and their questions were answered. Additionally,
EAT-26 completion Anthropometric measurements
Warm-up (5 min)
Wingate Test Active recovery (2 min)
3 min ~10 min
Figure 1. Experimental design of the present study.
written instructions about how to complete the questionnaire were included. In the second stage, athletes performed the AC and power test.
Measurements
The Wingate test was used15 to assess peak power(PP) and mean power. According to indings from Bertuzzi, Kiss,Damasceno, Oliveira and Lima-Silva16, PP and mean power can be considered as indicators of anaerobic power and capacity, respectively. A cycle ergometer with an electromagnetic braking system was used (Ergometric 6.0, Ceise, Brazil) to perform the Wingate test. Cyclists remained seated during this test. A warm-up was performed for ive minutes, at a cadence of 60 rpm with a constant load of 50 W and sprints from three to ive seconds at the end of every minute, as recommended by Inbar, Bar-Or and Skinner17. An interval of three minutes between the end of the warm-up and beginning of the Wingate test was adopted. Consequently, participants were instructed to pedal at maximum speed for 30 seconds against a resistance of 7.5% of their body mass17. Verbal encouragement was given throughout the test. Cyclists were asked to maintain a cadence of pedaling of 120 rpm to begin the Wingate test, aiming to reduce the cycle ergometer’s inertia, fol-lowing the methodology used in the study performed by Moro et al.18. External power was calculated every one second. The highest external power in the irst ive seconds of the Wingate test was used to show PP, while mean power was that obtained during 30 seconds17. It should be emphasized that all athletes were familiar-ized about the Wingate test, thus preventing the learning effect. At the end of this test, cyclists pedaled for two minutes at a cadence of 50 rpm and with a load of 50 W, aiming to recover from fatigue.
Time was calculated in minutes to determine performance in the 120-km road cycling race (competitive event). It should be emphasized that the time of each cyclist for this event was made available by the Brazilian Cycling Federation, after consulting the oficial race records.
bulimia and concern for food—episodes of food compulsion, followed by purgative behavior to lose/control body weight; and 3) oral self-control—self-control of food and the environmental and social forces promoting food consumption. For each EAT-26 item, participants had six response options that varied from 0 (few times, almost never and never) to 3 (always). The EAT-26 score is obtained from the sum of its items. The higher the score, the greater the risk of eating disorders. Moreover, it is possible to classify respondents according to the risk of such disorders, i.e., scores equal to or higher than 21 in the EAT-26 indicate risk of triggering eating disorders. In the validation study, Bighetti, Santos, Santos, Ribeiro14indicated an internal consistency of 0.82. Internal consistency was assessed by Cronbach’s alpha and found to be 0.86 for the present sample.
A portable scale (Tanita® BC-601, São Paulo, Brazil) and stadiometer (Welmy®, Santa Bárbara do Oeste, Brazil) were used to determine body mass and height, respectively. Body mass index (BMI) was calculated according to the following formula: BMI=body mass (kg)/height (m)². Body density was determined through the skinfold thickness technique with a sci-entiic caliper (Lange©, Washington, USA), including tricipital, pectoral and subscapular skinfolds and adopting Jackson and Pollock’s protocol (1978) 19. The International Society for the Advancement of Kinanthropometry’s20 standards (2013) were used to measure skinfolds. Percentage of body fat (%G) was determined with Siri’s equation (1956)21.
Data analysis
Levene’s test was used to test homoscedasticity, while data sphericity was found through Mauchly’s test. When the latter assumption was violated, Greenhouse–Geisser correction was adopted. Due to non-parametric violation, central trend mea-sures (mean) and dispersion (standard deviation and standard error) were used to describe variables in this study. Multivariate covariance analysis (MANOVA) was performed to compare PP, mean power and performance in a 120-km race among cyclists at risk (EAT-26≥21) and without risk (EAT-26<21) for DEBs. It should be emphasized that age was statistically controlled. The Cohen effect size was used, represented by the letter “d” to show differences from a more practical point of view. According to Thalheimer and Cook’s22 recommendations, the following criteria were used: d< 0.4 = small effect size, 0.4 ≤ d> 0.8 = moderate effect size, and d ≥ 0.8 = large effect size. The Pearson correlation was used to relatethe PP, mean power, and perfor-mance 120-km race with EAT-26 scores. All data were treated with SPSS 21.0, considering a signiicance level of 5%.
Results
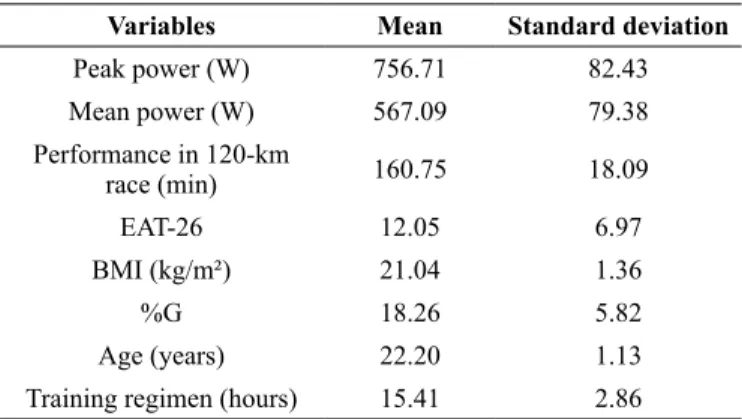
Descriptive data [PP, mean power, performance in the 120-km race, EAT-26, BMI, %G, age, and training regimen (weekly training frequency × daily training hours)] are shown in Table 1.
Findings from this study indicate that 30% of cyclists revealed risks for DEBs according to EAT-26 scores (≥21).
Table 1 Descriptive values (mean/standard deviation) of study vari-ables.
Variables Mean Standard deviation
Peak power (W) 756.71 82.43
Mean power (W) 567.09 79.38 Performance in 120-km
race (min) 160.75 18.09
EAT-26 12.05 6.97
BMI (kg/m²) 21.04 1.36
%G 18.26 5.82
Age (years) 22.20 1.13
Training regimen (hours) 15.41 2.86
Note. EAT-26 = Eating Attitudes Test; BMI = body mass index; %G = percentage of body fat.
Table 2 Mean and standard error of peak power, mean power and performance in 120-km race according to the dichotomous classiica -tions of the EAT-26.
Variable
Without a risk (EAT-26<21)
(n = 48)
With a risk (EAT-26≥21)
(n = 21)
Peak power (W) 742 (6) 745 (6)
Mean power (W) 569 (6)a 524 (5)
Performance in 120-km race (min) 9,532 (78)a 9,706 (81) Note. EAT-26 = Eating Attitudes Test; ap<0.05 related to the “with a risk”
group.
MANOVA results (Table 2) did not show a difference in PP between cyclists with and without risk of DEBs (F(2, 67) = 3.92; p = 0.13), revealing a small effect size (d = 0.1). In contrast, indings showed a difference in mean power between cyclists with and without risk of DEBs (F(2, 67) = 36.43; p = 0.01; d = 0.6). Similarly, the results revealed a difference in performance in the 120-km race between cyclists with and without risk of DEBs (F(2, 67) = 46.03; p = 0.01; d = 0.8). It should be noted that age showed collinearity with mean power (F(2, 67) = 7.11; p = 0.04), a fact that was not found for PP (F(2, 67) = 1.91; p = 0.29) or performance in the 120-km race (F(2, 67) = 1.74; p = 0.26).
The indings a revealed statistically signiicant relationship of mean power (R = 0.38; p = 0.01) and performance 120-km race (R = 0.49; p = 0.001) with DEBs. However, no relation-ship was found between PP and DEBs (R = 0.08; p = 0.32).
Discussion
Studies have indicated that approximately 25% of endurance sports athletes are at risk ofDEBs9-11, corroborating the indings from the present study. According to Fortes, Ferreira, Oliveira, Cyrino, Almeida12, there are peculiarities in the sports context that can cause one to show DEBs, such as pressure from trainers aiming to achieve better results and clothing that accentuates body shape. It seems that athletes usually associate sports per-formance optimization with body mass reduction9. Thus, some athletes can adopt DEBs as a strategy to quickly reduce body mass. However, it should be emphasized that the adoption of DEBs can be negatively associated with anaerobic performance6.
The results of the present study did not reveal a difference in PP between cyclists with and without DEBs, opposing the hypoth-eses initially formulated. According to El Ghoch,Soave, Cafugi, Grave7, muscle power can be reduced in athletes who show DEBs. El Ghoch, Soave, Cafugi, Grave7 emphasize that the adoption of DEBs can lead to a reduction in the speed that motor neurons inher-ent in high-endurance muscle ibers are recruited and a reduction in the speed of action of the creatine kinase enzyme. However, considering the fact that PP is an indicator of alactic anaerobic metabolism16 and that such metabolism lasts approximately ive seconds23, it is possible to assume that DEBs may not affect alactic anaerobic power in the lower limbs. It should be noted that some scientiic indings did not reveal a change in alactic anaerobic power after dehydration or fast body mass reduction13, which, in a way, can explain the results for PP in the present study. Most importantly, more studies are required to clarify the relationship between alactic anaerobic power and DEBs.
With regard to mean power, the results indicated a difference between cyclists with and without DEBs. Cyclists at risk of such disorders showed a lower mean power when compared to those without risk of this, corroborating the hypotheses of the present study. It should be emphasized that a moderate effect size was found, which means reasonable probability for this to be true for the population of road cyclists. According to El Ghoch,Soave, Cafugi, Grave7, the resynthesis of muscle glycogen can be compro-mised in athletes who adopt DEBs, aiming to reduce body mass. Thus, considering that anaerobic capacity requires a high level of stored muscle glycogen24, it could be assumed that adopting DEBs can lead to a reduction in mean power in the Wingate test, which may explain the indings from the present study. According to Durguerian,Bougard, Drogou, Sauvet, Chennaoul, Filaire13, athletes who quickly reduce body mass through unhealthy meth-ods (i.e., DEBs) can increase their psycho-physiological stress and subjective feeling of recovery and, as a result, become less tolerant to fatigue, which may, with some restrictions, be another explanation for the indings of mean power.
Regarding performance in the 120-km cycling race, indings revealed the difference between cyclists with and without risk ofDEBs. Cyclists at risk of DEBs showed poorer performance in the 120-km race when compared to those without risk ofsuch disorders, corroborating the hypotheses of the present study. It should be emphasized that a large effect size was found, which reveals a high probability that this fact could be inferred to the population of male road cyclists. Performance in a road cycling race is multi-factorial (aerobic itness, lactic aerobic power, econ-omy of movement, and pacing)3. Considering aerobic itness, it is
possible to assume that the adoption of DEBs can have negative effects on aerobic energy pathways. According to some authors9, the use of laxatives, diuretics and appetite suppressants results in an increase in blood viscosity, which can reduce cardiac output due to cardiovascular overload8. On the other hand, regarding pacing, it could be assumed that DEBs result in lack of control of cadence of intensity throughout long-term physical efforts. Considering the fact that success in road cycling depends on the amount of effort made during the race3, DEBs can have a negative effect on the pacing strategy adopted by cyclists.
From a practical point of view, PP is a good indicator of an athlete’s capacity to sprint for a short time, frequently used at certain moments of a road cycling race, especially the last 50 meters4. It seems that the capacity for short-distance sprinting can decide whether someone will win or lose in certain cycling events18. According to the results of the present study, the adop-tion of DEBs appears not to affect the capacity for short-distance sprinting among cyclists. On the other hand, according to Ronnestad, Hansen, Hollan, Ellefsen2, mean power is an excel-lent indicator of anaerobic capacity, which is frequently used in road cycling races. Thus, identifying factors that can negatively interfere in mean power is extremely important to inhibit the reduction in anaerobic capacity in cyclists. Considering the results of the present study, cyclists adopting DEBs can reduce their capacity to perform repeated sprints. In this sense, cyclists at risk ofDEBs require more time to recover between two bursts of high-intensity effort. Moreover, performance in long-duration events depends on aerobic itness and pacing capacity. Thus, considering the indings from the present study to be inherent in cyclists’ performance in 120-km races, it is very likely that cyclists who frequently adopt DEBs reduce their cadence during pedaling due to early fatigue.
Although the present study revealed new and interesting indings, there were some limitations: the use of a questionnaire as an assessment tool, so that the results may not relect reality due to subjective responses; and the doubly indirect method used to assess %G. Nonetheless, even with such limitations, this study revealed important indings about the effects that DEBs can have on road cyclists’ physical performance.
Practical application statement
In conclusion, DEBs were associated with lower anaerobic capacity and performance in a competitive event among male road cyclists, although the same is not true for alactic anaero-bic power. In other words, the results lead to conclude that lower AC and performance are more prevalent in male road cyclists with DEBs.
References
2. Ronnestad BR, Hansen J, Hollan I, Ellefsen S. Strength train-ing improves performance and pedaltrain-ing characteristics in elite cyclists. Scand J Med Sci Sports.2015;25(1): e89-e98. doi: 10.1111/sms.12257
3. Ronnestad BR, Ellefsen HS. Block periodization of high-intensity aerobic intervals provides superior training effects in trained cyclists. Scand J Med Sci Sports.2014;24(1): 34-42. doi: 10.1111/j.1600-0838.2012.01485.x
4. Sangali EB, Campos EZ, Gobbo LA, Andrade VL, Papoti M, Freitas-Júnior IF, Figueira TR, Balikian-Júnior P. Relationship between aerobic and performance indexis in short and me-dium competitions duration in elite cyclists. Rev. bras. cineantropom. desempenho hum. 2013;15(4): 498-506. doi: 10.5007/1980-0037.2013v15n4p498
5. Hellard P, Avalos M, Hausswirth C, Pyne D, Toussaint J, Mujika I. Identifying optimal overload and taper in elite swimmers over time. J Sports Sci Med. 2013;.12: 668-678.
6. Bratland-Sanda S, Sundgot-Borgen J. Eating disorders in athletes: Overview of prevalence risk factors and recommendations for prevention and treatment. Eur. J. Sport Sci. 2012;1(1): 1-10. doi: 10.1080/17461391.2012.740504
7. El Ghoch M, Soave F, Cafugi S, Grave D. Eating disorders, physi -cal itness and sport performance: A systematic review. Nutrients. 2013;5(5): 5140-5160. doi: 10.3390/nu5125140
8. BritoC. J, Roas AFM, Brito ISS, Marins JCB, Cordova C, Franchini E. Methods of body-mass reduction by combat sport athletes. Int J Sport NutrExercMetab. 2012;22(1): 89-97. 9. Papathomas A, Petrie T. Editorial: Towards a more sophisticated
approach to eating disorders in sport research. PsycholSportExerc. 2014;15: 675-679. doi: 10.1016/j.psychsport.2014.06.006 10. Chapman J, Woodman T. Disordered eating in male
ath-letes: a meta-analysis. J. Sports Sci. 2015. in press. doi: 10.1080/02640414.2015.1040824
11. Fortes LS, Almeida SS, Ferreira MEC. Inluence of psychological, anthropometric and sociodemographic factors on the symptoms of eating disorders in young athletes. Paidéia.2014;24(57): 21-27. doi: 10.1590/1982-43272457201404
12. Fortes LS, Ferreira MEC, Oliveira SMF, Cyrino ES, Almeida SS. A socio-sports model of disordered eating among Brazilian male athletes. Appetite. 2015;92(1): 29-35. doi: 10.1016/j. appet.2015.05.005
13. Durguerian A, Bougard C, Drogou C, Sauvet F, Chennaoul M, Filaire E. Weight loss, performance and psychological related states in high-level weighlifters. Int J Sports Med. 2015. in press. doi: 10.1055/s-0035-1555852
14. Bighetti F, Santos CB, Santos JE, Ribeiro RPP. Tradução e avalia -ção do eating attitudes test em adolescentes do sexo feminino de Ribeirão Preto, São Paulo. J. bras. Psiquiatr. 2004;53(6): 339-46. 15. Bar-Or O. The Wingate anaerobic test. An update on methodol-ogy, reliability and validity. Sports Med. 1987;4: 381-394, doi: 10.2165/00007256-198704060-00001
16. Bertuzzi R, Kiss MAPDM, Damasceno M, Oliveira RSF, Lima-Silva AE. Association between anaerobic components of the maximal accumulated oxygen deficit and 30-second Wingate test. Braz. J. Med. Biol. Res. 2015. in press. doi: 10.1590/1414-431X20144043
17. Inbar O, Bar-Or O, Skinner JS. The Wingate anaerobic test. Champaign: J Hum Kinet. 1996.
18. Moro VL, Gheller RG, Berneira JO, Hoefelman CP, Karasiak FC, Moro ARP, Diefenthaeler F. Comparison of body composition and aerobic and anaerobic performance between competitive cy-clists and triathletes. Rev. bras. cineantropom. desempenho hum. 2013;15(6): 646-655. doi: 10.5007/1980-0037.2013v15n6p646 19. Jackson AS, Pollock ML. Generalized equations for predicting
body density of men. Br J Nutr. 1978;40: 497-504.
20. The Internacional Society for Advancement for Kineanthropometry [homepage on the Internet]. Australia: National Library of Australia [cited 2013 Jul 2013]. Available from: http://www. isakonline.com
21. Siri WE. The gross composition of the body. In: Tobias CA, Lawrence JH, editors. Advances in biological and medical phys-ics. New York: Academic Press;1956: 239-80.
22. Thalheimer W, Cook S. How to calculate effect sizes from published research articles: A simpliied methodology. 2002. Retrieved November 25, 2014 from http://work-learning.com/ effect_sizes.htm.
23. Bertuzzi RC, Franchini E, Ugrinowitsch C, Kokubun E, Lima-Silva AE, Pires FO. Predicting MAOD using only a supramaxi -mal exhaustive test. Int J Sports Med. 2010;31: 477-481. doi: 10.1055/s-0030-1253375
24. Spriet LL. New insights into the interaction of carbohydrate and fat metabolism during exercise. Sports Med. 2014; 44(1): 87–96. doi: 10.1007/s40279-014-0154-1
Corresponding author
Leonardo de Sousa Fortes
Clóvis Beviláqua, 163/1003 – Madalena – Recife/PE – 50710330. Brazil Programa de Pós-Graduação em Educação Física, Universidade Federal de Per -nambuco, Recife, Brasil.
Email: [email protected]
Manuscript received on June 20, 2016 Manuscript accepted on September 14, 2016