Rev Bras
Cineantropom
Hum
DOI: http://dx.doi.org/10.5007/1980-0037.2016v18n2p207
original article
Validity and reliability of scales on intrapersonal,
interpersonal and environmental factors
associated with physical activity in Brazilian
secondary students
Validade e idedignidade de escalas sobre fatores
intrapessoais, interpessoais e ambientais associados
à atividade física em escolares brasileiros do ensino
fundamental
Valter Cordeiro Barbosa Filho1,2,3
Cassiano Ricardo Rech1
Jorge Mota2
José Cazuza de Farias Júnior4
Adair da Silva Lopes1
Abstract – his study aimed to examine the validity and reliability of scales of intraper-sonal, interperintraper-sonal, and environmental factors associated with physical activity (PA) in secondary students. Two cross-sectional studies were conducted with students in 7th to 9th grades form secondary schools in order to test the validity, internal consistency (n = 1,178, 51.4% were boys), and test–retest reproducibility (n = 194, 56.2% were boys) of the instrument. Factors associated with PA (attitude, self-eicacy, social support of friends, parents and the school’s teachers, as well as the perceived neighborhood environment and perceived school environment) were measured. he conirmatory factor analysis and Spearman correlation between the scales and the weekly time spent in moderate-to-vigorous PA (measured by questionnaire) were applied to test the construct validity. For reliability, the Cronbach’s α (internal consistency), composite reliability (CR) and intraclass correlation coeicient (ICC for test–retest reproducibility) were applied. he conirmatory factorial analysis showed ive one-dimensional and two two-dimensional (self-eicacy and perceived environment) scales, with factor loadings ranging from 0.46 to 0.85. Signiicant and positive correlations between almost all scale scores and moderate-to-vigorous PA (p<0.05) were found. he Cronbach’s α and CR were greater than 0.70 in almost all scales (except perceived school environment, α and CR of 0.61) and the ICC ranged from 0.62 (parental social support) to 0.70 (self-eicacy). In conclusion, the scales showed acceptable validity and reliability and can be used for measuring of PA correlates in elementary students.
Key words: Motor activity; Reproducibility of results, Psychometrics; Psychosocial aspects; Validity tests.
Resumo – Este estudo analisou a validade e a idedignidade de escalas de fatores intrapessoais, interpessoais e ambientais associados à atividade física (AF) em escolares do ensino fundamental. Estudos transversais incluíram escolares dos 7º ao 9º anos para análises de validade e consistência interna (n=1.178, 51,4% meninos), e reprodutibilidade teste-reteste (n=194, 56,2% meninos) do instrumento. Atitude, autoeicácia, apoio social dos amigos, pais e professores da escola, e o ambiente percebido do bairro e da escola relacionados à AF foram avaliados. A análise fatorial conirmatória e a correlação de Spearman entre os escores das escalas e o tempo semanal em AF moderada a vigorosa foram aplicadas para testar a validade de constructo das escalas. Utilizou--se o α de Cronbach e o índice de idedignidade combinada (IFC) para avaliar a consistência interna, e o coeiciente de correlação intra-classe (CCI) para a reprodutibilidade teste-reteste. A análise fatorial conirmatória indicou cinco escalas unidimensionais e duas bi-dimensionais (autoeicácia e ambiente percebido para AF), com ajustes de modelo adequados e cargas fatoriais de 0.46 a 0.85. Houve correlações signiicativas entre os escores de quase todas as escalas e AF moderada a vigorosa (p<0,05). O a e o IFC foram maiores de 0.70 em quase todas as escalas (exceto ambiente percebido da escola, a e IFC de 0.61) e o CCI variou de 0.62 (apoio social dos pais para AF) a 0.70 (autoeicácia para AF). Em conclusão, as escalas apresentaram validade e idedignidade aceitáveis e pode ser utilizado na mensuração de fatores associados à AF em escolares do ensino fundamental.
1 Federal University of Santa Catarina. Department of Physical Education. Research Centre in Physi-cal Activity and Health. Florianopolis, SC. Brazil.
2 University of Porto. Faculty of Sport. Research Centre in Physical Activity, Health and Leisure. Porto, Portugal.
3 Federal University of Ceara. Rese-arch Centre in Physical Activity and Health in School. Institute of Physical Education and Sports. Fortaleza, CE. Brazil.
4 Federal University of Paraiba. Research and Study Groups in Epi-demiology of Physical Activity. João Pessoa, PB. Brazil.
INTRODUCTION
Identifying the factors that can inluence people’s choices regarding physi-cal activity (PA) has been considered an important subject in PA studies1.
Diferent theoretical approaches (e.g., socio-ecological or socio-cognitive theories) have been used to understand these factors and how they can interfere in PA practice in the population, including with young people2-4.
he socio-ecological theory emphasizes that PA may be inluenced by interpersonal (e.g., self-eicacy), interpersonal (e.g., social support) and environmental (e.g., neighborhood environment) factors2. Although this
theory does not deine or establish which constructs should be measured, some instruments of the factors associated with PA3,5-7 have been based
on the socio-ecological theory.
An instrument was developed and validated with scales of intrapersonal (attitude and self-eicacy), interpersonal (social support of parents and friends) and environmental (perceived neighborhood environment) fac-tors associated with PA, considering a sample of students from public and private high schools (aged 14–19 years) in Joao Pessoa, Brazil5. All scales
had adequate internal consistency (Cronbach’s α from 0.69 and 0.90) and test–retest reproducibility (intraclass correlation coeicient (ICC) from 0.67 and 0.91)5. However, the factorial conirmation of these scales in
sec-ondary schools has not been evaluated. Instruments used in young people without information on validity and reliability have been recurrent in the literature2,4,8,9. Moreover, the instrument previously mentioned5 and other
instruments for young people5,10,11 have not included aspects of the school
environment (facilities/resources and encouragement for school teachers) that may be associated with PA practice. Evaluating the perception of the students on the PA-related school environment is important because this context focuses on PA public policies in Brazil12 and can contribute to an
active lifestyle among young people13. Filling in these gaps is important to
indicate adequate scales for measuring factors associated with PA among Brazilian secondary students in order to guide studies on PA correlates and determinants, as well as potential mediators of the intervention efect in PA among young people1,4,8,13.
herefore, this study aimed to analyze the validity and reliability of scales for measuring intrapersonal, interpersonal and environmental factors associated with PA in Brazilian secondary students.
METHOD
Population and study sample
• Study 1 - validity and internal consistency (reliability)
One sample was evaluated in order to analyze the validity and internal consistency (reliability) of the instrument. For this purpose, 1,272 students from 40 grade 7–9 classes in all six public secondary full-time schools (all were enrolled in the national program called Programa Saúde na Escola) in Fortaleza were eligible; they were invited to participate in the “Fortaleça sua Saúde” program. Of these, 87 were not present at school after two/ three days of data collection, four students refused to participate and 11 questionnaires were excluded due many unanswered questions. A total of 1,178 students had valid data. his sample size was adequate for estimating validity and reliability parameters, considering the rate of 20 individuals for each item of the instrument (56 initial items x 20 = at least 1,120 subjects)14.
• Study 2 - Test–retest reproducibility (reliability)
Another sample was used to verify the test–retest reproducibility of the instrument. For this, two public schools in Fortaleza, independent of the schools in Study 1, were intentionally selected. Students from the 12 grade 7–9 classes were eligible. In total, 194 students contributed test–retest data. his sample allows for the identiication of ICC greater than 0.20 as statistically signiicant (α = 0.05) and 80% power (β = 0.20) with two instrument applications.
Instruments
he instrument analyzed in this study was proposed for evaluating factors associated with PA in adolescents aged 14–19 years5. he original
instru-ment consisted of ive PA-related scales: attitude, self-eicacy, parental social support, social support from friends and perceived neighborhood environment. he attitude scale included ive items regarding afective and instrumental aspects of attitude related to PA practice, considering contrasting adjectives: safe–unsafe, fun–boring, important–negligible, health–harmful, good–bad (see instrument in Supplementary Material). Other scales had the response options in a four-point Likert scale. he self-eicacy scale included 13 items (ranging from 1 “strongly disagree” to 4 “strongly agree”) and evaluated the students’ perceptions of the ability to practice PA in adverse situations. he scales of social support of friends and parents included six items each (ranging from 1 “never” to 4 “always”) and evaluated the students’ perceptions of the frequency with which these social members stimulate PA practice for the students. he perceived en-vironment scale included 14 items (ranging from 1 “strongly disagree” to 4 “strongly agree”) on the students’ perceptions of PA-related attributes (i.e., security, infrastructure, and access and attractiveness related to PA) in the neighborhoods where the student lived5.
All items from the original instrument5 were considered because the
of the school’s teachers and perceived school environment. Two reasons justify the inclusion of theses scales: 1) to evaluate potential variables previously highlighted as important PA predictors in youth3,13,15 and 2)
school aspects may explain the efectiveness of the intervention program to promote PA2,4. he support of the school’s teachers scale included six
items (ranging from 1 “never” to 4 “always”) and was built with the same structure of the social support scales. he school environment scale (six items, with response options ranging from 1 “strongly disagree” to 4 “strongly agree”) considered the students’ perception on aspects from the school environment that are related to PA practice (availability and access to PA equipment during breaks, conditions of PA sites, encouraging PA in physical education classes) and were highlighted in a systematic review13.
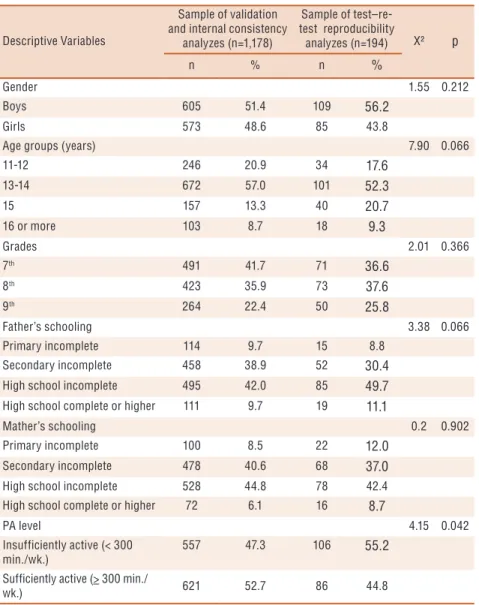
Gender, age, father and mother’s schooling, and weekly time spent in moderate-to-vigorous PA (MVPA) were measured (the categories of the variables were in Table 1). Father and mother’s schooling were evaluated based on the Brazilian Association of Research Companies methodology16.
We used a previously validated list of 24 MVPA17. Students reported the
weekly frequency and duration of each PA that they performed in the previous week. hus, we estimated the weekly time in MVPA.
Procedures
• Study 1 – Validity and internal consistency (reliability)
Evaluators previously trained in theoretical explanations and practical simulations administered the questionnaires. he questionnaire was illed out by students in the classroom, without the presence of teachers. Prior to administration, the evaluators provided instructions and read each ques-tion aloud. hen, the students answered the quesques-tions. Data collecques-tion was conducted in July 2014.
• Study 2 – Test–retest reproducibility (reliability)
he above-mentioned protocol was also used during the test–retest data collections. Data collection was applied (test) and repeated (retest) at an interval of 15 days. In the irst application, students received the instrument in an envelope to complete. In the second application, the same procedure was carried out. Data collections were conducted in June 2014.
Data analysis
We used mean, standard deviation, and frequency for a description of the sample characteristics. All analyses were performed using the software SPSS 21.0 (SPSS, Inc., Chicago, IL) with a signiicance level of 5%.
• Study 1 – Validity and internal consistency (reliability)
A conirmatory factor analysis was performed with the software AMOS 21.0 (SPSS, Inc., Chicago, IL), using the method of Maximum Likeli-hood Estimation. he parameters suggested by Hair et al.14 were used
0.90, 2) non-normed it index – NFI > 0.95, 3) root mean square error of approximation – RMSEA < 0.05 for a good it and an upper value of 0.08 for a reasonable it, and 4) X² goodness-of-it test p-value > 0.05 to indicate whether the residuals were signiicant or the ratio between CMIN (X²) and degree of freedom (CMIN/DF) < 11. Adjustments to achieve a better-itted model were conducted based on the Modiication Index (MI) and values of standardized residuals (recommended when they stay higher than ± 2.58)18. Additionally, items were included to the inal scale whether
they had factor loadings greater than or equal to 0.4014. When the
facto-rial structure of a scale was not conirmed during the initial conirmatory factor analysis, we performed an exploratory factor analysis in order to ind a factorial structure of the scale in this sample. hen, we conducted a second conirmatory factor analysis18.
Construct validity was assessed using Spearman’s correlation coeicient (rho) between the scale scores and the weekly time in MVPA2. Items where
higher values represent conditions that were less favorable to PA practice had their values reversed before the sum of the scale scores. Considering that PA can be inluenced by multiple aspects1, this analysis did not intend
to show perfect correlation between scale scores and MVPA, but indicate the direction of this association.
Internal consistency was tested using Cronbach’s Alpha (α) and com-posite reliability (CF, http://www.thestatisticalmind.com/calculators/ comprel/comprel.htm). Values α and CF≥0.70 were adequate. However, values ranging from 0.60 to 0.69 were considered substantial because scales tend to have limited reliability among young people2,19,20.
• Study 2 – Test–retest reproducibility (reliability)
Test–retest reliability was assessed using the ICC with a conidence interval of 95% [95% CI]) between test–retest measurements. ICC values ≥ 0.70 were considered adequate and values from 0.60 to 0.69 were con-sidered substantial2,19,20.
Ethical Considerations
Parents/guardians of the students authorized participation in this study by signing the informed consent. he National Research Ethics System (protocol No. 17366313.9.0000.0121) Federal University of Santa Catarina) approved this research project.
RESULTS
Characteristics of samples
sample of test–retest reproducibility (Study 2) showed a higher proportion of suiciently active students (47.3% versus 55.2%; p < 0.05).
Table 1. Characteristics of the study samples. Fortaleza, Brazil (2014).
Descriptive Variables
Sample of validation and internal consistency
analyzes (n=1,178)
Sample of test–re-test reproducibility
analyzes (n=194) X² p
n % n %
Gender 1.55 0.212
Boys 605 51.4 109 56.2
Girls 573 48.6 85 43.8
Age groups (years) 7.90 0.066
11-12 246 20.9 34 17.6
13-14 672 57.0 101 52.3
15 157 13.3 40 20.7
16 or more 103 8.7 18 9.3
Grades 2.01 0.366
7th 491 41.7 71 36.6
8th 423 35.9 73 37.6
9th 264 22.4 50 25.8
Father’s schooling 3.38 0.066
Primary incomplete 114 9.7 15 8.8
Secondary incomplete 458 38.9 52 30.4
High school incomplete 495 42.0 85 49.7
High school complete or higher 111 9.7 19 11.1
Mather’s schooling 0.2 0.902
Primary incomplete 100 8.5 22 12.0
Secondary incomplete 478 40.6 68 37.0
High school incomplete 528 44.8 78 42.4
High school complete or higher 72 6.1 16 8.7
PA level 4.15 0.042
Insufficiently active (< 300 min./wk.)
557 47.3 106 55.2
Sufficiently active (> 300 min./
wk.) 621 52.7 86 44.8
PA = physical activity. Min./wk. = minutes per week. X² = Chi-square test and its p-value.
Study 1 – Validity and reliability
• Conirmatory factor analysis
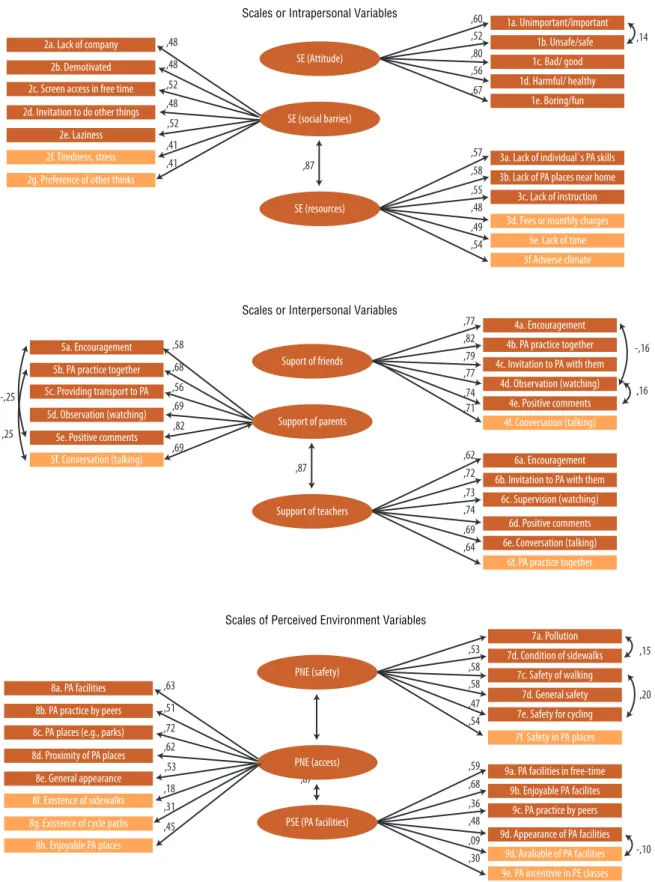
A itted model was found for the scales of attitude (ive items) and support of parents (six items) with all initial items. All items showed factor loadings higher than 0.50 (Figure 1 and Table 2).
Figure 1. Confirmatory factor analyses of the initial scales of intrapersonal, interpersonal, and environmental physical activity variables among students. Fortaleza, Brazil (2014).
better-itted model, and the included items had factor loadings ranging from 0.46 to 0.63 (see Table 2).
he support of friends was conirmed with ive items, all with factor loadings from 0.76 to 0.85. A better-itted model for support of friends was obtained with the exclusion of one item (4f) and the inclusion of the correlation between the errors of three items (see Figure 1 and Table 2). In the scale of support of the school’s teachers, a better-itted model was obtained excluding one item (6f, see Supplementary Material 1 and Table 2). he factor loadings of the ive remaining items ranged from 0.62 to 0.77.
he initial conirmatory factor analysis indicated that the 14 items of the perceived neighborhood environment scale were not structured into three factors as in the original instrument. An exploratory analysis showed that this scale had a bi-factorial structure. his structure was assessed with a conirmatory factor analysis and the factors were labeled “safety and general state of maintenance” and “access to PA facilities” (Figure 1). One item in the irst factor and three items from the second factors were excluded because they had low factor loading (<0.40) and elevated standardized residuals (> 2.58, see Supplementary Material 1). Correlations between the errors of two items (Figure 1) from the “safety and general state of maintenance” were included to obtain a better-itted model. he factor loading of the items ranged from 0.49 to 0.74.
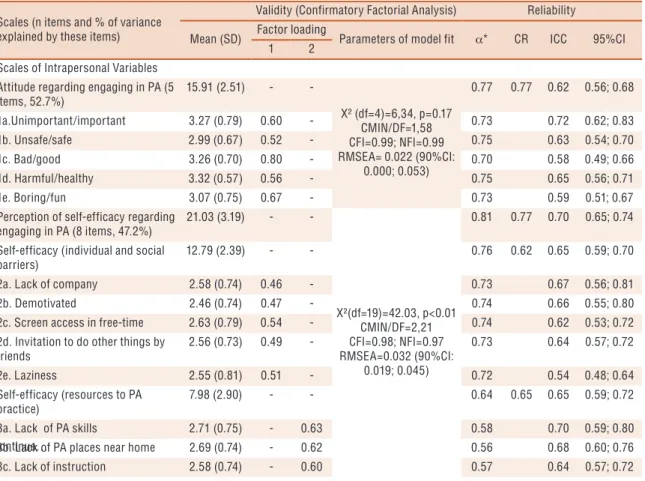
Table 2. Confirmatory factor analyses and reliability parameters of revised scales of intrapersonal, interpersonal, and environmental physical activity variables among students. Fortaleza, Brazil (2014).
Scales (n items and % of variance explained by these items)
Validity (Confirmatory Factorial Analysis) Reliability
Mean (SD) Factor loading Parameters of model fit α* CR ICC 95%CI
1 2
Scales of Intrapersonal Variables Attitude regarding engaging in PA (5 items, 52.7%)
15.91 (2.51) -
-X² (df=4)=6,34, p=0.17 CMIN/DF=1,58 CFI=0.99; NFI=0.99 RMSEA= 0.022 (90%CI:
0.000; 0.053)
0.77 0.77 0.62 0.56; 0.68
1a.Unimportant/important 3.27 (0.79) 0.60 - 0.73 0.72 0.62; 0.83
1b. Unsafe/safe 2.99 (0.67) 0.52 - 0.75 0.63 0.54; 0.70
1c. Bad/good 3.26 (0.70) 0.80 - 0.70 0.58 0.49; 0.66
1d. Harmful/healthy 3.32 (0.57) 0.56 - 0.75 0.65 0.56; 0.71
1e. Boring/fun 3.07 (0.75) 0.67 - 0.73 0.59 0.51; 0.67
Perception of self-efficacy regarding engaging in PA (8 items, 47.2%)
21.03 (3.19) -
-X²(df=19)=42.03, p<0.01 CMIN/DF=2,21 CFI=0.98; NFI=0.97 RMSEA=0.032 (90%CI:
0.019; 0.045)
0.81 0.77 0.70 0.65; 0.74
Self-efficacy (individual and social barriers)
12.79 (2.39) - - 0.76 0.62 0.65 0.59; 0.70
2a. Lack of company 2.58 (0.74) 0.46 - 0.73 0.67 0.56; 0.81
2b. Demotivated 2.46 (0.74) 0.47 - 0.74 0.66 0.55; 0.80
2c. Screen access in free-time 2.63 (0.79) 0.54 - 0.74 0.62 0.53; 0.72
2d. Invitation to do other things by friends
2.56 (0.73) 0.49 - 0.73 0.64 0.57; 0.72
2e. Laziness 2.55 (0.81) 0.51 - 0.72 0.54 0.48; 0.64
Self-efficacy (resources to PA practice)
7.98 (2.90) - - 0.64 0.65 0.65 0.59; 0.72
3a. Lack of PA skills 2.71 (0.75) - 0.63 0.58 0.70 0.59; 0.80
3b. Lack of PA places near home 2.69 (0.74) - 0.62 0.56 0.68 0.60; 0.76
3c. Lack of instruction 2.58 (0.74) - 0.60 0.57 0.64 0.57; 0.72
Scales (n items and % of variance explained by these items)
Validity (Confirmatory Factorial Analysis) Reliability
Mean (SD) Factor loading Parameters of model fit α* CR ICC 95%CI
1 2
Scales of Interpersonal Variables
Support of friends (5 items, 68.3%) 11.46 (4.61) -
-X² (df=3)=12.48, p<0.01 CMIN/DF=4.16 CFI=0.99; NFI=0.99
RMSEA=0.052 (CI 90%:0.024;0.083)
0.90 0.88 0.66 0.62; 0.69
4a. Encouragement 2.20 (1.10) 0.76 - 0.88 0.61 0.53; 0.69
4b. PA practice together 2.49 (1.12) 0.85 - 0.87 0.67 0.58; 0.76
4c. Invitation to PA with them 2.56 (1.12) 0.79 - 0.87 0.63 0.52; 0.71
4d. Observation (watching) 2.16 (1.12) 0.77 - 0.88 0.71 0.62; 0.79
4e. Positive comments 2.04 (1.10) 0.70 - 0.87 0.63 0.56; 0.70
Support of parents (6 items, 54.6%) 11.08 (4.33)
X² (df=7)=21.38, p<0.01 CMIN/DF=3.05 CFI =0.99; NFI = 0.99 RMSEA= 0.042 (90%CI:
0.022; 0.063)
0.83 0.83 0.62 0.56; 0.65
5a. Encouragement 2.37 (1.09) 0.58 - 0.81 0.66 0.57; 0.74
5b. PA practice together 1.51 (0.79) 0.68 - 0.81 0.64 0.57; 0.72
5c. Providing transport to PA 1.68 (0.99) 0.56 - 0.82 0.62 0.55; 0.70
5d. Observation (watching) 1.59 (0.87) 0.69 - 0.80 0.59 0.50; 0.67
5e. Positive comments 1.89 (1.03) 0.82 - 0.78 0.56 0.48; 0.63
5f. Conversation (talking) 2.03 (1.08) 0.69 - 0.78 0.63 0.56; 0.69
Support of the school’s teachers (5 items, 59.3%)
11.10 (4.12) -
-X² (df=5)=23.56, p<0.001 CMIN/DF= 4.71 CFI=0.99; NFI=0.98 RMSEA= 0.056 (90%CI:
0.035; 0.080)
0.84 0.83 0.69 0.65; 0.73
6a. Encouragement 2.42 (1.08) 0.62 - 0.83 0.70 0.62; 0.77
6b. Invitation to PA with them 2.00 (1.08) 0.67 - 0.81 0.66 0.58; 0.71
6c. Supervision (watching) 2.32 (1.09) 0.72 - 0.81 0.64 0.55; 0.70
6d. Positive comments 2.01 (1.02) 0.77 - 0.81 0.67 0.58; 0.71
6e. Conversation (talking) 2.35 (1.09) 0.72 - 0.82 0.61 0.53; 0.68
Scales of Perceived Environment Variables Perceived Neighborhood Environ-ment (PCE) scales regarding engag-ing in PA (10 items, 47.6%)
24.52 (4.09) -
-X² (df=32)=65.41, p<0.001 CMIN/DF= 2.04 CFI=0.98; NFI=0.97 RMSEA=0.030 (90%CI: 0.019; 0.040)
0.75 0.83 0.62 0.58; 0.66
PNE (safety and general state of maintenance)
12.24 (2.79) 0.73 0.69 0.58 0.56; 0.62
7a. Pollution 2.52 (0.85) - 0.60 0.69 0.64 0.57; 0.70
7b. Condition of sidewalks 2.55 (0.78) - 0.55 0.70 0.64 0.57; 0.69
7c. Safety for walking 2.47 (0.80) - 0.54 0.69 0.62 0.53; 0.69
7d. General safety 2.17 (0.85) - 0.59 0.69 0.57 0.49; 0.66
7e. Safety for cycling 2.53 (0.81) - 0.48 0.71 0.58 0.49; 0.66
PNE (access to PA facilities) 12.17 (2.62) - - 0.78 0.74 0.67 0.64; 0.71
8a. PA facilities 2.22 (0.82) 0.65 - 0.74 0.65 0.59; 0.70
8b. PA practice by peers 2.53 (0.79) 0.50 - 0.76 0.63 0.57; 0.70
8c. PA places (e.g.,parks) 2.51 (0.85) 0.74 - 0.74 0.61 0.56; 0.68
8d. Proximity of PA places 2.44 (0.87) 0.62 - 0.75 0.85 0.76; 0.92
8e. General appearance 2.47 (0.80) 0.49 - 0.76 0.64 0.58; 0.70
PSE (PA facilities, 3 items, 56.0%) 9.87 (2.09)
-Not estimated
0.61 0.61 0.65 0.61; 0.70
9a. PA facilities in free-time 2.41 (0.83) 0.59 - 0.57 0.58 0.49; 0.66
9b. Enjoyable PA facilities 2.56 (0.78) 0.70 - 0.58 0.63 0.55; 0.71
9c. Appearance of PA facilities 2.13 (0.78) 0.46 - 0.60 0.66 0.57; 0.71
* Cronbach’s α was used to represent the internal consistency of the total scale and excluding each item.
CI: confidence interval; CMIN/DF: ratio between CMIN (X²) and degree of freedom (df); CR: Composite Reliability; GFI: goodness of fit index; ICC: intraclass correlation coefficient; NFI: non-normed fit index; RMSEA: Steiger’s root mean square error of approxima-tion; PA: physical activity; PCE (access): perceived community environment (access to PA facilities); PCE (safety): perceived com-munity environment (safety and general state of maintenance); PSE (PA facilities): perceived school environment (physical activity facilities); PE: Physical Education; SE (social barriers): self-efficacy (individual and social barriers); SE (resources): self-efficacy (resources to physical activity practice).
A better-itted model was conirmed with three items in the perceived school environment scale (Figure 1 and Table 2), and three items were ex-cluded (see Supplementary Material 1). he factor loading of the inex-cluded items ranged from 0.49 to 0.66.
Construct validity
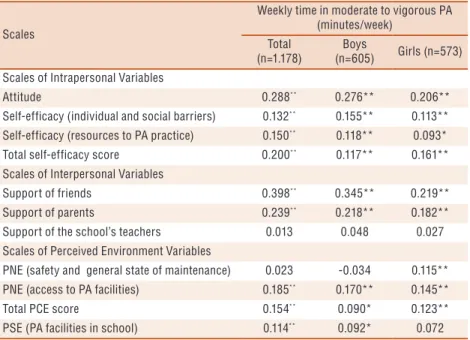
here were signiicant and positive correlations between almost all scales and weekly time in MVPA (p < 0.05). he exceptions were the subscale “safety and general state of maintenance”, in the perceived neighborhood environment scale (rho = 0.034, p = 0.437) and support of the school’s teachers (rho = 0.013, p = 0.734). Other scales had correlations ranging from 0.132 (“individual and social barriers” in self-eicacy) to 0.398 (support of friends, both with p <0.01). Most of scale scores showed small correla-tions with MVPA. hese results were similar both in boys and girls in most of the scales. Exceptions included the perceived school environment scale, without signiicant correlation in girls only (rho = 0.072, p = 0.070) and “safety and general state of maintenance” (perceived neighborhood environment scale), with signiicant correlation in girls only (rho = 0.115, p < 0.001, see Table 3).
Table 3. Spearman correlation (rho) between scale scores and weekly time in moderate to vigorous physical activity in the total sample and boys and girls separately. Fortaleza, Brazil (2014).
Scales
Weekly time in moderate to vigorous PA (minutes/week)
Total (n=1.178)
Boys
(n=605) Girls (n=573) Scales of Intrapersonal Variables
Attitude 0.288** 0.276** 0.206**
Self-efficacy (individual and social barriers) 0.132** 0.155** 0.113** Self-efficacy (resources to PA practice) 0.150** 0.118** 0.093*
Total self-efficacy score 0.200** 0.117** 0.161**
Scales of Interpersonal Variables
Support of friends 0.398** 0.345** 0.219**
Support of parents 0.239** 0.218** 0.182**
Support of the school’s teachers 0.013 0.048 0.027
Scales of Perceived Environment Variables
PNE (safety and general state of maintenance) 0.023 -0.034 0.115**
PNE (access to PA facilities) 0.185** 0.170** 0.145**
Total PCE score 0.154** 0.090* 0.123**
PSE (PA facilities in school) 0.114** 0.092* 0.072
PA: physical activity; PNE: perceived neighborhood environment; PSE: perceived school environment; * p<0.05; **p<0.01.
Internal consistency (reliability) and CF
Study 2 – Test–retest reproducibility (reliability)
he ICC ranged from 0.62 (support of parents and perceived neighborhood environment) to 0.70 (self-eicacy, Table 2).
DISCUSSION
Our results showed that the tested instrument had acceptable validity, internal consistency, and test–retest reproducibility. his instrument can be used in epidemiological studies on PA correlates, impact of interven-tion on PA and potential mediators among Brazilian secondary students.
Validity
he scale of attitude was conirmed with all ive items of the original in-strument5. he attitude related to PA is an individual assessment related
to overall satisfaction attitude of adolescents about regular PA, consider-ing both positive/negative or instrumental/emotional PA aspects2,5. In a
socio-ecological theory perspective, attitude is an intrapersonal factor that may be directly associated with PA or be inluenced by other aspects such as the PA-related environment4,13. However, there is some evidence on
the mediating role of attitude in PA interventions among young people4,
which implies the need for intervention studies that include PA-related attitude in order to evaluate its role in promoting PA in this population.
he self-eicacy scale was conirmed with nine items (one less than the original scale5) and a bi-factorial structure. Items related to PA barriers, such
as tiredness/stress and preference for other activities, were excluded because of high covariance with other items of the self-eicacy scale or low factor loading. Other items on lack of time, adverse weather and fees were also excluded in order to improve the goodness-of-it of the model in secondary schools. hese indings may represent the fact that the perception of barriers and how it in-luences the self-assessment of ability to practice PA can distinguish between populations. he age range included in studies may also explain distinctions in the structure of items included in PA-related self-eicacy scales2,4.
he scales of support of parents and friends for PA were conirmed with acceptable psychometric properties and construct validity with almost all items. One item on friends talking about PA with students was excluded due to the high covariance with the remaining items of the scale, which can be explained because the conversation content (e.g., encouragement, invitation to PA practice) may represent further support for engaging in PA. Previous studies highlighted the fact that support of parents8,9,20 and
friends4,6,8,19 is an important PA correlate among adolescents. However,
insuicient information on the validity and reliability of scales for meas-uring these variables is usual, which makes it diicult determine the real understanding of the relationship between PA and these aspects, as well as how interventions can modify these aspects9.
et al.7 conducted a high methodological quality study8 aiming to validate
PA-related variable scales among students from four European countries and identiied the importance of support of the school’s teachers (e.g., talk about exercises in classes) as an interpersonal factor of PA practice. Yildi-rim et al.15 also found that support of the school’s teachers is an important
mediator of the changes in PA during recess. In our study, the scores of this scale did not have a signiicant correlation with MVPA, probably because we measured total MVPA and not PA within the school only3.
However, the scores of the scale regarding support of the school’s teachers had signiicant correlations with support of parents, support of friends, attitude and perceived school environment (rho coeicient of 0.149, 0.182, 0.105, and 0.185, respectively, all with p < 0.01, data not shown in tables). hus, measuring this PA-related factor may be important for indicating the focus of interventions within the school setting and variables that can explain PA practice in students.
he structure of perceived neighborhood environment scale consisted of two factors, which was diferent than the original instrument5. After we
tested this scale in an exploratory factor analysis, the conirmatory analysis showed a better-itted model with the items related to safety and general state of maintenance of the neighborhood in a single factor. Additionally, four items were excluded from the perceived neighborhood environment scale (items related to sidewalks, bike paths, and safety/satisfaction with the PA places). his distinction in the structure of scales of PA-related environment variables among adolescents is common because there are environment distinctions between sites and they can vary in the interac-tions with the stimulus in PA practice8. In our study, the subscale of “safety
and general state of maintenance” did not have a signiicant correlation with MVPA in the total sample and in boys. A non-signiicant correlation between PA-related environment scales and PA practice was also found in the validation study of the Neighborhood Environment Walkability Scale for Youth (NEWS-Y) among American adolescents10. hese results
can be explained because the relationship between some environmental attributes and PA can be more consistent with speciic PA types (e.g., PA for travelling)20. his reinforces the importance of evaluating other
envi-ronmental contexts that may be related to PA among young people, such as the school environment2,10,19.
he scale of perceived school environment had a better-itted model and acceptable psychometric properties with three items and a signiicant (but small) correlation with MVPA. Other items were excluded because they had low factor loading and probably measured other constructs of the school environment related to PA. Measuring the student’s perception of the school environment related to PA is diicult because there are diferent aspects of the school environment that can be related to PA. Stanley et al.3
environment and PA measured using accelerometers during the school breaks, but only in girls. hus, the validation of PA-related perceived school environment needs further investigation. he scale validated in the present study may assist in studies of the PA facilities in school and how they contribute to the PA practice, which may indicate an important focus for PA public policies among young people13.
Reliability
Most scales had adequate internal consistency and reliability (α and CF higher than 0.70). However, the scale of PA facilities in school (perceived school environment) had substantial internal consistency and reliability (α and CF 0.61), which may be explained due to the low number of items2,14. Moreover, all scales had substantial test–retest reproducibility
(ICC ranging from 0.62 to 0.70). A systematic review on reliability of scales of potential PA mediators in young people found 68 studies with α ranging from 0.30 to 0.92, with values higher than 0.60 on only 24 occasions2. Stanley et al.3 evaluated an instrument with intrapersonal,
interpersonal and environmental scales of factors associated with PA and found α and ICC lower than 0.50 for scales such as PA-related support of teachers and access to PA resources in school. Low reliability was also highlighted in other scales of PA-related perceived environment7,8,10 and
social support6,7,9. hese aspects indicate the complexity of measuring the
youths’ perception of factors associated with PA due to seasonal changes in these factors over a short time, as well as the diiculties of adequately describing the structures (e.g., PA facilities) and components (PA behavior of their parents) related to PA8.
Strengths and limitations
his study contributes to the literature by presenting a valid and reliable instrument with scales focused on identifying diferent intrapersonal, interpersonal and environmental factors associated with PA in secondary schools. he inclusion of school-related scales (support of the school’s teach-ers and perceived school environment) is also an important aspect of this study. Finally, the sample with suicient statistical power and the diferent statistical procedures used to make inferences, both for the analysis of valid-ity as to the reliabilvalid-ity of instrument14, were other strengths of this study.
Our study also had limitations. All scales had only substantial test–re-test reproducibility, which is expected on scales used with young people. Also, the scale of perceived school environment was conirmed with only three items, making it impossible to measure the goodness-of-it of the model. Measuring the students’ perception of the school environment related to PA has been one of the diiculties in studies on potential PA mediators among young people8. Diferences between the samples of the
not include students from grade 6 or those attending private schools. hus, the extrapolation of the indings to other populations is limited.
CONCLUSION
he instrument tested in this study showed acceptable validity and reli-ability and can be used to measure diferent intrapersonal (attitude and self-eicacy), interpersonal (social support of parents, friends, and the school’s teachers) and environmental (perceived neighborhood and school environment) factors related to PA in secondary students. Health profes-sionals, researchers, and managers of PA promotion public policies may consider the use of this instrument to identify factors associated with PA in secondary students, as well as the mediators of the impact of PA promotion interventions in this population.
Acknowledgements
We thank the Municipal Education Department for technical support and authorization to the study execution. We thank all members of the school community (managers, teachers, parents and students), as well as all members of the “Fortaleça sua Saúde” Working Group, who were involved in this study.
REFERENCES
1. Bauman AE, Reis RS, Sallis JF, Wells JC, Loos RJ, Martin BW, et al. Correlates of physical activity: why are some people physically active and others not? Lancet 2012;380(9838):258-71.
2. Brown H, Hume C, ChinAPaw M. Validity and reliability of instruments to as-sess potential mediators of children’s physical activity: A systematic review. J Sci Med Sport 2009;12(5):539-48.
3. Stanley RM, Ridley K, Olds TS, Dollman J. Development and psychometric properties of the Y-PASS questionnaire to assess correlates of lunchtime and after-school physical activity in children. BMC Public Health 2014;14(1):412.
4. Van Stralen MM, Yildirim M, Velde ST, Brug J, van Mechelen W, Chinapaw MJ, et al. What works in school-based energy balance behaviour interventions and what does not: A systematic review of mediating mechanisms. Int J Obes 2011;35(10):1251-65.
5. Farias Júnior JC, Lopes AS, Reis RS, Nascimento JV, Borgatto AF, Hallal, PC. Development and validation of a questionnaire measuring factors associated with physical activity in adolescents. Rev Bras Saúde Matern Infant 2011;11(3):301-12.
6. Huang Y-J, Wong SH, Salmon J, Hui SS. Reliability and validity of psychoso-cial and environmental correlates measures of physical activity and screen-based behaviors among Chinese children in Hong Kong. Int J Behav Nutr Phys Act 2011;8(1):16.
7. Ommundsen Y, Page A, Ku P-W, Cooper AR. Cross-cultural, age and gender validation of a computerised questionnaire measuring personal, social and envi-ronmental associations with children’s physical activity: the European Youth Heart Study. Int J Behav Nutr Phys Act 2008;5(1):29.
CORRESPONDING AUTHOR
Valter Cordeiro Barbosa Filho Universidade Federal de Santa Catarina
Centro de Desportos, Departamento de Educação Física
Campus Universitário – Trindade. 88040-900, Florianópolis, SC, Brasil.
E-mail: [email protected]
9. Trost SG, McDonald S, Cohen A. Measurement of general and speciic approaches to physical activity parenting: A systematic review. Child Obes 2013;9(s1):40-50.
10. Rosenberg D, Ding D, Sallis JF, Kerr J, Norman GJ, Durant N, et al. Neighborhood Environment Walkability Scale for Youth (NEWS-Y): reliability and relationship with physical activity. Prev Med 2009;49(2):213-8.
11. Saunders RP, Pate RR, Felton G, Dowda M, Weinrich MC, Ward DS, et al. Development of questionnaires to measure psychosocial inluences on children’s physical activity. Prev Med 1997;26(2):241-47.
12. Brasil, Ministério da Saúde. Política Nacional de Promoção da Saúde. Brasília: MS; 2010.
13. Ferreira I, Van Der Horst K, Wendel-Vos W, Kremers S, van Lenthe FJ, Brug J. Environmental correlates of physical activity in youth–a review and update. Obes Rev 2007;8(2):129-54.
14. Hair JF, Black WC, Babin BJ, Anderson RE, Tatham RL. Análise multivariada de dados. São Paulo: Bookman; 2009.
15. Yıldırım M, Arundell L, Cerin E, Carson V, Brown H, Crawford D, et al. What helps children to move more at school recess and lunchtime? Mid-intervention results from Transform-Us! cluster-randomised controlled trial. Br J Sports Med 2013;48(3):271-7.
16. Associação Brasileira das Empresas de Pesquisa: Critério de classiicação econômica Brasil. In. São Paulo: ABEP; 2008.
17. Farias Júnior JC, Lopes AS, Mota J, Santos MP, Ribeiro JC, Hallal PC. Validade e reprodutibilidade de um questionário para medida de atividade física em adoles-centes: uma adaptação do self-administered physical activity checklist. Rev Bras Epidemiol 2012;15(1):198-210.
18. Kline RB. Principles and Practice of Structural Equation Modeling. 2011 (3º ed.). New York: Guilford. 2011.
19. Dewar DL, Lubans DR, Plotnikof RC, Morgan PJ.Development and evaluation of social cognitive measures related to adolescent dietary behaviors. Int J Behav Nutr Phys Act 2012;9:36.