ABSTRACT:Introduction: In 2010, there were 305 (37.8%) municipalities with malaria epidemics in the Brazilian Amazon. The epidemics spread can be explained by the spatial distribution pattern. Objective: To analyze the spatial dependence, autocorrelation, of the malaria epidemics in the municipalities of this region. Methods: An automated algorithm was used for the detection of epidemic municipalities in 2003, 2007 and 2010. Spatial dependence was analyzed by applying the global and local Moran index on the epidemic months proportion variable. The epidemic municipalities clusters were identiied using the TerraView software. Results: The global Moran index values were 0.4 in 2003; 0.6 in 2007; and 0.5 in 2010 (p = 0.01), conirming the spatial dependence among the epidemic municipalities. Box Map and Moran Map identiied inter-municipal, interstate and borders clusters with spatial autocorrelation (p < 0.05). There were 10 epidemic municipalities clusters in 2003; 9 in 2007 and 8 in 2010. Discussion: The epidemic municipalities clusters may be linked to the health facilities diiculties on acting together. The structural limitations of the health services can be overcome by territorial integration to support planning and control activities, strengthening the interventions. Conclusion: The routine analysis of the epidemic municipalities clusters with spatial and temporal persistence may provide a new indicator of planning and integrated control prioritization, contributing to malaria epidemics reducing in inter-municipal, interstate and borders areas. Keywords: Malaria. Epidemics. Spatial analysis. Epidemiology. Planning. Amazonian Ecosystem.
Spatial dependence of malaria epidemics in
municipalities of the Brazilian Amazon
Dependência espacial das epidemias de malária em municípios da
Amazônia Brasileira
Rui Moreira BrazI,II, Renato Fontes GuimarãesIII, Osmar Abílio de Carvalho JúniorIII,
Pedro Luiz TauilIV
ORIGINAL ARTICLE / ARTIGO ORIGINAL
IDepartment of Surveillance and Assessment of the Uniied Health System, Executive Secretariat, Ministry of Health – Brasília (DF), Brazil.
IIGraduate Program in Tropical Medicine, Group of Tropical Medicine, Medical School, Universidade de Brasília – Brasília (DF), Brazil. IIIDepartment of Geography, Graduate Program in Geography, Universidade de Brasília – Brasília (DF), Brazil.
IVMedical School, Field of Social Medicine, Universidade de Brasília – Brasília (DF), Brazil.
Corresponding author: Rui Moreira Braz, Ministério da Saúde, Secretaria Executiva, Departamento de Monitoramento e Avaliação do SUS (DEMAS), Setor de Administração Federal Sul (SAFS), Quadra 2, Lote 5, Edifício Premium, Torre 1, 1º subsolo, CEP: 70070-620, Brasília, DF, Brasil. E-mail: [email protected]
INTRODUCTION
Malaria epidemics are usually inluenced by multicausal processes, especially involving environmental (vegetation, climate and hydrology); sociodemographic (migrations, population density, socioeconomic situation and labor activity of the population); biological (species and density of mosquitoes from the Anopheles gender, Plasmodium species, and level of immunity in the population) and; political/organizational aspects (territorial division, organization and efectiveness of health services, disordered soil occupation, presence of large farming and infrastructure enterprises). Because these factors are so complex, one aspect that should be observed in the organization of planning and control actions is the spatial distribution of the disease. Patterns of morbidity and propagation of epidemics cannot be fully understood without approaching space as a category of analysis. The methods applied for spatial analysis have been mostly used to detect disease clusters, to ind high risk areas, to plan for control actions and to monitor health status1, thus providing information to subsidize the proper conduction of investigative actions
and injury control.
A study conducted in Brazil used the quartile control diagram to characterize the distribution of malaria epidemics in a city from the endemic region2. However, besides
local approaches, it is also necessary to consider the level of spatial dependence of malaria
RESUMO:Introdução: Em 2010, foram observados 305 (37,8%) municípios com epidemias de malária na Amazônia brasileira. A propagação dos eventos epidêmicos pode ser explicada pelo padrão da distribuição espacial. Objetivo: Analisar a dependência espacial, autocorrelação, das epidemias de malária nos municípios dessa região. Métodos: Foi utilizado algoritmo automatizado para detecção dos municípios epidêmicos nos anos de 2003, 2007 e 2010. A dependência espacial foi analisada por meio da variável proporção de meses epidêmicos, aplicando-se os índices de Moran global e local. Foram identiicados os agrupamentos de municípios epidêmicos com o programa TerraView. Resultados: Os valores do índice global de Moran foram 0,4 em 2003; 0,6 em 2007; e 0,5 em 2010 (p = 0,01), conirmando a existência de dependência espacial entre os municípios epidêmicos. O Box Map e o Moran Map identiicaram agrupamentos intermunicipais, interestaduais e fronteiriços com autocorrelação espacial estaticamente signiicante, sendo 10 clusters em 2003; 9 em 2007; e 8 em 2010 (p < 0,05). Discussão: Agrupamentos de municípios epidêmicos podem estar vinculados às diiculdades dos serviços de saúde em atuar articuladamente. Limitações estruturais podem ser superadas buscando a integração territorial para sustentação do planejamento e ações de controle, potencializando as intervenções no contexto espacial abrangente. Conclusão: A análise rotineira da autocorrelação espacial entre municípios epidêmicos, identiicando os agrupamentos com persistência espaço-temporal, poderá fornecer novo indicador de grande utilidade para o planejamento e priorização do controle integrado, no âmbito intermunicipal, interestadual e nas áreas de fronteiras, contribuindo para a redução das epidemias de malária.
epidemics in all of the municipalities of the region, in order to incorporate this information in the options of decision makers.
Signiicant autocorrelation values show that spatial dependence and inferential models should consider space to be formulated3, pointing out to priority areas for control actions.
The method used in Brazil to prioritize cities for malaria control is based on the Annual Parasite Index4. The sensitivity of this index is reduced after being applied to large geographic
spaces. However, it is known that malaria epidemics present patterns of spatial cluster, which often surpasses the limits and political-administrative divisions inside the municipal and state territories, thus requiring joint eforts to solve the problem. The epidemic process eventually needs international cooperation to be contained. Some studies identiied groups of regions to explain disease transmission, by applying the global and local Moran’s index, such as the classiication of several types of cancer in Germany5 and the spatial analysis of
dengue fever in the city of Rio de Janeiro6. The Moran’s indexes were also used to determine
priority areas for malaria control in Rondônia7, Mato Grosso8 and Roraima9.
The Moran’s indexes are indicated for the spatial analysis of areas when events are clustered by cities or other divisions characterizing regions, and when it is not possible to establish the exact location of the occurrences, but instead, values represented by indicators such as rates, proportions, means or medians10. The spatial disease cluster may be attributed to
demographic, environmental or sociocultural factors that are geographically superposed, referring to an unexpected cluster in space and/or time11. Therefore, knowing the structure
and spatial dynamics is important to characterize health-related situations12. This study aimed
at analyzing spatial dependence, autocorrelation, of malaria epidemics in the municipalities of the Brazilian Amazon, in 2003, 2007 and 2010, in order to create thematic maps that can contribute with the understanding about the spatial distribution of epidemic phenomena in the region.
METHODS
The Brazilian Amazon (BA) is the endemic area for malaria. It is composed of 807 cities belonging to the states of Acre (AC), Amapá (AP), Amazonas (AM), Maranhão (MA), Mato Grosso (MT), Pará (PA), Rondônia (RO), Roraima (RR), and Tocantins (TO). Out of these, 52 cities have borders with seven countries: Bolivia, Colombia, Guiana, French Guiana, Peru, Suriname and Venezuela. In order to understand disease control in this region, a lowchart was elaborated for the main procedures in each managerial department: Municipal Secretariat of Health (SMS), State Secretariat of Health (SES) and Ministry of Health (MS). Epidemic cities were identiied after the elaboration of an automated algorithm13 that
used codes from the Epi Info software14, which resulted in the Surveillance System for the
Incidence of Malaria in the Brazilian Amazon (SIMAM). This system processed data from 2003 to 2010, which were provided by MS. To identify epidemics, SIMAM calculated the 3rd
to a study conducted in Brazil15. The duration of the epidemics was classiied into: short
term (1 to 4 epidemic months during the year); mid-term (5 to 8 months); and long term (9 to 12 months).
The spatial dependence of epidemics was observed by the random variable proportion of epidemic months, in 2003, 2007 and 2010. These years were considered to be suicient to verify the spatial-temporal dynamics of autocorrelation. Autocorrelation derives from the statistical concept of correlation between two variables, and its formulation has been modiied in spatial studies3,10. This indicates that correlation is measured for the same
random variable in diferent locations in space. Spatial analysis was conducted in three stages with the TerraView software16: (1) visualization of the distribution according to the
duration of epidemics; (2) calculation of the global Moran’s Index (GMI); (3) calculation of the local Moran’s Index (LMI). The maps of the cities were obtained from the Computing Department of the Uniied Health System (SUS)17. The null hypothesis (H
0) tested by the
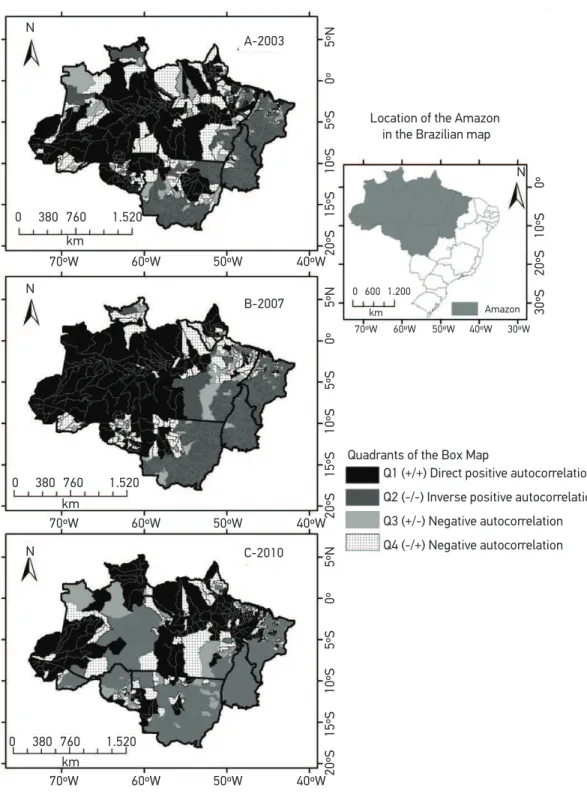
GMI was that of spatial independence between cities concerning the random variable. Positive values between 0 and +1 indicated direct autocorrelation, and negative values between 0 and -1 showed inverse autocorrelation, with a statistical signiicance test for p ≤ 0.01. The LMI produced normalized values, Z (values for the variable proportion of epidemic months subtracted from the mean and divided by standard deviation), for each city. It also generated the weighted mean of the variable for the respective neighboring cities, Wz. These values allowed identifying city clusters with a statistically signiicant pattern of spatial association. The values resulting from this operation represent the quadrants in the Moran scattering diagram. Quadrant 1 (Q1 +/+) was composed of cities with positive values from the normalized variable, being the weighted mean of the neighboring cities also positive, which meant direct positive spatial autocorrelation. In quadrant 2 (Q2 −/−), there were cities with negative values from the normalized variable, with negative weighted mean for the neighboring cities, which indicated inverse positive spatial autocorrelation. Quadrant 3 (Q3 +/−) had cities with positive values from the normalized variable, with negative weighted mean for the neighboring cities, which points to negative autocorrelation. Quadrant 4 (Q4 −/+) had cities with negative values from the normalized variable, with positive weighted mean for the neighboring cities, which also indicated negative spatial autocorrelation.
The Box Map was elaborated to identify spatial dependence, representing the LMI, in which Q1 represented cities with long term epidemics; Q2, cities with no epidemics or with shorter periods of epidemics; Q3, cities with epidemics that lasted longer, and neighboring cities without epidemics or with short term epidemics; and Q4, cities without epidemics or with short term epidemics, and neighboring cities with long term epidemics. The Moran Map was built with the same quadrants (Q1, Q2, Q3, Q4) to visualize only the areas that presented statistically signiicant autocorrelation (p ≤ 0.05). However, the 0 category (zero) was added to identify cities with non-signiicant autocorrelation. It is worth to mention that this project was approved by the Research Ethics Committee from the Medical School at
RESULTS
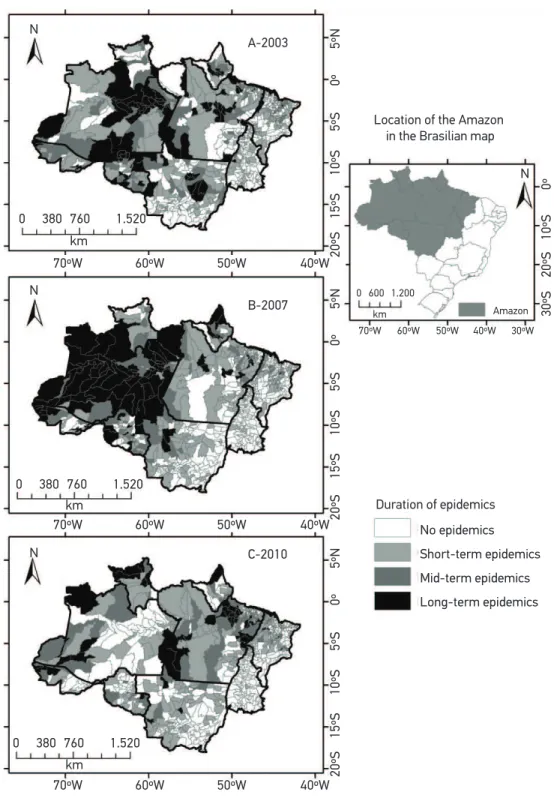
Planning and control actions for malaria in the BA are conducted by SMS, SES and MS, according to speciic attributions. Most control actions are daily executed by SMS, especially those involving diagnosis and treatment of the patient, active detection of cases, investigation of risk factors, control of vectors and health education. The attributes of SMS and SES are related to their respective political-administration territories, with the possibility of carrying out joint actions when the health issue surpasses territorial limits, since both interested parties have agreed to it. In 2003, 408,832 cases of the disease were notiied in BA; in 2007, 457,409 cases; and, in 2010, 333,372 cases. In 2003, there were short term epidemics in 208 cities (25.8% of the total number of municipalities in the region). This number reduced to 203 (25.2%), in 2007, and to 185 (22.9%), in 2010. Mid-term epidemics occurred in 103 cities (12.8%), in 2003; in 62 cities (7.7%), in 2007; and in 72 cities (8.9%), in 2010. Most cities with long term epidemics formed predominant clusters in states with higher incidence of malaria, while those with mid-term epidemics were closer to cities with long term epidemics. Cities with short term epidemics were sporadically distributed in the region. Some clusters transcended the geopolitical space of state divisions, also afecting international border areas in the states of AC, AM, AP, PA, RR and RO (Figures 1A to 1C). GMI values were: 0.4, in 2003; 0.6, in 2007; and 0.5, in 2010 (p = 0.01 in the three years), which conirms the existence of spatial dependence in epidemics in the cities of BA. Autocorrelation increased in 2007, in comparison to 2003, but, in 2010, numbers were similar to those of 2003. The results in the Box Map (Figure 2) enabled to verify the dynamics of the random variable in the cities, and it also identiied homogeneous areas. In Q1 (+/+), 198 cities were observed in 2003 (24.6% of the region); 159 (19.7%), in 2007; and 181 (22.4%), in 2010. Q1 incorporated cities with mid and long term epidemics, suggesting that cities with long term epidemics have strong spatial inluence on those with mid-term epidemics. Q2 (−/−) found most cities in the region, including those with shorter epidemics, or with no records of the epidemic phenomenon. In Q2, 403 cities were observed (50.1% of the region) in 2003; 473 (58.6%), in 2007; and 445 cities (55.1%) in 2010. In quadrant Q3 (+/−), 62 cities were detected (7.7% of the region) in 2003; 50 (6.2%), in 2007; and 59 (7.3%), in 2010. In Q4 (−/+), 142 cities were identiied (17.6% of the region) in 2003; 123 (15.2%), in 2007; and 120 (14.9%), in 2010. The maps generated by Box Map showed the autocorrelation measured by the LMI, regardless of the signiicance level and the variation of the attribute throughout time for most cities, even in states with low transmission of malaria, such as MT, TO and MA (Figures 2A to 2C).
Source: Surveillance System for the Incidence of Malaria in the Brazilian Amazon (SIMAM).
Figure 1. Distribution of cities with malaria epidemics, according to the duration of the epidemic phenomenon. Brazilian Amazon, 2003, 2007 and 2010.
70ºW 20ºS
15ºS
10ºS
5ºS
0º
5ºN
20ºS
30ºS
15ºS
20ºS
10ºS
10ºS
5ºS
0º
0º
5ºN
20ºS
15ºS
10ºS
5ºS
0º
5ºN
60ºW 50ºW 40ºW
70ºW 60ºW 50ºW 40ºW 30ºW
70ºW 60ºW 50ºW 40ºW
70ºW 60ºW 50ºW 40ºW
0 380 760
km
km
km
1.520
0 380 760 1.520
km 0 600 1.200
0 380 760 1.520
Location of the Amazon in the Brasilian map
Amazon
Duration of epidemics A-2003
N
N
B-2007 N
C-2010 N
No epidemics
Short-term epidemics
Mid-term epidemics
Source: Surveillance System for the Incidence of Malaria in the Brazilian Amazon (SIMAM).
Figure 2. Box Map for the proportion of epidemic months in the cities of the endemic area. Brazilian Amazon, 2003, 2007 and 2010.
70ºW 20ºS
15ºS
10ºS
5ºS
0º
5ºN
20ºS
30ºS
15ºS
20ºS
10ºS
10ºS
5ºS
0º
0º
5ºN
20ºS
15ºS
10ºS
5ºS
0º
5ºN
60ºW 50ºW 40ºW
70ºW 60ºW 50ºW 40ºW 30ºW
70ºW 60ºW 50ºW 40ºW
70ºW 60ºW 50ºW 40ºW
0 380 760
km
km
km
1.520
0 380 760 1.520
km 0 600 1.200
0 380 760 1.520
Location of the Amazon in the Brazilian map
Amazon
Quadrants of the Box Map
Q1 (+/+) Direct positive autocorrelation
Q2 (-/-) Inverse positive autocorrelation
Q3 (+/-) Negative autocorrelation
Q4 (-/+) Negative autocorrelation A-2003
N
N
B-2007 N
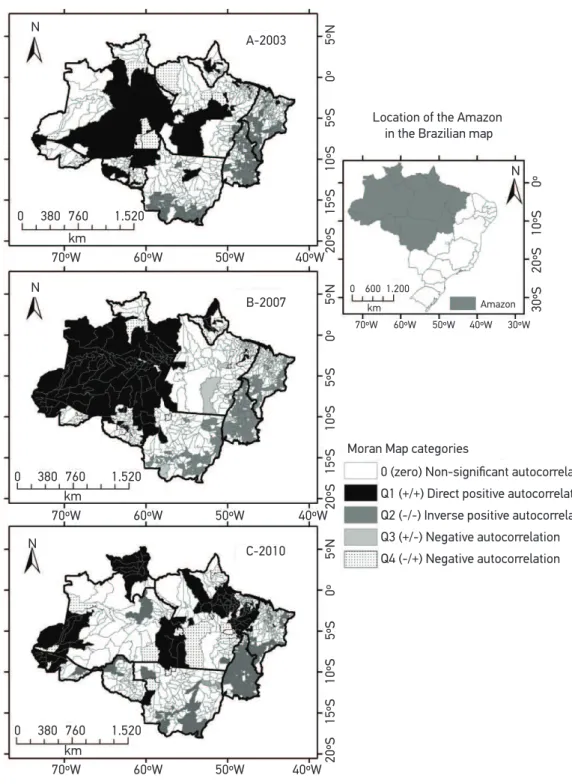
were 8 cities in 2003 (1.0%); 5 (0.6%), in 2007; and 5 (0.6%), in 2010. In Q3, no cities were present in the three years. In Q4 (−/+). 30 cities were detected in 2003 (3.7%); 21 (2.6%), in 2007; and 28 (3.5%), in 2010. No cities were present in Q4 in all of the analyzed years. The spatial dependence of epidemics in the cities was shown by the Moran Map, and clusters were located in Q1. In this quadrant, three types of clusters were observed: (1) intermunicipal cluster, in which all cities were part of the same state; (2) interstate cluster, in which cities belonged to different states; and (3) border cluster, in which cities belonged to one or more states, however, some of them were in international border areas.
In 2003, ten clusters were detected in the Q1 in the Moran Map. The irst one was composed of four cities located in the borders of AM (1), AC (3) and the frontier with Peru. The second had ten cities in the borders of AM (1), RO (5) and MT (4). The third cluster was comprised of six cities: AM (4), RR (2) and the border with Venezuela. The fourth cluster was composed of four cities: AM (3) and PA (1). The ifth one had ten cities: AM (3), AC (1), RO (6) and the frontier with Bolivia. The sixth cluster had 24 cities, all of them in AM. The seventh was comprised of 8 cities, all of them in PA. The eighth cluster had 5 cities, all of them in AP. The ninth cluster had 6 cities, all of them in MT. And the tenth cluster had 10 cities located in RO and in the frontier with Bolivia (Figure 3A).
The Moran Map showed that, in 2007, the 96 cities located in the Q1 formed a large cluster, which was subdivided into 9 clusters in order to facilitate geopolitical and administrative understanding. The irst one was composed of 14 cities located in AM (6), AC (8) and the border with Peru. The second one was composed of six cities located in AM (3) and MT (3). The third cluster had 11 cities located in AM (5), RR (4), PA (2) and in the frontier with Venezuela. The fourth cluster had six cities located in AM (4) and PA (2). The ifth one had six cities located in AM (3), AC (1), RO (2) and the frontier with Bolivia. The sixth cluster was composed of 37 cities located in AM and in the border with Colombia. The seventh cluster had three cities located in PA. The eighth cluster had ive cities located in AP and in the border with the French Guiana. The ninth cluster had four cities located in RO (Figure 3B).
Source: Surveillance System for the Incidence of Malaria in the Brazilian Amazon (SIMAM).
Figure 3. Moran Map for the proportion of epidemic months in cities of the endemic area. Brazilian Amazon, 2003, 2007 and 2010.
70ºW 20ºS
15ºS
10ºS
5ºS
0º
5ºN
20ºS
30ºS
15ºS
20ºS
10ºS
10ºS
5ºS
0º
0º
5ºN
20ºS
15ºS
10ºS
5ºS
0º
5ºN
60ºW 50ºW 40ºW
70ºW 60ºW 50ºW 40ºW 30ºW
70ºW 60ºW 50ºW 40ºW
70ºW 60ºW 50ºW 40ºW
0 380 760
km
km
km
1.520
0 380 760 1.520
km 0 600 1.200
0 380 760 1.520
Moran Map categories
0 (zero) Non-significant autocorrelation Q1 (+/+) Direct positive autocorrelation Q2 (-/-) Inverse positive autocorrelation Q3 (+/-) Negative autocorrelation Q4 (-/+) Negative autocorrelation
A-2003 N
N
B-2007 N
C-2010 N
Location of the Amazon
in the Brazilian map
DISCUSSION
The unacceptable load of malaria and its socioeconomic impact makes it important to improve the disease control. One of the issues is the operational limits of health services, including inadequate tools to interrupt transmissions in some locations18. In that
regard, the Federal Court of Accounts declared that it is important to raise awareness among administrators so that they can provide political and managerial support for the creation of surveillance and control actions toward malaria. Therefore, it would be possible to reduce the “exportation” of cases from states and cities with poor action
to others, where the action is more effective19. Some limitations can be overcome by
searching for territorial integration to support control actions in the cities, by involving the states20, and also the federal scope, in order to give more power to interventions in
a wider spatial context. The search for territorialization in health has been adopted by several initiatives; however, usually the concept of space is reduced to administration, so the potential of this concept is neglected for the identification of sanitary problems and proposals for intervention21. In the case of malaria epidemics, the need for the
proper management of the territory to achieve successful control became clear, due to its transcendence in the political-administrative space.
The distribution and duration of epidemics in BA may be connected to difficulties of the health services to give an articulate response with effective contention actions. The duration of the epidemics is marked by an interval, that begins and ends22, and a
period of time from one to four months was adequate to interrupt the phenomenon, since most cities could control the events in this period of time. Due to the diversity of factors involved in the transmission of malaria, its effective control requires the execution of integrated planning actions to neutralize the effect of spatial dependency of epidemics in the cities.
The patterns of morbidity and propagation of epidemics cannot be explained without an approach that considers space and time. The spatial distribution that was found provided the previous notion of groups of epidemic cities that required the most attention. However, it was necessary to improve the analysis by incorporating techniques of statistical classification of the spatial structure of epidemics, examining patterns and identifying clusters, according to Moran’s indexes. The values of spatial autocorrelation represented by the GMI were close to those observed for the risk of contracting malaria in the state of RR (≤ 0.5)9 and RO (0.5 to 0.7)7,however, they
were higher than the values found in MT (0.3 to 0.4)8. This shows that the duration of
and administrative. However, because this measure of autocorrelation produced a single value for the global set of the cities, it only expressed the spatial dependence of the region as a whole, and required details by the LMI.
By applying the referred index, it was possible to identify the homogeneous areas and to classify differentiated clusters, by ruling out the spatial randomization in the distribution of cities with longer epidemics. The clusters presenting statistically significant spatial autocorrelation, represented in Q1 of the Moran Map, were considered to be critical, since it gathered cities with more severe epidemic processes. The influence of neighboring cities in the dynamics of distributing the proportion of epidemic months caused changes, which could be seen in some clusters in the analyzed years. This occurrence was related to several factors, which contributed with the increasing incidence and the consequent production of malaria epidemics. However, it is important to emphasize that matters related to the intermunicipal organization of health services may have had strong influence on the longer duration of epidemics in homogeneous areas with positive direct autocorrelation, as demonstrated in Q1 in the Box Map and in the Moran Map. By improving the organization of the of the assistance network, it will be possible to achieve the regional integration of actions and health services with the integrated regional planning, which will be able to ensure qualified ongoing attention. This aspect is currently prioritized in SUS. The integration of health services in specific regions aims at ensuring full assistance, and counts on legal instruments that enable the financing of articulated actions between states and cities23. The execution
of integrated control actions can prevent the long duration of epidemics and reduce the high levels of incidence of the diseases. Even though the competences for control actions addressed to malaria are specifically defined for each managerial department24,
the planning system should work for an ongoing, articulated, integrated, solidary and harmonic activity of the three managerial departments. This type of work will lead to the consolidation of the planning culture simultaneously with the other developed actions, with established pacts and strict analysis of the role of each governmental sphere25.
for the risks imposed by malaria in international frontiers. In these areas, twin cities are important for mobility, which favors the transmission of malaria26, as it could be seen
in frontiers with the states of AC, AM, AP and RR. Other factors that contribute with the progress of the disease is the deforestation of large areas and the contact between lumberjacks, miners and indigenous populations27. Despite the identiied diiculties, the
public sector is still prevalent in the frontiers with regard to the operation of the basic health network, considering the possibility of integrating local health systems28. The mitigation
of the issue of malaria in frontier areas depends on the constant knowledge concerning the epidemiological situation, and also on the international cooperation between Brazil and the involved countries, which requires permanent articulation about planning and systematic execution of disease control. It is recommended that the Program for Malaria Control can ensure the analysis of the situation of the disease in frontier cities and their respective neighboring countries. Therefore, together with the Pan American Health Organization (OPAS), it is possible to articulate planning and disease control actions, using the already available mechanism from the Amazon Surveillance Network of Antimalarial
Resistance (RAVREDA) and from the Initiative Against Malaria in the Amazon (AMI)29.
CONCLUSION
This study showed there is spatial dependence of malaria epidemics in the cities of the BA, which is characterized by the direct and positive autocorrelation, and that the special dependence of epidemics determined the occurrence of epidemic clusters of cities with intermunicipal, interstate and inter-border characteristics. This scenario requires the permanent analysis of the spatial dependence of epidemics in the cities, by detecting clusters with space-temporal persistence and by characterizing them as important indicators for planning and priorities in terms of integrated control actions, be them intermunicipal, interstate or inter-borders, therefore contributing with the reduction in disease epidemics.
1. Carvalho MS, Souza-Santos R. Análise de dados espaciais em saúde pública: métodos, problemas, perspectivas. Cad Saúde Pública 2005; 21(2): 361-78.
2. Braz RM, Duarte EC, Tauil PL. Epidemiology of malaria in the municipality of Cruzeiro do Sul, State of Acre, Brazil, in 2010: uses of a control chart at the local level. Rev Soc Bras Med Trop 2012; 45(4): 526-9.
3. Câmara G, Monteiro AM, Fucks SD, Carvalho MS. Análise espacial e geoprocessamento. In: Druck S, Carvalho MS, Câmara G, Monteiro AMV (Org.). Análise espacial de dados geográicos. Brasília: EMBRAPA; 2004. p. 21-54.
4. Brasil. Ministério da Saúde. Secretaria Executiva. Plano Nacional de Saúde-PNS: 2012-2015 [Internet]. Brasília; 2012. Disponível em: http://conselho.saude.gov.br/ biblioteca/Relatorios/plano_nacional_saude_2012_2015. pdf. (Acessado em 11 de setembro de 2012).
5. Cromley EK, Cromley RG. An analysis of alternative classiication schemes for medical atlas mapping. Eur J Cancer 1996; 32A(9): 1551-9.
6. Almeida AS, Medronho RA, Valencia LI. Spatial analysis of dengue and the socioeconomic context of the city of Rio de Janeiro (Southeastern Brazil). Rev Saúde Pública 2009; 43(4): 666-743.
7. Rodrigues AF, Escobar AL, Souza-Santos R. Análise espacial e determinação de áreas para o controle da malária no Estado de Rondônia. Rev Soc Bras Med Trop 2008; 41(1): 54-64.
8. Atanaka-Santos M, Souza-Santos R, Czeresnia D. Análise espacial na estratiicação de áreas prioritárias para o controle da malária no Estado de Mato Grosso, Brasil. Cad Saúde Pública 2007; 23(5): 1099-112.
9. Dias RC. Uma contribuição ao estudo da malária no estado de Roraima e sua associação com a precipitação pluviométrica no período de 1985 a 1996. [tese de doutorado]. Rio de Janeiro: Escola Nacional de Saúde Pública da Fiocruz; 2003.
10. Câmara C, Carvalho MS, Cruz OG, Correa V. Análise espacial de áreas. In: Druck S, Carvalho MS, Câmara G, Monteiro AMV (Org.). Análise espacial de dados geográicos. Brasília: EMBRAPA; 2004. p. 157-82.
11. Werneck GL, Struchiner CJ. Estudos de agregados de doença no espaço-tempo: conceitos, técnicas e desaios. Cad Saúde Pública 1997; 13(4): 611-24.
12. Barcellos CC, Sabroza PC, Peiter P, Rojas LI. Organização espacial, saúde e qualidade de vida: análise espacial e uso de indicadores na avaliação de situações de saúde. IESUS 2002; 11(3): 129-38.
13. Braz RM, Duarte EC, Tauil PL. Caracterização das epidemias de malaria nos municípios da Amazônia Brasileira em 2010. Cad. Saúde Pública 2013; 29(5): 935-44.
14. Epi Info™. Database and statistics software for public health professionals. [computer program]. Version 3.5.1. Centers for Disease Control and Prevention (CDC). Atlanta (GA): Computorized Systems; 2008.
15. Braz RM, Andreozzi VL, Kale PL. Detecção precoce de epidemias de malária no Brasil: uma proposta de automação. Epidemiol Serv Saúde 2006; 15(2): 21-33.
16. TerraView. Programa para visualização e análise de dados geográficos. [computer program]. Version 4.1.0. Copyright 2001-2011, INPE, Tecgraf PUC-Rio e FUNCATEC Parceiros: LESTE/UFMG. São José dos Campos: Computorized Systems; 2011.
17. Brasil. Ministério da Saúde. Departamento de Informática do SUS. Mapas Tabwin [Internet] 2001 e 2005. Disponível em: http://www2.datasus.gov. br/DATASUS/index.php?area=060206&item=14. (Acessado em 04 de abril de 2012).
18. Alonso PL, Brown G, Arevalo-Herrera M, Binka F, Chitnis C, Collins F, et al. A research agenda to underpin malaria eradication. PLoS Med 2011; 8(1):e1000406.
19. Brasil. Tribunal de Contas da União. Secretaria-Geral de Controle Externo. Secretaria de Fiscalização e Avaliação de Programas de Governo. Avaliação do TCU sobre o Programa Nacional de Controle da Malária [Internet]. Brasília; 2004. Disponível em: http://portal2.tcu.gov. br/portal/pls/portal/docs/2054390.PDF. (Acessado em 06 de novembro de 2012).
20. Loiola CCP, da Silva CJM, Tauil PL. Controle da malária no Brasil: 1965 a 2001. Rev Panam Salud Publica 2002; 11(4): 235-44.
21. Monken M, Barcellos C. Vigilância em saúde e território utilizado: possibilidades teóricas e metodológicas. Cad Saúde Pública 2005; 21(3): 898-906.
22. Rouquayrol MZ. O processo epidêmico. In: Rouquayrol MZ, Filho NA (Org.). Epidemiologia & Saúde. Rio de Janeiro: Médica e Cientíica; 1999. p. 118-40.
24. Brasil. Ministério da Saúde. Secretaria de Vigilância em Saúde. Programa Nacional de Controle da Malária. Brasília: Editora MS; 2004. p. 41.
25. Brasil. Ministério da Saúde. Secretaria Executiva. PlanejaSUS): uma construção coletiva [Internet]. Brasília; 2009. Disponível em: http://bvsms.saude. gov.br/bvs/publicacoes/planejaSUS_livro_1a6.pdf. (Acessado em 11 de novembro de 2012)..
26. Brasil. Ministério da Integração Nacional. Grupo de Trabalho Interfederativo de Integração Fronteiriço. Bases para uma proposta de desenvolvimento e integração da faixa de fronteira. Brasília: MIN; 2010.
27. Peiter PC. A geograia da saúde na faixa de fronteira continental do Brasil na passagem do milênio [tese de doutorado]. Rio de Janeiro: Universidade Federal do Rio de Janeiro; 2005.
28. Levino A, Carvalho EF. Análise comparativa dos sistemas de saúde da tríplice fronteira: Brasil/ Colômbia/Peru. Rev Panam Salud Publica 2011; 30(5): 490-500.
29. Pan American Health Organization. RAVREDA-AMI: Amazon Network for the Surveillance of Antimalarial Drug Resistance (RAVREDA)/Amazon Malaria Initiative (AMI). [Internet]. 2012. Disponível em: http://www.paho.org/english/ad/dpc/cd/ ravreda-ami-obj.htm. (Acessado em 24 de junho de 2012].
Received on: 02/05/2013
Brazilian Journal of Epidemiology 2014;17(3): 615, 617, 619, 621, 623, 625 e 627 DOI: 10.1590/1809-4503201400030004
Article: Dependência espacial das epidemias de malária em municípios da Amazônia Brasileira
On pages 615, 617, 619, 621, 623, 625 e 627, where it reads:
Spatial dependence of malaria epidemics in municipalities of the Amazonian Ecosystem
It should read: