Incorrect patient positioning and the resultant image distortion occur in many radiographic examinations. This study aimed to assess the effect of tilting, rotation and tipping of the head on the accuracy of maxillofacial transverse measurements made on cone beam computed tomography (CBCT) scans. The CBCT scans were obtained in central position of 10 dry human skulls. Using three-dimensional (3D) Dolphin software, six positions namely 10° and 20° tilts, rotations and tips were reconstructed of central position. Transverse distances between landmarks were measured on 3D scans and the skulls. The intraclass correlation coefficient (ICC) and the Bland-Altman plot were used to compare the mean values measured by the two observers. For most landmarks, no significant differences were noted between the mean transverse distances measured in the six positions and those measured in central position on 3D scans (p>0.005). In conclusion, all measurements of transverse distances made on 3D scans in different positions were underestimated compared to the actual values measured on the skull.
Effect of Head Position on Maxillofacial
Transverse Measurements Made
o n t h e S k u l l a n d C o n e B e a m
C o m p u t e d To m o g r a p h y S c a n s
Abbas Shokri1, Amirfarhang Miresmaeili2,Nasrin Farhadian2, Sepideh Falah-kooshki3, Payam Amini4, Najmeh Mollaie5
1Dental Research Center, Department
of Oral and Maxillofacial Radiology, Faculty of Dentistry, Hamadan University of Medical Sciences, Hamadan, Iran
2Dental Research Center, Department
of Orthodontics, Faculty of Dentistry, Hamadan University of Medical Sciences, Hamadan, Iran
3Department of Oral and Maxillofacial
Radiology, Faculty of Dentistry, Kermanshah University of Medical Sciences, Kermanshah, Iran
4Department of Epidemiology and
Reproductive Health, Reproductive Epidemiology Research Center, Royan Institute for Reproductive Biomedicine, ACECR, Tehran, Iran
5Department of Orthodontics, Faculty
of Dentistry, Rafsanjan University of Medical Sciences, Rafsanjan, Iran
Correspondence: Sepideh Falah-kooshki, Department of Oral & Maxillofacial Radiology, Faculty of Dentistry, Kermanshah University of Medical Sciences, Kermanshah, Iran. Tel: +98-83-37277164. Email: [email protected]
Key Words: cone beam computed tomography, transverse
measurement, head position.
Introduction
Clinical success of orthodontic treatment is largely determined by the ability of clinician to determine the relationships among the dental structures, soft tissue and bone. In the recent decade, several methods were introduced for assessment of the maxillofacial region. Development of CBCT technology revolutionized dental science. This technology is commonly used for diagnostic purposes, orthodontic and maxillofacial analyses and assessment of orthopedic anomalies (1). An accurate evaluation of the dental, skeletal, and soft-tissue relationships through the normative values of three-dimensional (3D) cephalometric parameters, specifically palatal and alveolar bone thickness, mandibular body and maxillary basal curve length, and basal arch form have been demanded (2). It visualizes the position of impacted and supernumerary teeth and their relation with the adjacent roots and anatomic structures and provides valuable information regarding the morphology of the palate and dimensions and inclinations of roots, root resorption or alveolar bone width available for buccolingual tooth movement (3). Also, CBCT enables accurate implant placement by allowing three-dimensional measurement of bony structures. By slight change in patient position, the accuracy of CBCT remains almost unchanged. Also,
CBCT enables 3D assessment of facial structures and can generate images with high resolution and accuracy. In early 1982, CBCT system was developed for angiography and subsequently for maxillofacial imaging. An ideal image is one that enables different measurements with high accuracy. However, problems such as image distortion are among the obstacles in this regard. Image distortion refers to change in size and shape of image; thus, it may compromise the accuracy of measurements made on the image. Two important factors may cause distortion namely patient position and devices used for patient positioning (4). Risk of improper positioning of patients is high in extra-oral radiographies. The accuracy of CBCT is less commonly affected by erroneous patient positioning (4-6).
This study aimed to assess the effect of head position on the accuracy of maxillofacial transverse measurements made on CBCT scans in central position compared to the actual values measured on the skull.
Material and Methods
Effect of head position This study was performed on 10 dry human skulls
in Hamadan University of Medical Sciences, School of Dentistry in 2013-2014.
In the study by Cheung et al. (7) in 2013, the difference in Antegonion-Antegonion between PA cephalometry and the standard method was estimated to be 3.57 (±2.43). Based on their results, sample size at 95% confidence interval and study power of 90% was calculated to be 10 human skulls.
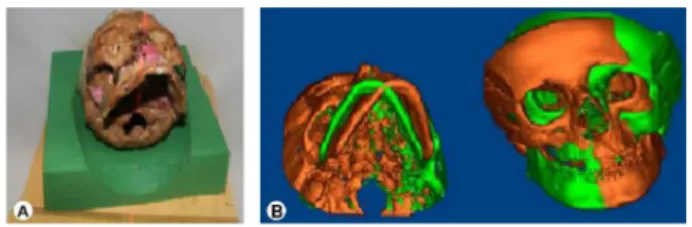
Skulls with fractures or pathological lesions were excluded. During imaging, the mandibular condylion was in the glenoid fossa and the teeth were fixed with wax. The CBCT scans were taken using NewTom 3G volume scanner (QR SRL, Verona, Italy) with exposure settings of 110 kVp, 2.8 mA, 3.6 seconds and 12inch field of view. Images were processed using NNT Viewer software (QR SRL, Verona, Italy). The skulls were adjusted in central position. Due to differences in the anatomical dimensions of the right and left sides, tilting and rotation of the skulls were only applied to the right side.
In the tilted position, the midsagittal plane of skulls were tilted to the right side (8) (Fig. 1). In the rotated position, the skulls were rotated towards the right side (9) (Fig. 2).
Tipped position: The skulls were tipped downward (10) (Fig. 3).
In the central position, laser light was adjusted to the mid-sagittal plane. In this position, the Frankfurt plane of the skulls was perpendicular to the horizontal plane.
The transverse distances between the below mentioned landmarks were measured.
Jugale (J): The intersection of the outline of the maxillary tuberosity and zygomatic buttress in the right and left sides (7).
Antegonion (AG): The notch at the inferior-lateral margin of AG protuberance in the right and left sides (7).
Zygomaticofrontal suture: A cranial suture between the frontal and zygomatic bones. This suture only contacts the lateral wall of the orbit. Zygomatic arch is formed by the zygomatic process of the temporal bone. It extends to the external auditory meatus in the lateral part of the skull (11).
Width of nasal pyriform (nasal cavity at the widest point; NC): Is a cavity filled with air in the mid-face (11).
Condylion: Is the most-lateral point of the mandible, placed in the glenoid fossa of the temporal bone (11).
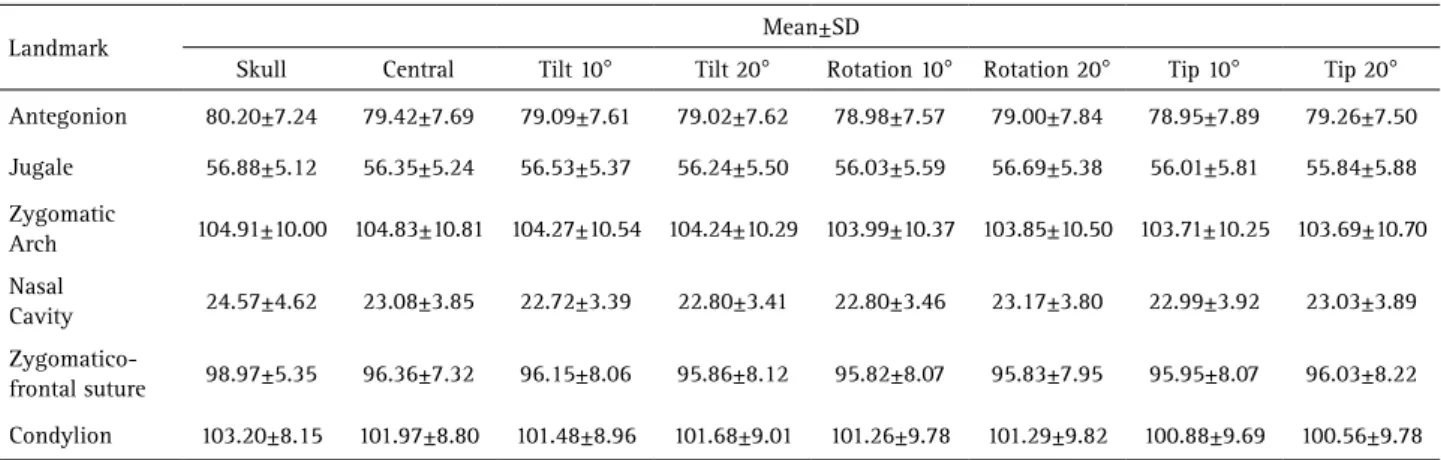
The transverse distances between the above-mentioned anatomic landmarks were measured on each of the 10 skulls using a digital caliper (Mitutoyo, Japan). Using Dolphin 3D software (version 11.7, Dolphin Imaging & Management Solutions, Chatsworth, CA, USA), the central position in each skull was reconstructed in axial, sagittal and coronal planes three-dimensionally. Using this position as a template, the other six positions namely 10° and 20° tilts, 10° and 20° rotations and 10° and 20° tips were reconstructed. In Figure 1, green color indicates the hard tissue of skull in central position and brown color shows that the hard tissue of skull has tilted to the right by 20 degrees. In Figure 2, green color indicates the hard tissue of skull in central position and brown color shows that the hard tissue of skull has rotated to the right by 20 degrees. In Figure 3, green color indicates the hard tissue of skull in central position and brown color shows that the hard tissue of skull has tipped downward by 20 degrees (rotated downward for 20 degrees).
Next, in each of the seven positions of each skull, transverse distances between reference points were measured and the values measured on the skulls and on CBCT scans in the seven positions were compared. The transverse distances measured in tilted, rotated and tipping
Figure 2. The 20° rotating of the skull (A). The 20° rotation of the skull three-dimensionally reconstructed from the central position. Green color indicates the hard tissue of skull in central position and brown color shows that the hard tissue of skull has rotated to the right by 20° (B).
Figure 1. The 20° tilting of the skull (A). The 20° tilting of the skull three-dimensionally reconstructed from the central position. Green color indicates the hard tissue of skull in central position and brown color shows that the hard tissue of skull has tilted to the right by 20° (B).
A. Shokri et al.
positions were compared with those measured in central position separately for each landmark. Paired t-test was applied to compare the mean values for each position (separately for each landmark) with the gold standard. The R software was used to compare the mean (±standard deviation) values measured on the skull and on 3D scans of each skull in different positions and also to compare the values measured in each of the tilted, rotated and tipping positions with those measured in central position. Analysis of the data was carried out with 95% confidence interval. The data were analyzed using SPSS version 21 (Microsoft, IL, USA) and R software version 3.0.2 (random effects model and Bootstrap model) with 95% confidence interval. To compare the mean values measured by the two observers, ICC and the Bland-Altman plot were used.
Results
In this study, transverse distances between anatomic landmarks were measured on each of the 10 skulls. The mean and standard deviation values of the measurements are presented in Table 1. Since the assumption of sphericity was not met for repeated measures ANOVA, an alternative test had to be used. First the Generalized Estimating Equation (GEE) model was fitted in which, the difference among the skulls was not considered and only one correlation structure was considered for all skulls. This model did not have a suitable fitness and was replaced with random mixed effects model in which, the difference among the skulls was taken into account. This model had an ICC of over 90% (Table 2), which showed very good fitness and justified taking into account the differences among the skulls. Six different models of cluster data analysis with random mixed effects are presented in Table 3. The R software was used. The absolute t-value was compared with 2.447 (obtained from distribution of t and two-way level of significance of 0.05 and degree of freedom of 6). If the absolute t-value was greater than 2.447, the null
hypothesis would be refuted; that is a significant difference existed among the measurements made in central position and those made in other positions. If the absolute t-value was smaller than 2.447, the null hypothesis would be accepted; that is, no significant differences existed between measurements made in central position and those made in other positions. The agreement between the observers was assessed by calculating ICC and drawing the Bland-Altman plot for the minimum and maximum values.
Discussion
Accurate diagnosis of transverse intermaxillary discrepancies requires precise clinical information and radiographic assessments. Data obtained via CBCT can help detect anatomical and pathologic changes (11). Orthodontic treatments are performed aiming to correct the growth pattern and incorrect relation between the teeth. Successful orthodontic treatment and surgical treatment planning for some anomalies require precise and reliable imaging of craniofacial complex (12). In our study, the skulls were fixed during imaging. It has been confirmed that head position plays an important role in identification of landmarks and cephalometric measurements at both sides (7). To maintain the skull in central position, a Styrofoam sheet was used. Cheung et al. (7) used screws and springs for fixing the skull position; these screws and springs were not inserted in anatomic areas under the study. Nonetheless, artifacts due to these screws and springs decreased the accuracy of measurements. In our study, central position of the skull was reconstructed in three planes of axial, coronal and sagittal using Dolphin 3D software. Then, using the central position as a reference, tilted, tipping and rotated positions were reconstructed. Measurements of transverse distances of the skull made in central, 10° and 20° tilted, 10° and 20° rotated and 10° and 20° tipping positions were underestimated compared to the actual measurements made on the skulls. Based on the literature, regarding the
Table 1. Comparison of measurements made on the skull and those made on 3D scans in central and six other positions (in mm)
Mean±SD Landmark
Tip 20°
Tip 10°
Rotation 20°
Rotation 10°
Tilt 20°
Tilt 10°
Central Skull
79.26±7.50 78.95±7.89
79.00±7.84 78.98±7.57
79.02±7.62 79.09±7.61
79.42±7.69 80.20±7.24
Antegonion
55.84±5.88 56.01±5.81
56.69±5.38 56.03±5.59
56.24±5.50 56.53±5.37
56.35±5.24 56.88±5.12
Jugale
103.69±10.70 103.71±10.25
103.85±10.50 103.99±10.37
104.24±10.29 104.27±10.54
104.83±10.81 104.91±10.00
Zygomatic Arch
23.03±3.89 22.99±3.92
23.17±3.80 22.80±3.46
22.80±3.41 22.72±3.39
23.08±3.85 24.57±4.62
Nasal Cavity
96.03±8.22 95.95±8.07
95.83±7.95 95.82±8.07
95.86±8.12 96.15±8.06
96.36±7.32 98.97±5.35
Zygomatico-frontal suture
100.56±9.78 100.88±9.69
101.29±9.82 101.26±9.78
101.68±9.01 101.48±8.96
101.97±8.80 103.20±8.15
Effect of head position accuracy of measurements made on CBCT scans, some
authors (13) believe that the values measured on CBCT scans are underestimated compared to the actual values while some others believe that the dimensions measured on CBCT scans have 1:1 ratio to actual dimensions. Kamburoglu and Kursun (14) compared the accuracy of linear measurements made on CBCT (Accuitomo3D) with physical measurements made on dry human skull as the gold standard and showed that all measurements made on CBCT were highly accurate; which is in accordance with our observations. Lascala et al. (15) stated that measurements made on dry skull were always greater than the measurements made on CBCT scans, although this difference was only noticeable for structures located in the base of skull. Their findings were in line with ours. Underestimation of values measured on CBCT scans is due to the following reasons:
According to Baumgaertel et al. (16) one reason for underestimation of values measured on CBCT is the measurement error. Caliper measures the bone from mesial to distal and from buccal to lingual; whereas, software measures the distances between the most mesial to the most distal and the most buccal to the most lingual voxels on 3D images. Since each voxel has a volume and the software measures the distance from the midpoint of the most mesial voxel to the midpoint of the most distal voxel (or the midpoint of the most buccal voxel to the midpoint of the most lingual voxel), part of the volume of each voxel may be lost (14-16). Their findings were in agreement with ours.
Based on the results of Lund et al. (17) voxel size also plays a role in underestimation of values measured on CBCT scans.
Planes used in radiography may not be the same as the planes used in the clinical setting. As the result, measurements made on radiographs would be different from the clinical measurements to some extent.
Clinical measurements (gold standard) made by caliper have some degrees of errors.
In our study, for most landmarks, no significant
Table 3. Comparison of the values of transverse distances measured on the skull and those measured on 3D scans in central and six other positions separately for each landmark
T Value Std. error Estimation Position Antegonion -1.12 0.2953 -0.3300 Tilt 10º -1.35 0.2953 -0.400 Tilt 20º -1.49 0.2953 -0.440 Rotation 10º -1.42 0.2953 -0.420 Rotation 20º -1.59 0.2953 -0.470 Tip 10º -0.54 0.2953 -0.160 Tip 20º Jugale 0.66 0.2723 0.180 Tilt 10º -0.40 0.2723 -0.110 Tilt 20º -1.18 0.2723 -0.320 Rotation 10º 1.25 0.2723 0.340 Rotation 20º -1.25 0.2723 -0.340 Tip 10º -1.87 0.2723 -0.510 Tip 20º Zygomatic Arch -1.74 0.3213 -0.560 Tilt 10º -1.83 0.3213 -0.590 Tilt 20º -2.61* 0.3213 -0.840 Rotation 10º -3.05* 0.3213 -0.980 Rotation 20º -3.48* 0.3213 -1.120 Tip 10º -3.54* 0.3213 -1.140 Tip 20º Nasal Cavity -1.37 0.2615 -0.360 Tilt 10º -1.07 0.2615 -0.280 Tilt 20º -1.07 0.2615 -0.280 Rotation 10º 0.34 0.2615 0.900 Rotation 20º -0.34 0.2615 -0.900 Tip 10º -0.19 0.2615 -0.500 Tip 20º Zygomatico-frontal suture -0.80 0.2596 -0.208 Tilt 10º -1.93 0.2596 -0.502 Tilt 20º -2.09 0.2596 -0.542 Rotation 10º -2.05 0.2596 -0.532 Rotation 20º -1.95 0.2596 -0.412 Tip 10º -1.28 0.2596 -0.332 Tip 20º Condylion -0.91 0.5357 -0.486 Tilt 10º -0.54 0.5357 -0.290 Tilt 20º -1.33 0.5357 -0.710 Rotation 10º -1.27 0.5357 -0.680 Rotation 20º -2.03 0.5357 -1.090 Tip 10º -2.63* 0.5357 -1.410 Tip 20º
*: Significant difference. Table 2. The intraclass correlation coefficient for each landmark
Intra Class Correlation Landmark
58.53/ (58.53+0.43)= 0.99 Antegonion
30.40/ (30.40+0.37)= 0.98 Jugale
109.76/ (109.76+0.51)= 0.99 Zygomatic Arch
13.23/ (13.23+0.58)= 0.95 Nasal Cavity
63.38/ (63.38+0.33)= 0.99
Zygomatico-frontal suture
A. Shokri et al.
differences existed in the mean transverse distances measured in tilted, rotated and tipping positions on 3D scans with the actual values. The highest and the lowest intraobserver agreement for the first observer for the distances measured for each landmark in 10 skulls (10 measurements made for each landmark) belonged to antegonion and zygomatic arch (99%), and the nasal cavity (95%), respectively. Hassan et al. (9) and Beialy et al.(12) indicated that accuracy and reliability of CBCT measurements were not affected by changes in the position of skull. Their findings were in line with part of our results. Periago et al.(18) concluded that many transverse distances measured by Dolphin 3D software had significant differences with actual anatomical dimensions of the skull. Their results were in contrast to our findings. In our study, the difference in the mean transverse distances measured on 3D scans and the gold standard was approximately 1mm; this result was similar to that of Bassam et al. They reported that the difference in dimensions measured on 2D tomography and gold standard (skull) in both ideal and rotated positions was minimal (about 1mm). The difference between measurements made on 3D scans and the gold standard in both ideal and rotated positions was relatively small (0.5mm) (19). Several studies have assessed the accuracy and reliability of measurements made on CBCT scans and in most cases, no significant differences existed in measurements made on CBCT scans in comparison with the gold standard values (measured by caliper on the skulls) (20, 21). Comparison of the agreement between the observers for measurements made on the skull and CBCT scans in different positions revealed that the highest agreement was 100% and the lowest was 81% (jugale landmark).
In conclusion, For most landmarks, no significant differences were noted between the mean transverse distances measured in the six positions and those measured in central position on 3D scans (p>0.005). All measurements of transverse distances made on 3D scans in different positions of central, 10° tilt, 20° tilt, 10° rotation, 20° rotation, 10° tip and 20° tip were underestimated compared to the actual values measured on the skull.
References
1. Nikneshan S, Aval SH, Bakhshalian N, Shahab S, Mohammadpour M, Sarikhani S. Accuracy of linear measurement using cone-beam computed tomography at different reconstruction angles. Imaging Sci Dent 2014;44:257-262.
2. Lisboa C de O, Masterson D, Motta AF, Motta AT. Reliability and reproducibility of three-dimensional cephalometric landmarks using CBCT: a systematic review. J Appl Oral Sci 2015;23:112-119.
3. White SC, Pharoah JM. Oral radiology principles and interpretation. 7th edition. Canada: Mosby; 2014.
4. Shahidi Sh, Feiz A. Effect of minor amendments of patient’s position on the accuracy of linear measurements yielded from cone beam computed tomography. J Dent (Shiraz) 2013;14:1-5.
5. Beaini TL, Dias PE, Melani RF. Dry skull positioning device for extra-oral
radiology and cone-beam CT. Int J Legal Med 2014;128:235-241. 6. Halperin-Sternfeld M, Machtei E, Balkow Ch, Horwitz J. Patient
movement during extraoral radiographic scanning. Oral Radiol 2016;32:40-47.
7. Cheung G, Goonewardene MS, Islam SM, Murray K, Koong B. The validity of transverse intermaxillary analysis by traditional PA cephalometry compared with cone-beam computed tomography. Aust Orthod J 2013;29:86-95.
8. van Vlijmen OJ, Bergé SJ, Swennen GR, Bronkhorst EM, Katsaros C, Kuijpers-Jagtman AM. Comparison of cephalometric radiographs obtained from cone-beam computed tomography scans and conventional radiographs. J Oral Maxillofac Surg 2009;67:92-97. 9. Hassan B, van der Stelt P, Sanderink G. Accuracy of three-dimensional
measurements obtained from cone beam computed tomography surface-rendered images for cephalometric analysis: influence of patient scanning position. Eur J Orthod 2009;31:129-134.
10. M McDowell R. The use of lateral head radiographs for evaluating orthodontic results as distinguished from growth changes: Part I. Technique and statement of problem. American J Orthod Oral Surg 1941;27:59-74.
11. Devanna R. Two-dimensional to dimensional: A new three-dimensional cone-beam computed tomography cephalometric analysis. J Orthod Res 2015;3:30-37.
12. El-Beialy AR, Fayed MS, El-Bialy AM, Mostafa YA. Accuracy and reliability of cone-beam computed tomography measurements: Influence of head orientation. Am J Orthod Dentofacial Orthop 2011;140:157-165.
13. Lagravère MO, Carey J, Toogood RW, Major PW. Three-dimensional accuracy of measurements made with software on cone-beam computed tomography images. Am J Orthod Dentofacial Orthop 2008;134:112-116.
14. Kamburoglu K, Kursun S. A comparison of the diagnostic accuracy of CBCT images of different voxel resolutions used to detect simulated small internal resorption cavities. Int Endod J 2010;43:798-807. 15. Lascala CA, Panella J, Marques MM. Analysis of the accuracy of linear
measurements obtained by cone beam computed tomography (CBCT-NewTom). Dentomaxillofac Radiol 2004;33:291-294.
16. Baumgaertel S, Palomo JM, Palomo L, Hans MG. Reliability and accuracy of cone-beam computed tomography dental measurements. Am J Orthod Dentofacial Orthop 2009;136:19-25.
17. Lund H, Gröndahl K, Gröndahl HG. Accuracy and precision of linear measurements in cone beam computed tomography Accuitomo tomograms obtained with different reconstruction techniques. Dentomaxillofac Radiol 2009;38:379-386.
18. Periago DR, Scarfe WC, Moshiri M, Scheetz JP, Silveira AM, Farman AG. Linear accuracy and reliability of cone beam CT derived 3-dimensional images constructed using an orthodontic volumetric rendering program. Angle Orthod 2008;78:387-95.
19. Greiner M, Greiner A, Hirschfelder U. Variance of landmarks in digital evaluations: comparison between CT-based and conventional digital lateral cephalometric radiographs. J Orofac Orthop 2007;68:290-298. 20. El-Mangoury NH, Shaheen SI, Mostafa YA. Landmark identification
in computerized posteroanterior cephalometrics. Am J Orthod Dentofacial Orthop 1987;91:57-61.
21. Oz U, Orhan K, Abe N. Comparison of linear and angular measurements using two-dimensional conventional methods and three-dimensional cone beam CT images reconstructed from a volumetric rendering program in vivo. Dentomaxillofac Radiol 2011;40:492-500.