CHAPTER 7
Calibration models to measure body composition in taller subjects
using DXA
41Analiza M. Silva, Fátima Baptista, Claudia S. Minderico, Alexandra R. Rodrigues, Angelo Pietrobelli, Pedro J. Teixeira and Luis B. Sardinha
ABSTRACT
The aims of this study were to assess the accuracy of DXA whole body composition measurements performed with the knees bent compared to the standard position and to develop calibration equations for DXA [ie, bone mineral content (BMC), fat mass (FM) and lean soft tissue (LST)] body composition measurements in subjects using the knees bent during the whole body scan. DXA was used to measure body composition in 104 Caucasian males and females. Comparison of means and linear regression analysis were used to test the performance of DXA measurements and to develop calibration models. For the entire sample, using the knees bent, BMC and FM were overestimated by ~2.6% and ~9.2%, respectively, while LST was underestimated by ~4.0% (p<0.001). The regression between BMCKneesBent and the standard position did not differ from the line of identity (p>0.05), while the slope differed from 1 for FM and LST (p <0.05). New models were developed for BMC, FM and LST. For FM, the significant predictors were FMKneesBent, age, lower limbs fat mass (LLFM), and the knees bent height (KBH) while for LST, were LSTKneesBent, LLFM, age, and KBH. Finally, for BMC, BMCKneesBent, age, LLFM, and LLFM x sex interaction were associated with the reference BMC. These findings show that performing body composition measurements with the knees bent differ from the standard position. Hence, the recommendation of this technique in subjects taller than the DXA scan area should be accomplished by using correction models for BMC, FM, and LST developed for specific DXA instrument.
“What is required is not a lot of words, but effectual ones.”
Seneca
41
INTRODUCTION
Assessment of body composition is important for achieving a better
understanding of nutritional status and disease processes, and evaluating treatments and interventions. An important advance in body composition research is the availability of dual-energy x-ray absorptiometry (DXA) for partitioning body mass into three
components: fat mass (FM), lean soft tissue (LST), and bone mineral content (BMC) (1). At present there are several different body fat measurement methods that can be applied in the clinical setting (2). One traditional research approach (3, 4) is to evaluate a subject’s body fat based on a two-compartmental (2C) model, FM and fat-free mass by hydrostatic weighing and more recently, air displacement plethysmography. The addition of total body water estimation by isotope dilution allows the development of a 3C molecular model (4). The 3C molecular model can then be extended to a 4C molecular model by adding an estimate of bone mineral by DXA (5, 6). Many investigators show that multicompartimental models provide the criterion or gold standard measurements of FM (5-7). Nevertheless, these models are costly, laborious, and require sophisticated technological analysis. For these reasons, dual-energy X-ray absorptiometry has rapidly gained acceptance as a reference method for body
composition analysis. Originally designed to determine bone mineral density (BMD), DXA technology has subsequently been adopted for the assessment of whole body composition, which has enabled rapid, noninvasive fat mass estimates with minimal radiation exposure. DXA also has the advantage of being a 3C molecular model that quantifies FM, LST, and BMC and also yields regional as well as total body values. However, DXA is not without limitations, and, although a precise measurement of body composition is provided, there are still considerable concerns about its validity,
DXA system cannot accommodate subjects with severe or morbid obesity without adopting a different procedure (14). As well, to evaluate subjects taller than 193 cm in certain DXA instruments, whole-body scans cannot be obtained because part of the body will be outside the scan area, unless the feet are truncated. However, when multicompartimental molecular models are used to estimate several components, this technique would not enable us to use the correct BMC estimation, except if the knees are bended (15). Regarding that in specific situations it is critical to measure people taller than the DXA scan area allows, namely in the daily clinical practice of athletes, the use of the knees bent position offers a possibility to perform complete whole-body scans. This led us, in the current study, to critically evaluate the implications of
adopting this position on DXA body composition measurements. Therefore, the aim of this investigation was twofold: compare DXA whole body composition measurements performed in subjects shorter than the DXA scan area using the knees bent and in the standard position; and to develop predictive equations for DXA body composition measurements (ie, BMC, FM and LST) to be used in subjects taller than the scan area.
METHODS
Subjects and protocol
Anthropometric measurements
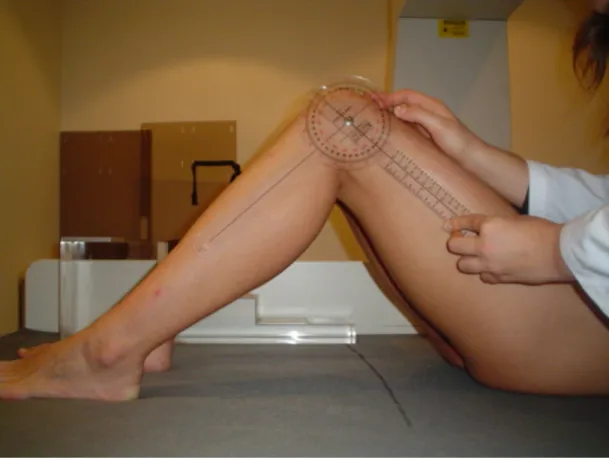
After voiding, body weight and height were measured on an electronic scale with a stadiometer (SECA, Hamburg, Germany). Weight was measured to the nearest 0.01 kg. Height was measured to nearest 0.1 cm, according to Lohman’s procedure (16). Lower extremity length was performed with an anthropometer. The landmark used to assess the level of the hip joint was the trochanteric height (17). A goniometer
(Sammons Preston, Inc., Bolingbrook, IL, USA) was used to establish 90º as the angular knees reference position throughout the whole-body scan with the knees bent, as
Figure 7.1. Whole-body scan performed in the knees bent position
Dual Energy X-Ray absorptiometry
manual using the standard analysis protocol. Based on ten subjects, the coefficient of variation in our laboratory for BMC is 1.6 %, for FM is 2.9 % and for LST is 1.7 %.
Statistical analysis
Comparison of means was used to test the differences between DXA measurements using the knees bent position and the reference position.
In order to test the validity of the body composition measurements with the knees bent the subjects studied were below 193 cm. Therefore, linear regression
analysis were performed to developed models, separately, for BMC, FM, and LST using the standard position as the dependent variables and BMC, FM, and LST using the knees bent, respectively, as the independent variables. Intercept and slope were tested. Bland-Altman analysis (18) was used to test the agreement between methods. Multiple regression analysis was then used to develop BMC, FM, and LST prediction equations with sex, BMC, FM, and LST with the knees bent and all the possible covariates, as well as interactions between sex and all the potential variables. The adequacy of the final prediction models was assessed by testing the normality of the residuals and the correlation of the absolute residuals with the variables in the models. A variance inflation factor for each independent variable was also calculated to evaluate multicollinearity (19).
that predicted value (observed - predicted), 4) repeating steps 1–3 for all observations, and 5) taking the sum of squares (SS) of all residuals. Finally, the PRESS statistic is a function of these residuals:
PRESS = SS (PRESS residuals) (1) The PRESS statistic is never smaller than SS (error) from the ANOVA table. Hence, an alternative measure of model adequacy, as suggested by Myers (19), is defined as:
R2= 1-[PRESS/SS(total)] (2) Similarly, an alternative measure to the ordinary standard error of estimation (SEE), termed the PRESS SEE can be defined as
SEEPRESS = √ (PRESS/n) (3) where n, is number of observations. Validation using the PRESS procedure is similar to applying the equation to an independent sample because the PRESS residual is obtained for the observations that are not included in the data when the equation is derived (21).
Bland-Altman analysis was performed using MedCalc Statistical Software (2003, MedCalc Software, Mariakerke, Belgium). Data were analysed using SPSS (SPSS inc., version 12.0, Chicago, IL, USA) with type I error set at p<0.05.
RESULTS
Subject Characteristics
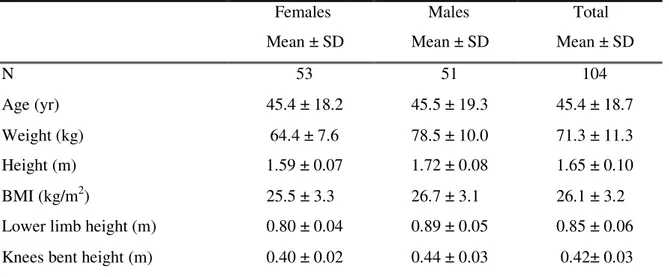
Table 7.1 – Subjects characteristics for the whole group.
Females Males Total Mean ± SD Mean ± SD Mean ± SD
N 53 51 104
Age (yr) 45.4 ± 18.2 45.5 ± 19.3 45.4 ± 18.7 Weight (kg) 64.4 ± 7.6 78.5 ± 10.0 71.3 ± 11.3 Height (m) 1.59 ± 0.07 1.72 ± 0.08 1.65 ± 0.10 BMI (kg/m2) 25.5 ± 3.3 26.7 ± 3.1 26.1 ± 3.2 Lower limb height (m) 0.80 ± 0.04 0.89 ± 0.05 0.85 ± 0.06 Knees bent height (m) 0.40 ± 0.02 0.44 ± 0.03 0.42± 0.03
Abbreviations: N, number of subjects; SD, standard deviation; BMI, body mass index.
Standard position vs. knees bent position
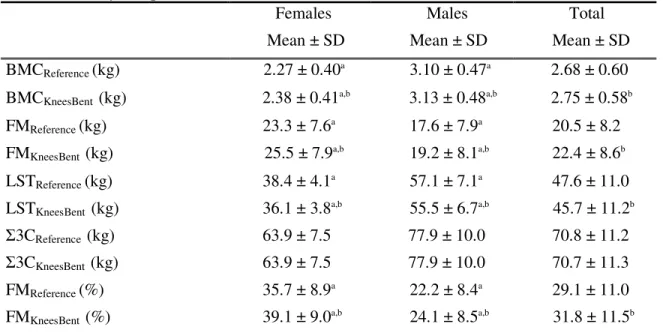
Table 7.2. Body composition results from DXA
Females Males Total Mean ± SD Mean ± SD Mean ± SD BMCReference (kg) 2.27 ± 0.40a 3.10 ± 0.47a 2.68 ± 0.60 BMCKneesBent (kg) 2.38 ± 0.41a,b 3.13 ± 0.48a,b 2.75 ± 0.58b FMReference (kg) 23.3 ± 7.6a 17.6 ± 7.9a 20.5 ± 8.2 FMKneesBent (kg) 25.5 ± 7.9a,b 19.2 ± 8.1a,b 22.4 ± 8.6b LSTReference (kg) 38.4 ± 4.1a 57.1 ± 7.1a 47.6 ± 11.0 LSTKneesBent (kg) 36.1 ± 3.8a,b 55.5 ± 6.7a,b 45.7 ± 11.2b 3CReference (kg) 63.9 ± 7.5 77.9 ± 10.0 70.8 ± 11.2 3CKneesBent (kg) 63.9 ± 7.5 77.9 ± 10.0 70.7 ± 11.3 FMReference (%) 35.7 ± 8.9a 22.2 ± 8.4a 29.1 ± 11.0 FMKneesBent (%) 39.1 ± 9.0a,b 24.1 ± 8.5a,b 31.8 ± 11.5b
Abbreviations: SD, standard deviation; BMC, bone mineral content, FM, fat mass; LST, lean soft tissue, 3C, sum of the three-component (BMC, FM, and LST); %FM, percent fat mass.
a
Males differed from females (p <0.001); bDXA measurements with the knees bent differed from the reference position (p <0.001).
BMC reference position vs. BMC knees bent position
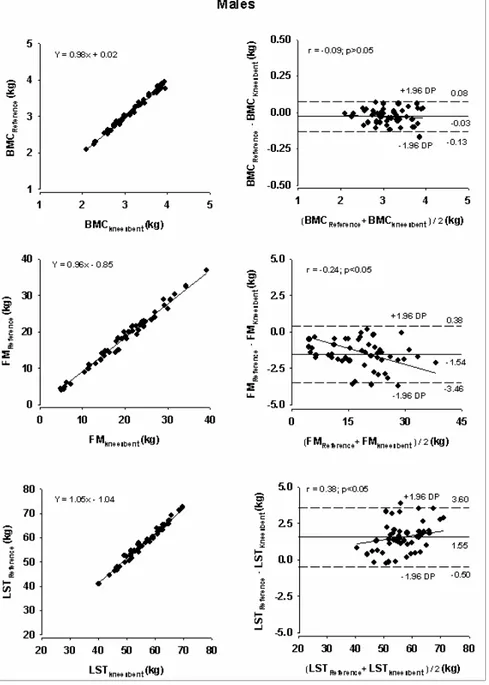
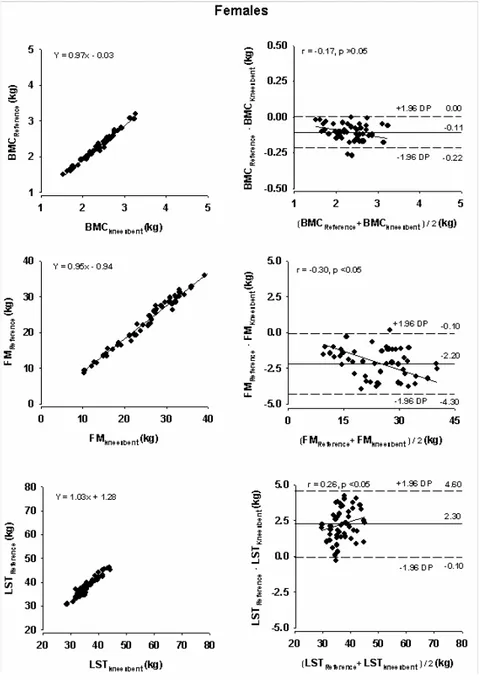
The performance of BMCKneesBent using the standard position as the reference method is indicated in Table 7.3. BMC analyzed with the knees bent overestimated BMC from the reference position by 30 g and 110 g, for males and females respectively. Linear regression analysis shows that BMCKneesBent explained 99% and 98% of the variance in BMC, respectively for males and females, with an estimated error of 50 g. The regression between BMCKneesBent and the reference position did not differ from the line of identity in both genders. In an individual basis, the differences between the reference BMC and BMCKneesBent ranged from -130 g to 80 g in males and from -220 g to 0 g in females. In addition, no trend was found between the difference of the methods and the mean of both methods (p>0.05).
FM reference position vs. FM knees bentposition
analysis shows that FMKneesBent explained 99% and 98% of the variance in FM, respectively for males and females, with an estimated error of 0.94 kg for males and 1.02 kg for females. The regression between FMKneesBent and the reference position differed from the line of identity in both genders (p<0.05). In an individual basis, the differences between the reference FM and FMKneesBent ranged from -3.46 kg to 0.38 kg in females and from -4.30 kg to -0.10 kg in males. A negative trend was found between the difference of the methods and the mean of both methods in males and females (p <0.05), which means that FMKneesBent tends to underestimate FM in the leaner subjects and to overestimate in the fatter subjects.
LST reference position vs. LST knees bent position
For males and females, LST in the reference position was higher than LST performed with the knees bent by 1.55 kg and 2.30 kg, respectively. Linear regression analysis shows that LSTKneesBent explained 98% and 91% of the variance in LST, respectively for males and females, with an estimated error of 1.01 kg for males and 1.19 kg for females. The regression between LSTKneesBent and the reference position differed from the line of identity in males (p<0.05) but not in females (p>0.05). On an individual basis, the differences between the reference LST and LSTKneesBent ranged from –0.50 kg to 3.60 kg in males and from -0.10 kg to 4.60 kg in females. A positive trend was found between the difference of the methods and the mean of both methods in males and females (p<0.05), indicating that LSTKneesBent is related with the amount of LST. Figures 7.2 and 7.3 depict regression of BMC, FM and LST using the reference method and with knees bent in males and females, respectively. Bland-Altman analyses are also described.
p<0.001, respectively) while no association with age was found for the BMC difference (r=0.15, p=0.136).
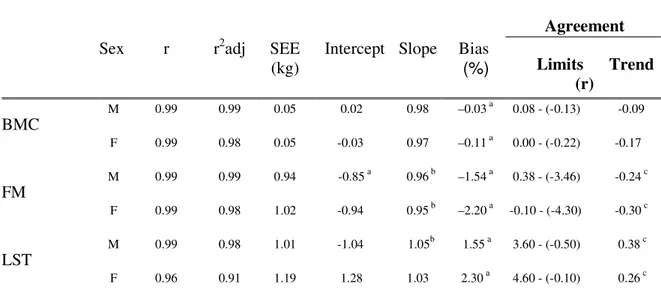
Table 7.3. Performance of DXA measurements using the knees bent validated using the standard position as the reference method
Abbreviations: r, correlation coefficient; r2adj, coefficient of determination (adjusted); SEE, standard error of estimation; PE, pure error; Trend(r), Correlation between the differences of the methods and the mean of both methods; FM, fat mass; M, male; F, female.
a
Significantly different from 0 (p <0.05); b Significantly different from 1 (p <0.05); c Significant correlation between the differences of the methods and the mean of both methods (p <0.05)
Sex r r2adj SEE (kg)
Intercept Slope Bias (%)
Agreement
Limits Trend (r)
BMC
M 0.99 0.99 0.05 0.02 0.98 –0.03 a 0.08 - (-0.13) -0.09
F 0.99 0.98 0.05 -0.03 0.97 –0.11 a 0.00 - (-0.22) -0.17
FM
M 0.99 0.99 0.94 -0.85 a 0.96 b –1.54 a 0.38 - (-3.46) -0.24 c
F 0.99 0.98 1.02 -0.94 0.95 b –2.20 a -0.10 - (-4.30) -0.30 c
LST
M 0.99 0.98 1.01 -1.04 1.05b 1.55 a 3.60 - (-0.50) 0.38 c
Figure 7.3. Regression of BMC, FM, and LST estimation using the reference method (standard position) and BMC, FM, and LST using the knees bent (left panels) and Bland-Altman analysis (right panels), for females. The solid line represents the mean differences between the reference position and the knees bent whole-body measurements and the dashed lines represent (±1.96 SD) confidence intervals (right panels)
p<0.001, respectively) while no association with age was found for the BMC difference (r=0.15, p=0.136).
Model Development
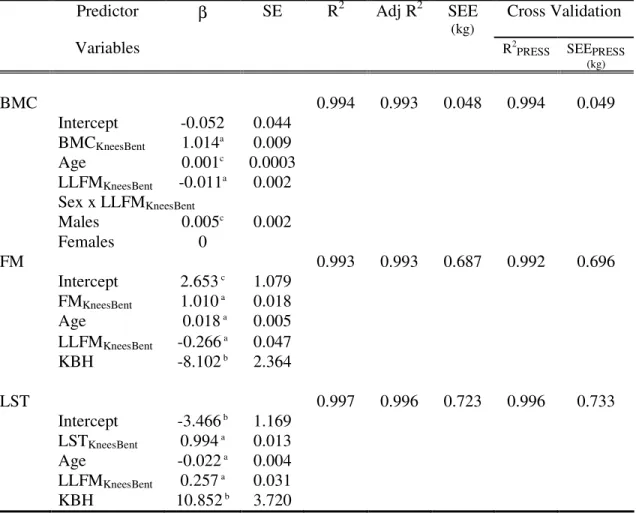
New models were developed for BMC, FM and LST, as described in Table 7.4. The entire sample was used to develop the calibration models. The significant predictors of BMC were BMCKneesBent (β=1.014, p<0.001), age (β=0.001, p=0.019), lower limbs fat mass (LLFM) (β=-0.011, p<0.001), and LLFM x sex interaction (β=0.005, p=0.018). For FM, the significant predictors variables were FMKneesBent (β=1.010, p<0.001), age (β=0.018, p<0.001), LLFM (β=-0.266, p<0.001), and the knees bent height (KBH) (β =-8.102, p=0.001). Finally, LST was explained by the variables LSTKneesBent (β=0.994, p<0.001), LLFM (β=0.257, p<0.001), age (β=-0.022, p<0.001), and KBH (β=10.852, p=0.005).
Table 7.4. Calibration models for BMC, FM, and LST.
Predictor β SE R2 Adj R2 SEE
(kg)
Cross Validation
Variables R2PRESS SEEPRESS
(kg)
BMC 0.994 0.993 0.048 0.994 0.049
Intercept -0.052 0.044 BMCKneesBent 1.014a 0.009
Age 0.001c 0.0003
LLFMKneesBent -0.011a 0.002 Sex x LLFMKneesBent
Males 0.005c 0.002
Females 0
FM 0.993 0.993 0.687 0.992 0.696
Intercept 2.653 c 1.079
FMKneesBent 1.010 a 0.018
Age 0.018 a
0.005 LLFMKneesBent -0.266 a 0.047
KBH -8.102 b 2.364
LST 0.997 0.996 0.723 0.996 0.733
Intercept -3.466 b 1.169
LSTKneesBent 0.994 a 0.013
Age -0.022 a 0.004
LLFMKneesBent 0.257 a 0.031
KBH 10.852 b 3.720
Abbreviations: β, beta (regression coefficient), SE, standard error; R2, coefficient of determination; Adj R2, adjusted coefficient of determination; SEE, standard error of measurement; R2PRESS, coefficient of determination using the
PRESS method, SEEPRESS(kg), standard error of measurement using the PRESS method; LLFMKneesBent, lower limb
fat mass (kg) with the knees bent; Sex x LLFMKneesBent, interaction between sex and the variable lower limb fat mass
(kg) with the knees bent; KBH, knees bent height (m).
a
p < 0.001, b p < 0.01, c p < 0.05.
DISCUSSION
To our knowledge this is the first study that addresses this methodological DXA limitation by developing models to apply in the evaluation of taller subjects. In our sample, using the knees bent, BMC and FM were overestimated by ~2.6% and ~9.2%, respectively, while LST was underestimated by ~4.0%.
For both males and females, better performance was found for BMC as
basis, showed by the unbiased agreement between the methods. Even so, an individual estimation error of ~11% was found for BMC and LST and ~23% for FM when the knees bent position is adopted in relation to the total mean values obtained in the reference position for each compartment.
Effect of age and sex
New models were developed for BMC, FM and LST (Table 7.4). In general, age and LLFM explained part of the variance of the soft tissue (FM and LST) from the reference position. According to our developed models, a greater age was associated with a lower LST while a higher BMC, and especially a higher FM were related to a greater age. This results support early investigations that referred an increase in adipose tissue and LST atrophy with greater age (22,31).
A greater LLFM was associated with a higher LST while a lower BMC and FM were related to greater LLFM. An interaction between sex and LLFM showed a significant association with BMC observed values in the reference position. This interaction could explain that the relationship between lower limbs fat mass and BMC is dependent on gender.
Effect of the knees bent position
vertically as the distance between the scan table and the top of the knees in the bent position. A positive association was found between this distance and height (r=0.79, p<0.001).
DXA soft tissue variability
Originally DXA was conceptualized to assess bone mineral density and was subsequently adopted for the assessment of FM and LST. The current findings point out that even with knees bent, BMC shows a better accuracy than FM and LST. According to Roubenoff et al. (24), this variability in soft tissue composition is caused by the effects of hydration and tissue thickness, as well as limitations in distinguished between soft tissue and bone compartments in the DXA technique. A theoretical basis strongly supports the hypothesis that DXA fat estimation errors occur secondary to soft tissue hydration changes (13). Reports indicate that DXA makes no assumptions regarding tissue hydration, and previous research in humans indicates that acutely altering fluid balance or distribution has no measurable influence on DXA or related DXA fat estimates (1, 11, 25-29). However, earlier studies suggest that physical principles and models on which DXA relies may be influenced by tissue hydration (13, 30, 31). Cross-validation studies of DXA instruments at different clinical research centers revealed considerable intermachines differences in the estimation of both bone-mineral density and soft tissue composition (32-34), even among machines from the same manufacturer (14, 35). For instances, Black et al (36) illustrates the influence of scan velocity for obtaining the most accurate results.
subjects. Because of the high associations between values from the two sides, the authors recommended that in studies of subjects wider than the scan area, scans be made of the right half of the body and the total body composition is estimated assuming bilateral symmetry.
It is essential to point out that the three major manufacturers of DXA
instruments, (ie, Hologic, Lunar, and Norland), use different detection, calibration, and analysis techniques in their body composition assessments (37). Moreover, for each manufacturer, results may vary with the DXA instrument model, the mode of data collection (eg, pencil-beam vs. fan-beam), and the software used to analyze the data (15).
The technique presented in the current study is only applicable to the Hologic QDR-1500 system operating in pencil-beam mode, though several clinicians are using the same model densitometer for body composition measurements. Most modern
densitometers operate in fan-beam mode. With a fan of radiation, the apparent size of an object will be altered with height off the imaging table. Hence, as the knees are
elevated, the calculations of BMC, LST, and FM might be altered. In addition, different densitometers orientate the fan of radiation either longitudinally or transversely across the table, so results may be dependent of the fan-beam. However, according to
Pietrobelli et al (13), DXA machines are able to recognize air that is below the knees bent.
Model utility
bent position to perform DXA measurements compared to the standard position. Therefore, using these calibration models we are able to correct BMC, FM, and LST performed with the knees bent when individuals higher than the DXA scan table are evaluated. In certain subjects, namely athletes, the need to evaluate body composition in the daily clinical practice is critical, especially when we are following them longitudinally. Therefore, assessing body composition using the knees bent in athletes undergoing a specific weight management program may lead to adverse effects on health and performance. For example, a 20 year-old-female athlete with 1.95 cm, 80 kg, 20 kg of FMKneesBent, 8 kg ofLLFMKneesBent, with a KBH of 0.49 m, would have ~17 kg of FM using the corrected model. If the goal for this athlete is to reduce 5 kg of body weight, an overestimation of 3 kg of FM would lead to errors in the correct interpretation of body composition results and thus in the subsequent nutritional and training prescriptions for the weight management program.
Study Limitations
We have considered an alternative solution to the problem of tall people by performing two scans. The first scan covering the head to lower torso and the second scan covering the lower torso to legs. However, to initialize the whole-body scan, the DXA system requires that the first line is air which does not enable us to perform the second scan unless an uncomfortable and strenuous position is adopted.
In addition, our empirical calibration models were developed in a cross-sectional cohort. It would be useful to establish the validity of the models in longitudinally monitored populations.
CONCLUSION
The findings of this study indicate that performing body composition
REFERENCES
1. Pietrobelli, A., Formica, C., Wang, Z. & Heymsfield, S. B. (1996) Dual-energy X-ray absorptiometry body composition model: review of physical concepts, Am J Physiol, 271, E941-51.
2. Wang, Z. M., Deurenberg, P., Guo, S. S. et al. (1998) Six-compartment body composition model: inter-method comparisons of total body fat measurement,
Int J Obes Relat Metab Disord, 22, 329-37.
3. Brozek, J., Grande, F. & Anderson, J. T. (1963) Densitometry analysis of body composition: Revision of some quantitative assumptions., Ann N Y Acad Sci, 110, 113-140.
4. Siri, W. E. (1961) Body composition from fluid spaces and density: Analysis of method, in: Henschel, I. J. B. A. (Ed.) Techniques for measuring body
composition, pp. 223-244. Washington, D.C., National Academy of Sciences, National Research Council.
5. Withers, R. T., Laforgia, J., Heymsfield, S. B., Wang, Z. & Pillans, R. K. (1996) Two, three and four-compartment chemical models of body composition
analysis, in: In K, N. T., Olds (Ed.) Antropometrica, pp. 199-231. Australia: UNSW Press.
6. Fuller, N. J., Jebb, S. A., Laskey, M. A., Coward, W. A. & Elia, M. (1992) Four-component model for the assessment of body composition in humans:
comparison with alternative methods, and evaluation of the density and hydration of fat-free mass, Clin Sci (Colch), 82, 687-93.
8. Jebb, S. A., Goldberg, G. R. & Elia, M. (1993) DXA measurements of fat and bone mineral density in relation to depth and adiposity, Basic Life Sci, 60, 115-9. 9. Jebb, S. A., Goldberg, G. R., Jennings, G. & Elia, M. (1995) Dual-energy x-ray
absorptiometry measurements of body composition: Effects of depth and tissue thickness, including comparisons with direct analysis, Clin Sci, 88, 319-324. 10. Laskey, M. A. (1996) Dual-energy X-ray absorptiometry and body composition,
Nutrition, 12, 45-51.
11. Milliken, L. A., Going, S. B. & Lohman, T. G. (1996) Effects of variations in regional composition on soft tissue measurements by dual-energy X-ray absorptiometry, Int J Obes Relat Metab Disord, 20, 677-82.
12. Pietrobelli, A., Gallagher, D., Baumgartner, R., Ross, R. & Heymsfield, S. B. (1998) Lean R value for DXA two-component soft-tissue model: influence of age and tissue or organ type, Appl Radiat Isot, 49, 743-4.
13. Pietrobelli, A., Wang, Z., Formica, C. & Heymsfield, S. B. (1998) Dual-energy X-ray absorptiometry: fat estimation errors due to variation in soft tissue hydration, Am J Physiol, 274, E808-16.
14. Tataranni, P. A. & Ravussin, E. (1995) Use of dual-energy X-ray absorptiometry in obese individuals, Am J Clin Nutr, 62, 730-4.
15. Lohman, T. G. (1996) Dual Energy X-Ray Absorptiometry, in: Roche AF, H. S., and Lohman, TG, eds (Ed.) Human Body Composition, pp. 63-78. Champaign, IL, Human Kinetics.
16. Lohman, T. G., Roche, A. F. & Martorell, R. (1988) Anthropometric
17. Ross, W. D. (1978) Kinanthropometry terminology and landmarks, in: Shepard RJ and Lavallee, H., eds (Ed.) Physical Fitness Assessment, pp. 44-50.
Springfield, IL, Charles C Thomas.
18. Bland, J. M. & Altman, D. G. (1986) Statistical methods for assessing agreement between two methods of clinical measurement, Lancet, 1, 307-10.
19. Myers, R. H. (1986) Classical and modern regression with applications. Boston, Duxbury press.
20. Holiday, D. B., Ballard, J. E. & McKeown, B. C. (1995) PRESS-related statistics: regression tools for cross-validation and case diagnostics, Med Sci Sports Exerc, 27, 612-20.
21. Guo, S. S. & Chumlea, W. C. (1996) Statistical methods for the development and testing of predictive equations, in: Roche, A. F., Heymsfield, S. B. & Lohman, T. G. (Eds.) Human body composition, pp. 191-202. Champaign, IL, Human Kinetics Publishers.
22. Heymsfield, S. B., Gallagher, D., Kotler, D. P. et al. (2002) Body-size dependence of resting energy expenditure can be attributed to nonenergetic homogeneity of fat-free mass, Am J Physiol, 282, E132-8.
23. Roubenoff, R. & Wilson, P. W. (1993) Advantage of knee height over height as an index of stature in expression of body composition in adults, Am J Clin Nutr, 57, 609-13.
24. Roubenoff, R., Kehayias, J. J., Dawson-Hughes, B. & Heymsfield, S. B. (1993) Use of dual-energy x-ray absorptiometry in body-composition studies: not yet a "gold standard", Am J Clin Nutr, 58, 589-91.
bioelectrical impedance measurements, and anthropometry, Am J Clin Nutr, 63, 80-6.
26. Formica, C., Atkinson, M. G., Nyulasi, I. et al. (1993) Body composition following hemodialysis: studies using dual-energy X-ray absorptiometry and bioelectrical impedance analysis, Osteoporos Int, 3, 192-7.
27. Lands, L. C., Heigenhauser, G. J., Gordon, C., Jones, N. L. & Webber, C. E. (1991) Accuracy of measurements of small changes in soft tissue mass by use of dual-photon absorptiometry, J Appl Physiol, 71, 698-702.
28. Lands, L. C., Hornby, L., Hohenkerk, J. M. & Glorieux, F. H. (1996) Accuracy of measurements of small changes in soft-tissue mass by dual-energy x-ray absorptiometry, Clin Invest Med, 19, 279-85.
29. Going, S. B., Massett, M. P., Hall, M. C. et al. (1993) Detection of small changes in body composition by dual-energy x-ray absorptiometry, Am J Clin Nutr, 57, 845-50.
30. Horber, F. F., Thomi, F., Casez, J. P., Fonteille, J. & Jaeger, P. (1992) Impact of hydration status on body composition as measured by dual energy X-ray
absorptiometry in normal volunteers and patients on haemodialysis, Br J Radiol, 65, 895-900.
31. St-Onge, M. P., Wang, Z., Horlick, M., Wang, J. & Heymsfield, S. B. (2004) Dual-Energy X-Ray Absorptiometry Lean Soft Tissue Hydration: Independent Contributions of Intra- and Extracellular Water, Am J Physiol Endocrinol Metab. 287(5): E842–7.
33. Tothill, P., Laskey, M. A., Orphanidou, C. I. & van Wijk, M. (1999) Anomalies in dual energy X-ray absorptiometry measurements of total-body bone mineral during weight change using Lunar, Hologic and Norland instruments, Br J Radiol, 72, 661-9.
34. Economos, C. D., Nelson, M. E., Fiatarone, M. A. et al. (1997) A multi-center comparison of dual energy X-ray absorptiometers: in vivo and in vitro soft tissue measurement, Eur J Clin Nutr, 51, 312-7.
35. Paton, N. I., Macallan, D. C., Jebb, S. A., Pazianas, M. & Griffin, G. E. (1995) Dual-energy X-ray absorptiometry results differ between machines, Lancet, 346, 899-900.
36. Black, E., Petersen, L., Kreutzer, M. et al. (2002) Fat mass measured by DXA varies with scan velocity, Obes Res, 10, 69-77.