www.atmos-chem-phys.net/14/7953/2014/ doi:10.5194/acp-14-7953-2014
© Author(s) 2014. CC Attribution 3.0 License.
Modelling non-equilibrium secondary organic aerosol formation
and evaporation with the aerosol dynamics, gas- and particle-phase
chemistry kinetic multilayer model ADCHAM
P. Roldin1,3, A. C. Eriksson1, E. Z. Nordin2, E. Hermansson1, D. Mogensen3, A. Rusanen3, M. Boy3, E. Swietlicki1, B. Svenningsson1, A. Zelenyuk4, and J. Pagels2
1Division of Nuclear Physics, Lund University, P.O. Box 118, 221 00 Lund, Sweden
2Ergonomics and Aerosol Technology, Lund University, P.O. Box 118, 221 00 Lund, Sweden 3Department of Physics, P.O. Box 48, University of Helsinki, 00014 Helsinki, Finland
4Pacific Northwest National Laboratory, P.O. Box 999, MSIN K8-88, Richland, WA 99354, USA
Correspondence to:P. Roldin ([email protected])
Received: 13 December 2013 – Published in Atmos. Chem. Phys. Discuss.: 10 January 2014 Revised: 27 May 2014 – Accepted: 11 June 2014 – Published: 11 August 2014
Abstract. We have developed the novel Aerosol Dynam-ics, gas- and particle-phase chemistry model for laboratory CHAMber studies (ADCHAM). The model combines the detailed gas-phase Master Chemical Mechanism version 3.2 (MCMv3.2), an aerosol dynamics and particle-phase chem-istry module (which considers acid-catalysed oligomeriza-tion, heterogeneous oxidation reactions in the particle phase and non-ideal interactions between organic compounds, wa-ter and inorganic ions) and a kinetic multilayer module for diffusion-limited transport of compounds between the gas phase, particle surface and particle bulk phase. In this arti-cle we describe and use ADCHAM to study (1) the evap-oration of liquid dioctyl phthalate (DOP) particles, (2) the slow and almost particle-size-independent evaporation ofα
-pinene ozonolysis secondary organic aerosol (SOA) parti-cles, (3) the mass-transfer-limited uptake of ammonia (NH3)
and formation of organic salts between ammonium (NH+ 4)
and carboxylic acids (RCOOH), and (4) the influence of chamber wall effects on the observed SOA formation in smog chambers.
ADCHAM is able to capture the observedα-pinene SOA
mass increase in the presence of NH3(g). Organic salts of
ammonium and carboxylic acids predominantly form during the early stage of SOA formation. In the smog chamber ex-periments, these salts contribute substantially to the initial growth of the homogeneously nucleated particles.
The model simulations of evaporatingα-pinene SOA
ticles support the recent experimental findings that these
par-ticles have a semi-solid tar-like amorphous-phase state. AD-CHAM is able to reproduce the main features of the ob-served slow evaporation rates if the concentration of low-volatility and viscous oligomerized SOA material at the par-ticle surface increases upon evaporation. The evaporation rate is mainly governed by the reversible decomposition of oligomers back to monomers.
Finally, we demonstrate that the mass-transfer-limited up-take of condensable organic compounds onto wall-deposited particles or directly onto the Teflon chamber walls of smog chambers can have a profound influence on the observed SOA formation. During the early stage of the SOA forma-tion the wall-deposited particles and walls themselves serve as an SOA sink from the air to the walls. However, at the end of smog chamber experiments the semi-volatile SOA mate-rial may start to evaporate from the chamber walls.
1 Introduction
Aerosol particles in the atmosphere have substantial impact on the global climate, air quality, and public health. Mea-surements around the world have demonstrated that a large fraction of the submicron aerosol particles are composed of organic compounds (Jimenez et al., 2009). To date, many important biogenic and anthropogenic secondary organic aerosol (SOA) precursors have been identified. However, the scientific knowledge about the SOA formation mechanisms, the SOA composition and properties is still very uncertain (Kroll and Seinfeld, 2008; Hallquist et al., 2009).
Traditionally, the important SOA formation mechanisms are modelled as pure gas-phase oxidation processes fol-lowed by equilibrium partitioning between the gas and a liq-uid organic particle phase (e.g. Pankow, 1994; Donahue et al., 2011). However, during the last ∼10 years, other
pro-cesses occurring in the particle phase have also been iden-tified as important mechanisms for the formation and prop-erties of SOA. These include acid-catalysed oligomerization (e.g. Gao et al., 2004; Iinuma et al., 2004; Kalberer et al., 2004; Tolocka et al., 2004), heterogeneous oxidation reac-tions (e.g. Knopf et al., 2005; Nash et al., 2006; Rudich et al., 2007; Maksymiuk et al., 2009), organic salt formation (e.g. Na et al., 2007; Smith et al., 2010; Kuwata and Mar-tin, 2012; Yli-Juuti et al., 2013), organosulfate formation (e.g. Liggio and Li, 2006; Surratt et al., 2007) and salting-out effects (e.g. Smith et al., 2011; Bertram et al., 2011). The term salting-out refers to the process in which interactions with dissolved ions (generally inorganic) drive nonpolar or-ganic compounds out of the mixed phase, either into a differ-ent organic-rich (liquid) phase or out to the gas phase (Zuend et al., 2011).
Several independent laboratory experiments have also shown that secondary organic aerosol particles can form a solid or semi-solid amorphous phase (e.g. Virtanen et al., 2010; Vaden et al., 2010; Vaden et al., 2011; Kuwata and Martin, 2012; Zelenyuk et al., 2012; Abramson et al., 2013; Zhou et al., 2013), at least for relative humidities (RH) below 65 % (Saukko et al., 2012). Recently, Abramson et al. (2013) measured the evaporation rates of pyrene that was imbed-ded inside SOA particles formed fromα-pinene ozonolysis
in the presence of pyrene vapour, based on which the authors estimated a diffusion coefficient of 2.5×10⁻¹⁷cm2s−1for
pyrene in the fresh SOA under dry conditions. For particles aged for∼24 h the diffusivity was an additional ∼3 times
slower. Using the Stokes–Einstein relation for the binary dif-fusion coefficients gives an SOA viscosity of∼108Pa s for
fresh SOA and ∼3×10⁸Pa s for the aged particles. These
high viscosity values are typical for tar- or pitch-like sub-stances (Koop et al., 2011). For a particle with a diameter of 100 nm, this gives a characteristic time of mass trans-port (e-folding time of equilibration) of ∼28 h for fresh
SOA and ∼84 h for the aged SOA particles (Seinfeld and
Pandis, 2006). A similar study was performed by Zhou et
al. (2013), who observed mass-transport-limited degradation of benzo[a]pyrene (BaP) with ozone when coated withα
-pinene SOA. Based on kinetic double-layer model simula-tions the authors estimate that the BaP diffusion coefficients (in cm2s−1) are 2×10⁻¹⁴, 8×10⁻¹⁴ and>10−12 for dry
(RH<5 %), 50 % RH and 70 % RH, respectively. The
es-timated diffusion coefficient of BaP inα-pinene SOA
(un-der dry conditions) from Zhou et al. (2013) is∼3 orders of
magnitude larger than the diffusion coefficient of pyrene es-timated by Abramson et al. (2013). One reason for this could be that theα-pinene SOA in Zhou et al. (2013) is very fresh
(∼1 min), while in Abramson et al. (2013) the SOA particles
are aged for at least 1 h, thus having time to form a substantial fraction of viscous oligomers.
If a viscous phase is formed, the mixing within the cle bulk will be kinetically limited and the gas–particle parti-tioning cannot be well represented by an equilibrium process (Pöschl, 2011; Shiraiwa and Seinfeld, 2012), which the tradi-tional partitioning theory assumes (Pankow, 1994). This may not be evident from pure SOA mass formation experiments where the condensable organic compounds are continuously formed by gas-phase oxidation of different precursor com-pounds (see e.g. Odum et al., 1996; Hoffmann et al., 1997; Griffin et al., 1999; Ng et al., 2007; Pathak et al., 2007). How-ever, in the atmosphere the aerosol particles are present with a broad size range and are exposed to more variable concen-tration, temperature and humidity conditions. Hence, atmo-spheric aerosol particles will never be entirely in equilibrium with the gas phase. Dzepina et al. (2009) showed that their equilibrium partitioning model substantially overestimate the evaporation of SOA in the Mexico City metropolitan area.
In well-controlled laboratory experiments, Grieshop et al. (2007) and Vaden et al. (2011) illustrated that the evap-oration of SOA particles formed from α-pinene
ozonoly-sis is a slow process (hours to days). Vaden et al. (2011) showed that this is orders of magnitude slower than expected from the seven-product volatility basis set (VBS) parame-terization from Pathak et al., 2007. This parameparame-terization is based on a large number of smog chamber experiments ofα-pinene ozonolysis, which resemble the experiments by
Vaden et al. (2011). This VBS parameterization lacks sub-stantial fraction of low-volatility material. The slow evapo-ration of SOA can be due to the presence of low-volatility oligomers in combination with mass transfer limitations and mixing effects (Grieshop et al., 2007; Vaden et al., 2011). Saleh et al. (2013) did not observe a strong evaporation in-hibition because of diffusion limitations in the particle phase ofα-pinene SOA particles. However, in Saleh et al. (2013)
only ∼20 % of the SOA particle mass (corresponding to
Vaden et al. (2011) illustrated that the evaporation of am-bient SOA particles is even slower than for the pureα-pinene
SOA and better resembles the evaporation of agedα-pinene
SOA particles in the presence of different hydrophobic or-ganic compounds. If the ambient SOA particles studied by Vaden et al. (2011) are representative of typical atmospheric SOA particles, then the evaporation due to dilution in the at-mosphere (e.g. in urban plumes downwind from the source) will be almost negligible. This can increase the lifetime and concentrations of SOA (and, for example, NH4NO3) in the
atmosphere (Vaden et al., 2011).
For the past decade, large discrepancies between field-measured and model-predicted SOA loadings have stimu-lated intense research that was mostly focused on the search for additional SOA precursors. However, these models have all treated SOA assuming it to be a semi-volatile equili-brated solution. A recent study (Shrivastava et al., 2013) has shown that it is possible to improve agreement between mea-sured and modelled SOA loadings by treating SOA, in accord with experimental data as a non-volatile semi-solid. Simi-larly, considering the highly viscous, non-volatile nature of SOA offers a simple explanation for the observed long-range transport of persistent organic pollutants by atmospheric par-ticles (Zelenyuk et al., 2012).
A number of model studies have been performed to ex-plore detailed gas-phase reaction mechanisms which can be responsible for the SOA formation of known biogenic and anthropogenic SOA precursors (e.g. Bloss et al., 2005a, b; Johnson et al., 2005, 2006; Li et al., 2007; Hu et al., 2007; Metzger et al., 2008; Rickard et al., 2010; Camredon et al., 2010; Valorso et al., 2011). However, relatively few attempts have been made to perform detailed process-based modelling on the influence of phase state (Shiraiwa et al., 2010, 2011, 2012; Pfrang et al., 2011), oligomerization (Vesterinen et al. 2007; Pun and Seigneur, 2007; Li et al., 2007; Hu et al., 2007; Ervens and Volkamer, 2010), heterogeneous oxida-tion mechanisms (Shiraiwa et al., 2010; 2011, 2012; Pfrang et al., 2011), organic–inorganic interactions (e.g. salting-out effects, acidity effects) (Zuend et al., 2010; Zuend and Sein-feld, 2012), organic salt formation (Barsanti et al., 2009), and non-equilibrium gas–particle partitioning and aerosol dy-namics (e.g. Korhonen, et al., 2004; Vesterinen et al., 2007; Boy et al., 2006; Roldin et al., 2011a, b) on the SOA forma-tion and properties, and to our knowledge no one has previ-ously included all these processes in the same model.
In this article we describe and apply the newly developed Aerosol Dynamics, gas- and particle-phase chemistry model for laboratory CHAMber studies (ADCHAM). As the name implies the model is primarily aimed to be used as a flexi-ble tool for evaluation and design of controlled experiments in smog chambers (e.g. Nordin et al., 2013), thermodenuders (e.g. Riipinen et al., 2010), evaporation chambers (e.g. Vaden et al., 2011), flow-tube reactors (e.g. Jonsson et al., 2008) or hygroscopicity measurements set-ups (e.g. Svenningsson et al., 2006). However, the overall aim is to gain a better
un-derstanding of which processes (e.g. gas-phase chemistry, particle-phase reactions, particle-phase state, aerosol water uptake, cloud droplet activation, and aerosol dynamics) are relevant for the aerosol properties and formation in the atmo-sphere.
In ADCHAM the secondary aerosol formation is mod-elled by combining the Master Chemical Mechanism ver-sion 3.2 (MCMv3.2) (Jenkin et al., 1997, 2003; Saunders et al., 2003) and an updated version of the aerosol dynamics and particle-phase chemistry module from ADCHEM (2-D-Lagrangian model for Aerosol Dynamics, gas-phase CHEM-istry and radiative transfer) (Roldin et al., 2011a), which now considers acid-catalysed oligomerization; oxidation re-actions in the particle phase (e.g. secondary ozonide forma-tion); and the diffusion-limited transport of compounds be-tween the gas phase, particle surface and particle bulk phase. In this work we test the capability of ADCHAM to simulate (1) the particle-size-dependent mass evaporation loss rates of liquid dioctyl phthalate (DOP) particles, (2) the slow and al-most particle-size-independent evaporation ofα-pinene SOA
particles (Vaden et al., 2011), (3) the mass-transfer-limited uptake of NH3 and formation of organic salts between
am-monium and carboxylic acids (Na et al., 2007; Kuwata and Martin, 2012), and (4) the influence of heterogeneous reac-tions and chamber wall effects on the SOA formation and properties.
Regional- and global-scale chemistry transport models (e.g. the EMEP model (Bergström et al., 2012) rely on semi-empirical parameterizations for the SOA formation (e.g. VBS) derived from smog chamber experiments. This is one of many reasons why it is important to constrain the uncertainties related to specific chamber effects. Hence, as a final application, we illustrate how ADCHAM can be used to study the influence of chamber wall effects on the SOA mass formation, particle number size distribution and gas-phase chemistry during anm-xylene oxidation experiment
by Nordin et al. (2013).
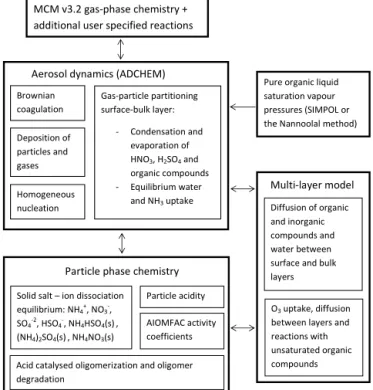
2 Model description ADCHAM consists of
1. a detailed gas-phase kinetic code (in this work with re-actions from MCMv3.2);
2. an aerosol dynamics code (Roldin et al., 2011a) which includes Brownian coagulation, homogeneous nucle-ation, deposition to chamber walls and a detailed con-densation/evaporation algorithm;
4. and a kinetic multilayer model which treats the diffusion of compounds between the particle surface and several bulk layers, analogous to Shiraiwa et al. (2012). Figure 1 shows a schematic picture of the ADCHAM model structure. The model explicitly treats the bulk diffusion of all compounds (including oxidation agents (Zox) such as
OH, O3and NO2) between different particle layers and bulk
reactions. For all compounds except Zox, the gas–surface
partitioning is by default modelled as an absorption (disso-lution) process with the condensation/evaporation equation (Eq. 1, Jacobson, 2005a). Equation (1) considers the gas-surface diffusion limitations and potentially non-unity prob-ability of adsorption (sticking) and dissolution into the par-ticle surface-bulk layer (surface-bulk accommodation). The surface-bulk layer we define as the monolayer thick parti-cle surface layer where the condensing compounds dissolve (absorb). In each particle layer the model considers acid-catalysed oligomerization, equilibrium reactions between in-organic and in-organic salts and their dissolved ions, and het-erogeneous oxidation of SOA.
In ADCHAM the different processes are solved with separate modules using operator splitting. For each main model time step (in this work 10 s), ADCHAM considers ho-mogeneous nucleation, followed by deposition of particles (Sect. 2.2.3) and potentially gases, emissions of gases and particles, gas-phase chemistry (Sect. 2.1) and coagulation (Sect. 2.2.2). After this ADCHAM handles the condensa-tion and evaporacondensa-tion of all organic and inorganic compounds (Sect. 2.2.1) and the reversible adsorption, diffusion and re-actions of Zox in the different particle layers (Sect. 2.4.2).
In between these processes ADCHAM uses operator split-ting with a much shorter time step (in this work 1–10 ms). For the reversible adsorption, diffusion and reactions of the different oxidation agents in the particle phase, a kinetic multilayer model (Sect. 2.4.2) is used. This model consists of a coupled ordinary differential equation system which is solved using the MATLAB ode15s solver with adaptive and error-tolerance-controlled internal time steps. The gas– particle partitioning relies upon updated activity coefficients (Sect. 2.3.1), hydrogen ion concentrations (Sect. 2.3.2), wa-ter content, concentrations of inorganic and organic salts (Sect. 2.3.3) and their corresponding anion and cations. Therefore, the gas–particle partitioning is usually the most time demanding process in ADCHAM. Finally, the model considers the diffusion of organic and inorganic compounds between all particle layers (Sect. 2.4.1) and acid-catalysed oligomerization (Sect. 2.3.4).
MCM v3.2 gas-phase chemistry + additional user specified reactions
Pure organic liquid saturation vapour pressures (SIMPOL or the Nannoolal method)
Aerosol dynamics (ADCHEM)
Gas-particle partitioning surface-bulk layer:
- Condensation and evaporation of HNO3, H2SO4 and organic compounds - Equilibrium water
and NH3 uptake Brownian
coagulation
Deposition of particles and gases
Homogeneous nucleation
Particle phase chemistry
Acid catalysed oligomerization and oligomer degradation
AIOMFAC activity coefficients Particle acidity Solid salt – ion dissociation
equilibrium: NH4+, NO3-, SO4-2, HSO4-, NH4HSO4(s), (NH4)2SO4(s), NH4NO3(s)
Diffusion of organic and inorganic compounds and water between surface and bulk layers
O3 uptake, diffusion between layers and reactions with unsaturated organic compounds
Multi-layer model
Figure 1.Schematic picture of the ADCHAM model structure.
2.1 Gas-phase chemistry
To be able to implement the detailed MCMv3.2 gas-phase chemistry together with user-specified reactions and reaction rates (e.g. chamber wall effects) in a computationally effi-cient way in MATLAB, we constructed a program which automatically creates a system of equations which can be used to calculate the concentrations of the user-specified compounds. The only required input to the program is the MCMv3.2 names of the compounds, which can be down-loaded at http://mcm.leeds.ac.uk/MCM. The output from the program is a set of coupled ordinary differential equations (one for each compound) and the Jacobian matrix, which is used by the ode15s solver in MATLAB. The constructed code can either be used as a standalone code for separate gas-phase chemistry simulations or used as a module in the AD-CHEM or ADCHAM model. The ode15s solver in MATLAB is intended to be used for stiff ordinary differential equation systems. The solver uses an adaptive and error-tolerance-controlled internal time step in order to solve the gas-phase chemistry.
In Sects. 3.2 and 3.3 we simulate the SOA formation from ozonolysis ofα-pinene in the presence of CO or cyclohexane
as an OH scavenger. We constructed an equation system con-sisting of all MCMv3.2 reactions involving inorganic gas-phase chemistry and all oxidation products ofα-pinene and
m-xylene with the MCMv3.2 gas-phase chemistry (273
com-pounds and 878 reactions). 2.2 Aerosol dynamics
The aerosol dynamics module in ADCHAM is based on the aerosol dynamics code from the ADCHEM model (Roldin et al., 2011a). A shorter description with focus on the important updates is given below.
2.2.1 Condensation and evaporation
In ADCHAM the gas–particle partitioning depends on the chemical composition in the particle surface-bulk layer. Analogous to Jacobson (2005b) the dissolution of ammo-nia into the particle surface-bulk layer water- and/or organic phase is treated as an equilibrium process, considered af-ter the diffusion-limited condensation/evaporation of HNO3,
H2SO4and organic compounds (Eq. 1, Seinfeld and Pandis,
2006) (of which carboxylic acids influence the particle acid-ity and hence the ammonia dissolution).
Ii=2DiDpfi Kni, αs,i Ci,∞−Ci,s, (1) fi Kni, αs,i=
0.75αs,i(1−Kni)
Kn2i +Kni+0.283Kniαs,i+0.75αs,i
In Eq. (1)Ii is the contributions of speciesi to the particle
molar growth rates,fiis the Fuchs–Sutugin correction factor
in the transition region,Ci,∞is the gas-phase concentration
of speciesifar from the particle surface (mol m−3air),Ci,s
is the saturation gas-phase concentration at the particle sur-face (mol m−3air),D
i is the gas-phase diffusion coefficient
(m2s−1), D
p is the particle diameter (m), Kni is the
non-dimensional Knudsen number andαs,iis the surface-bulk
ac-commodation coefficient.
In this work we estimate the pure-liquid saturation vapour pressures (p0) of the MCMv3.2 oxidation products using
ei-ther the group contribution method SIMPOL (Pankow and Asher, 2008) or the method by Nannoolal et al. (2008) (here referred to as the Nannoolal method). The corresponding equilibrium vapour pressures (ps,i,j) for each particle size
bin (j )are derived with Raoult’s law, using the mole
frac-tions of each organic compound (xi,j), the activity
coeffi-cients (γi,j) calculated with the AIOMFAC thermodynamic
model (Zuend et al., 2008, 2011) (Sect. 2.3.1), and the Kelvin effect (Cki,j) (Eq. 2). The surface tension (σi) of the organic compounds was assumed to be 0.05 N m−1following
Riip-inen et al. (2010).
ps,i,j=p0,ixi,jγi,jCki,j, Cki,j =e
4Mi σi RT ρpD
p,j
(2)
T is the temperature in kelvin,Ris the universal gas constant
(J mol−1K−1),M
i is the molar mass of compoundiandρp
is the density of the phase which the compound partitions to.
The mole fraction for compound i in Eq. (2) is the
mole fraction of the organic compound in the surface-bulk layer organic phase which compound i partitions
into (dissolves). In this work we either treat all SOAs (monomers+dimers+organic salts) as one phase or as two
completely separate phases, with monomers as one phase and the dimers and organic salts as a second phase. This phase separation is not modelled explicitly (as in Zuend and Sein-feld, 2012). Instead we simply assume that either the phase separation does occur or it does not. In future model applica-tions, we intend to implement a simple approach to calculate liquid–liquid phase separation (e.g. Topping et al., 2013). If the described phase separation occurs, then the monomers will not dissolve in the phase made up of dimers and/or or-ganic salts. Thus, their saturation vapour pressures are not lowered by dimerization or organic salt formation, which re-sults in less SOA mass in the model compared to simulations without phase separation (Topping et al., 2013).
In this work the condensation and evaporation mechanism includes all organic compounds with modelled pure-liquid saturation vapour pressures less than 1 Pa. For theα-pinene
oxidation experiments which we model in Sects. 3.2 and 3.3, this involves 154 non-radical MCMv3.2 organic compounds, while for them-xylene SOA formation experiment modelled
in Sect. 3.4, we consider 112 condensable organic MCMv3.2 compounds.
2.2.2 Coagulation
ADCHAM also includes a Brownian coagulation algorithm (Roldin et al., 2011a). The particle mass and number concen-trations of the formed particles are split between the exist-ing particle size bins usexist-ing a fully stationary method. It still remains a challenge to combine the coagulation algorithm with the kinetic multilayer model when the number of par-ticle layers depends on the parpar-ticle size. In this first version of ADCHAM it is only possible to treat coagulation between particles composed of maximum three layers (e.g. a surface monolayer layer, a bulk layer and a seed aerosol core). When two particles composed of such a layer structure collide, the layers are simply assumed to merge together, forming a new spherical particle with a surface-bulk layer, a bulk layer and a seed aerosol core. Because the surface area of the formed particle is always less than the sum of the surface areas of the two original particles, the width of the surface-bulk layer in-creases. Hence, in order to keep the width of the surface-bulk layer at approximately the thickness of one monolayer, part of the surface-bulk layer material is transferred to the particle bulk.
2.2.3 Deposition and chamber wall effects
method (see e.g. Hildebrandt et al., 2009; Loza et al., 2012) is to scale the measured SOA mass with the measured rel-ative seed aerosol (typically ammonium sulfate) loss rate. With this method it is assumed that the particles deposited on the chamber walls continue to take up condensable gas-phase compounds as if they were still present in the gas phase. A second method which was also used by Hildebrandt et al. (2009) and Loza et al. (2012) is to assume that the gas– particle partitioning stops once the particles have deposited on the chamber walls. These two correction methods can be considered to be two extremes, where the first method gives an upper bound of the SOA mass formed during the exper-iments whereas the second method gives a lower bound of the SOA formed during the experiments (at least if the SOA particles on the chamber walls are not evaporating and the gas-phase losses directly to the chamber walls are negligi-ble).
ADCHAM considers the deposition of particles onto chamber walls and also keeps track of the particles deposited on the walls. The model also treats the mass-transfer-limited gas–particle partitioning between the gas phase and the wall-deposited particles. Hence, ADCHAM can be used to study the influence of chamber wall effects on the SOA mass for-mation and help to constrain the uncertainties of the formed SOA mass (SOA mass yield).
For non-charged particles, ADCHAM uses the indoor de-position loss rate model from Lai and Nazaroff (2000), which accounts for different deposition loss rates on upward-, downward- and vertically facing surfaces. Howeverupward-, if a considerable fraction of the particles are charged (e.g. at Boltzmann charge equilibrium) the effective deposition loss rate of particles can be considerably enhanced (Pierce et al., 2008). Hence, in order to be able to model realistic deposi-tion loss rates of charged particles, ADCHAM keeps track of the fraction of particles suspended in the air with zero, one, two or three elemental charges in each particle size bin. The first-order deposition loss rate (s−1) due to charge (k
charge)
is calculated with Eq. (3), whereνeis the characteristic
av-erage deposition velocity due to electrostatic forces (m s−1)
(McMurry and Rader, 1985). The deposition loss rates de-pend on the friction velocity and for charged particles also on the mean electrical field strength within the chamber (E′′).
Unfortunately both of these parameters are usually poorly known and need to be constrained with model simulations of seed aerosol deposition experiments (see Sect. 3.4). Mc-Murry and Rader (1985) found thatE′′was∼45 V cm−1in
an almost spherical∼0.25 m3Teflon chamber. On the
cham-ber surfaces they measured a negative electrical field strength of −300±150 V cm−1. They attributed the lower
empiri-cally derived electric field within the chamber to the fact that the particles in the chamber will be influenced by a net elec-trical field, which has contributions from all points on the chamber surfaces. Hence, the shape and size of the chamber will also influence the mean electrical field.
kcharge=Achamberve Vchamber , ve=
neCcE′′
3π µDp; (3)
Achamberis the chamber surface area,Vchamberis the chamber
volume,n is the number of elemental charges of the
parti-cle,eis the elementary charge,Cc is the Cunningham slip
correction factor andµis the dynamic viscosity of air.
The mass-transfer-limited uptake of gases to and from the chamber walls needs to be considered in order to take into account the potential uptake (dissolution) of organic com-pounds in the SOA particles deposited on the chamber walls (Hildebrandt et al., 2009), as well as direct uptake of gas-phase molecules onto the Teflon chamber surfaces (Mat-sunaga and Ziemann, 2010). For the condensation uptake or evaporation of SOA from the particles deposited on the walls, we assume that the particles deposited on the walls behave as if they were still suspended in (direct contact with) a thin (by default 1 mm thick) air layer adjacent to the cham-ber walls. As more particles get deposited on the walls, the SOA concentration on the chamber wall will increase. The condensable organic compounds in the thin air layer next to the chamber walls then have an increased probability to dis-solve into the organic particle phase on the walls. However, semi-volatile organic compounds may also evaporate from the particles on the walls when the gas-phase concentrations in the chamber are reduced. The gas–particle partitioning be-tween the wall-deposited particles and the thin air layer next to the chamber walls is modelled with the condensation and evaporation module described in Sect. 2.2.1.
ADCHAM also considers the adsorption and desorption of condensable organic compounds onto the Teflon surface film. This is modelled as a reversible process in accordance with Matsunaga and Ziemann (2010). The adsorption of gas-phase organic compounds onto the chamber walls is represented by a first-order loss rate from the near-wall gas phase to the walls (kg,w). The desorption rate from the Teflon surfaces
out to the thin layer next to the chamber walls (kw,g,i)
de-pends on the pure-liquid saturation vapour pressures (p0,i) of
the adsorbed compounds (Eq. 4) (Matsunaga and Ziemann, 2010). Equations (5) and (6) describe the rate of change of the organic compound (Xi) (due to adsorption and
desorp-tion) on the chamber walls and in the air layer adjacent to the wall, respectively. [Xi,g,w] is the concentrations of
com-pound Xi in the thin layer adjacent to the chamber walls.
The concentration at the chamber wall ([Xi,w]) is given as
an effective chamber volume concentration (total number of
Xi molecules on the walls divided by the total chamber
vol-ume (Vchamber)).Vwall is the air volume of the thin (1 mm)
layer adjacent to the chamber walls,Cwis an effective
wall-equivalent mass concentration which the organic compounds can dissolve into,Mwis the average molar mass of the Teflon
film, andγw,i is the activity coefficient of compoundiin the
Because ADCHAM calculates the gas–wall uptake from the thin layer (volume) adjacent to the Teflon walls and not from the total chamber volume, the kg,w values used in the
model need to be substantially larger than the (experimen-tally quantifiable) effective total chamber volume loss rate
kg∗,w(e.g. from Matsunaga and Ziemann, 2010). If the mass
transport across the laminar layer adjacent to the chamber walls does not pose a strong limitation on the gas–wall up-take (1x≈1 mm), the kg,w value used in ADCHAM can
be derived from the experimentally determined effective loss rate by scaling k∗g,w with the ratio between the total
cham-ber volume and the air volume adjacent to the chamcham-ber walls (Vchamber/Vwall). However, if 1x is relatively large
(e.g. 10 mm),kg,wneeds to be increased in order to match the
experimentally derived gas–wall losses. In the supplemen-tary material we illustrate this with a few examples. Here we also illustrate that the modelled gas–wall uptake is not sensi-tive to the absolute width of the thin air layer adjacent to the chamber walls as long askg,w is scaled withVchamber/Vwall
(see Supplement Fig. S1).
kg∗,wandCw/ Mwγw,iin Eq. (4) were experimentally
de-termined by Matsunaga and Ziemann (2010) for a 5.9 m3
Teflon chamber. Forn-alkanes, 1-alkenes, alcohols and
2-ketones,Cw/ Mwγw,iwas 9, 20, 50 and 120 µmol m−3,
re-spectively. kg∗,w varied between 1/3600 and 1/480 s−1
de-pending on the type of compound.
kw,g,i=
kg,w
(RT /p0,iCw/ Mwγw,i
(4) d
Xi,w
dt = kg,w
Xi,g,w−kw,g,iXi,w
Vwall
Vchamber (5)
d Xi,g,w
dt = −kg,w
Xi,g,w+kw,g,iXi,w (6)
According to Eq. (4), a compound withp0=2.5×10⁻²Pa
andCw/ Mwγw,i=10 µmol m−3partitions ∼50 % to the
gas phase and ∼50 % to the chamber walls at
equilib-rium and room temperature. At equilibequilib-rium, compounds with a vapour pressure <10−3Pa and Cw/ Mwγw,i
>
10 µmol m−3 will almost exclusively be found at the walls
if they are not able to form SOA rapidly enough. Hence, the SOA formation in the smog chamber will depend on (1) the formation rate of condensable organic compounds, (2) the particle deposition losses, (3) the magnitude of the conden-sation sink to the particles in the air and onto the chamber walls, and (4) the diffusion-limited uptake onto the chamber walls and particles on the walls.
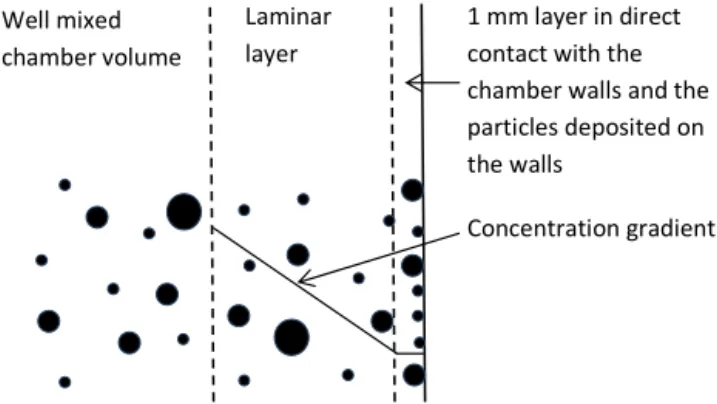
The concentration gradient in the laminar layer adjacent to the chamber walls generally drives condensable gas-phase components from the well-mixed chamber volume to the chamber walls (thin model layer next to the wall). We explic-itly model this mass transfer with Fick’s first law of diffusion, assuming a linear concentration gradient across the laminar layer next to the chamber wall (see Fig. 2).
Laminar layer
1 mm layer in direct contact with the chamber walls and the particles deposited on the walls
Well mixed
chamber volume
Concentration gradient
Figure 2.Schematic figure which illustrates how ADCHAM treats
the diffusion-limited mass transfer of gas-phase compounds across a laminar layer next to the chamber walls. The thin (1 mm thick) air layer next to the chamber walls is treated as a separate volume which exchanges gas-phase compounds with the well-mixed cham-ber and the walls+wall-deposited particles.
In Sect. 3.4 we study how different values of the laminar layer width influence the model results. The gas-phase chem-istry and the gas–particle mass transfer (condensation) in the well-mixed chamber volume and in the thin layer adjacent to the chamber wall were solved using operator splitting with a model time step of 10 ms. The mass transfer between the well-mixed chamber volume and the thin layer next to the chamber wall was modelled with a time step of 0.1 ms. The model needs to take short time steps because of the large con-densation sink (or evaporation source) of the wall-deposited particles and the Teflon surfaces, which may rapidly alter the concentrations in the thin air layer next to the chamber walls. In Sect. 3.2 we evaluate the potential influence of the re-versible uptake of organic compounds to the smog chamber Teflon walls on the volatility and evaporation rates of SOA particles. In Sect. 3.4 we test the capability of ADCHAM to simulate the losses of organic compounds from the gas phase to the Teflon walls and wall-deposited particles.
2.2.4 Size distribution structures
(Sects. 3.2 and 3.3). For coagulation we use a fully station-ary method in which the formed particles mass and number concentrations are split between the existing diameter bins (Sect. 2.2.2).
2.3 Particle-phase chemistry
2.3.1 Activity coefficients and organic–inorganic interactions
The AIOMFAC model is based on the UNIFAC (UNIquac Functional group Activity Coefficients) model for organic mixtures but also considers organic–inorganic interaction which allows us to study salt effects on the SOA formation. AIOMFAC (Aerosol Inorganic-Organic Mixtures Functional groups Activity Coefficients) considers interactions between 12 different ions (including NH+
4, NO−3, H+, SO−42 and
HSO−
4) and alkyls, hydroxyls, carboxyls, ketones, aldehydes,
ethers, esters, alkenyls, aromatic carbon alcohols and aro-matic hydrocarbons (Zuend et al., 2008, 2011). For other im-portant functional groups, i.e. nitrates, nitros, PANs and per-oxides, we only consider organic–organic functional group interactions. In total the model considers 52 different UNI-FAC functional subgroups, with interaction parameters from Hansen et al. (1991), except for alcohols (Marcolli and Pe-ter, 2005) and nitrates, PANs and peroxides, for which we use the parameterization from Compernolle et al. (2009). In ADCHAM, the activity coefficients are calculated be-fore the condensation algorithm is used and when updating the hydrogen ion concentration ([H+]) for the acid-catalysed
oligomerization.
2.3.2 Acidity and dissociation of inorganic compounds in organic-rich phases
The hydrogen ion concentration is calculated in the con-densation algorithm and when considering acid-catalysed oligomerization. Analogous to the procedure in ADCHEM (Roldin et al., 2011a), [H+] in the particle water or particle
water+organics phase is calculated by solving the ion
bal-ance equation (Eq. 7). In ADCHAM we have extended the ion balance equation with dissociation products of carboxylic acids (RCOO−). In this work we assume that all carboxylic
acids have identical dissociation constants (see Sect. 3.2). Hence, [RCOO−] in Eq. (7) represents the total
concentra-tion (mol kg−1solvent) of dissociated carboxylic acids.
[H+]+NH+
4+[Na+]=NO−3+2 h
SO2− 4
i
+HSO−
4 (7) +[Cl−] + [OH−] +HCO−3+2hCO23−i+ [RCOO−]
In order to calculate [H+], all concentrations except
the hydrogen ion concentration in Eq. (7) are replaced with known equilibrium coefficients, activity coeffi-cients from AIOMFAC, and the total concentration
of dissolved dissociated and non-dissociated com-pounds, ([RCOOH]+[RCOO−]), ([NH3(aq)]+[NH+4]),
([SO2−
4 ]+[HSO−4]), ([HNO3]+[NO−3]) and ([HCl(aq)]+
[Cl−]). In this work the uptake of CO
2in the particles was
treated as an equilibrium process. The HCO−
3 and CO23−
concentrations depend on the hydrogen ion concentration and the CO2partial pressure (390 ppbv). When all unknown
ion concentrations have been replaced with the known parameters, Eq. (7) becomes an eight-order polynomial with [H+] as the only unknown variable. The hydrogen ion
concentration is given by the maximum real root of this polynomial.
To treat the CO2 uptake as an equilibrium process may
not be realistic if the particles are very viscous (see Sect. 1). However, the estimated diffusion coefficients of other small “guest” molecules (e.g. O3, OH and H2O) in an amorphous
glassy organic matrix is of the order of 10−10–10−12cm2s−1
at room temperature (Koop et al., 2011; Zobrist et al., 2011). This gives corresponding e-folding times of equilibration for submicron particles in the range of seconds.
All experiments which we model in this paper were per-formed under dry conditions (RH≤5 %). For theα-pinene
SOA experiments (Sects. 3.2–3.3), the modelled particle wa-ter mass content is only∼0.4 % at an RH of 5 %. For these
particles the solvent will therefore mainly be the organic compounds and not water. Hence, in this work the concen-trations of the inorganic ions (including H+) is not given for
the aqueous phase but for the combined organics and wa-ter phase. Henry’s law coefficients (KH) of inorganic
com-pounds and dissociation rates (Ka) of inorganic compounds
and carboxylic acids are (if at all) usually only available for aqueous solutions. However, there is often a relationship be-tween the1pKa (−log10(Ka,base)+log10(Ka,acid)) and the
proton transfer between the Brønsted acid and the Brønsted base in protic ionic liquids (Greaves and Drummond, 2008). Thus, for most of the simulations we will use the aqueous dis-sociation rates and Henry’s law coefficients for the organic amorphous SOA and water mixtures, and take into account the non-ideal interactions between the ions, organic solvents and water using AIOMFAC (Sect. 2.3.1). However, we will also test to model the ammonium uptake with 10-times-lower Henry’s law coefficients, which may be more appropriate for organic solvents.
With these assumptions in mind, the modelled absolute values of [H+] should be interpreted with caution. However,
we believe that the model can give a realistic representation of the relative influence of different types of dissolved com-pounds on the particle acidity. For instance, carboxylic acids will most likely increase [H+] also in an organic-rich phase,
while dissolved ammonia will decrease [H+]. For all other
acidity will mainly be governed by the carboxylic acids and inorganic compounds.
2.3.3 Inorganic and organic salt formation
In ADCHAM the inorganic salts (NH4)2SO4, NH4HSO4and
NH4NO3 and the organic salts of ammonium and different
carboxylic acids (NH4RCOO) can be considered to form.
All these salts contain NH+
4, and which of these salts will
be formed depends on the solubility constants, the ammo-nium concentration, the concentration of the different anions and the activity coefficients. Because all these salts contain ammonium, the salt which forms first will limit the forma-tion of other salts. In this work, we only simulate experi-ments performed on pure organic particles or organic parti-cles which take up NH3(g). Hence, NH4RCOO(s) was the
only (solid) salt which was considered to be formed in the particle organics–water phase. The solid salt concentrations are updated iteratively at every time step in which the con-densation/evaporation algorithm is used.
When updating the NH4RCOO(s) concentration,
AD-CHAM starts by estimating the activity coefficients and the hydrogen ion concentration (Eq. 7). After this, non-equilibrium NH+
4 and RCOO−concentrations ([NH+4]∗and
[RCOO−]∗) can be derived, and the total concentrations
of NH4 ([NH4,tot]=[NH4+]∗+[NH4RCOO]t−1) and RCOO
([RCOOtot]=[RCOO−]∗+[NH4RCOO]t−1) are estimated.
These values are then inserted into the solubility prod-uct equation (Eq. 8). Rearranging Eq. (8) gives a second-order polynomial where the new NH4RCOO concentration
([NH4RCOO]t) is given by the smallest positive real root.
Fi-nally the NH+
4 and RCOO−concentrations are updated and
the iteration starts from the beginning by deriving the hydro-gen ion concentration again. The iteration proceeds until the relative change in the NH+
4, RCOO−and H+concentrations
all are less than 10−3within one iteration step. The activity
coefficient of the dissociated carboxylic acids (γRCOO) was
assumed to be equal to the activity coefficient of undissoci-ated pinonic acid.
KNH4RCOO=γNH4γRCOO
NH+
4[RCOO−] (8)
=γNH4γRCOO [NH4,tot] − [NH4RCOO]
(RCOOtot− [NH4RCOO])
2.3.4 Acid-catalysed oligomerization
Any oligomerization mechanisms in the gas phase (g) or par-ticle phase (p) (including different functional groups, ozonol-ysis, acid-catalysed reactions, and radicals) can easily be im-plemented in ADCHAM. For the applications in this work, we only consider the reactions between monomers which form dimers and not the possible reactions between dimers and dimers with monomers. The acid-catalysed formation rate of a dimer in the particle phase can generally be con-sidered to be proportional to the hydrogen ion concentra-tion (see e.g. schemes by Tolocka et al., 2004, and Iinuma
et al., 2004). In contrast to thermodynamic equilibrium mod-els (e.g. Barsanti and Pankow, 2004), ADCHAM explicitly treats the kinetics of reversible dimerization with separate Reactions (R1) and (R2) for the formation and the degra-dation of dimers back to monomers. Based on observations, several different particle-phase oligomerization mechanisms have been suggested. These include (i) esters formed from re-actions between carboxylic acids and alcohols (e.g. Surratt et al., 2006), (ii) hemiacetal formation from reactions between carbonyls and alcohols (e.g. Iinuma et al., 2004), (iii) aldol reaction products formed from carbonyl–carbonyl reactions (Casale et al., 2007) and (iv) peroxyhemiacetals formed from reactions between hydroperoxides and carbonyls (e.g. To-bias and Ziemann, 2000). Dimers can also form when car-bonyls react with ozone in the particle phase and form sec-ondary ozonides (Reaction R3) which then rapidly react with other organic compounds and form dimers (Maksymiuk et al., 2009). Based on thermodynamic calculations of differ-ent organic mixtures, it has been suggested that ester for-mation (Barsanti and Pankow, 2006) and peroxyhemiacetal formation (DePalma et al., 2013) can be thermodynamically favourable, while hemiacetal formation is not (Barsanti and Pankow, 2004 and DePalma et al., 2013).
If peroxyhemiacetal and hemiacetal formation are ther-modynamically favourable, then these mechanism are prob-ably rapid enough to form substantial dimer mass on short timescales (minutes to hours). The second-order rate constants (kf) for uncatalysed reactions of
differ-ent hydroperoxides and aldehydes to form peroxyhemi-acetals range from 0.5 to 70 M−1h−1 (2.3×10⁻²⁵–3.2×
10−23molecules−1cm3s−1) (Ziemann and Atkinson, 2012).
According to Ziemann and Atkinson (2012) peroxyhemiac-etal formation can probably be acid-catalysed. Thus, for acid particles,kfmay be larger than the values reported by
Zie-mann and Atkinson (2012). Shiraiwa et al. (2013a) found that in order for the KM-GAP model to capture the tempo-ral evolutions of the SOA formation and shape of the particle number size distribution during an dodecane photooxidation experiment, the peroxyhemiacetal formation rate needs to be 12 M−1s−1(2×10⁻²⁰molecules−1cm3s−1). This high
for-mation rate can be attributed to the presence of carboxylic acids (Shiraiwa et al., 2013a). The formation of hemiac-etal from the reaction between achemiac-etaldehyde and methanol is acid-catalysed with a third-order reaction-specific formation rate constant (kf,H+) equal to 4.9×10⁶M−2h−1 (Ziemann and Atkinson, 2012). With a pH of 4, this corresponds to akf
of 2.3×10⁻²²molecules−1cm3s−1.
monomerj+monomeri
H+
−→dimerj i (R1)
dimerj i−→monomerj+monomeri (R2)
carbonyls(p)+O3(p)−→secondaryozonides(p) (R3)
(e.g. Kroll and Seinfeld, 2008; Ng et al., 2008) (Reac-tion R4). Recently, Ehn et al. (2014) also showed that ex-tremely low volatility organic compounds (ELVOC) can form during ozonolysis of α-pinene. The authors propose
that ELVOC is formed from RO2, which rapidly takes up O2
after intramolecular hydrogen abstraction in several steps. RO2(g)+RO2(g)−→ROOR-type peroxides(g) (R4)
The acid-catalysed dimer formation rates in the parti-cle phase (Ff(p)) between monomer (denoted by index i and j ) depend on the monomer concentrations, kf,H+ (molecules−2cm6s−1) and the hydrogen ion concentration
(cH+) (Eq. 9). If the dimerization process is uncatalysed, the formation rate depends on the monomer concentrations and a second-order rate constant (kf(molecules−1cm3s−1)).
The degradation rate (Fd(p)) of a dimer (denoted by
in-dex q) simply depends on the dimer concentration and a
dimer-specific first-order degradation reaction rate constant (kd(s−1))(Eq. 10).
Ff,i,j(p)=kf,H+(p) cH+(p) cm,i(p) cm,j(p) (9)
Fd,q(p)=kd(p) cd,q(p) (10)
The temporal evolution of the dimer and the monomer con-centrations (cdandcm) in the particle bulk layers and
surface-bulk layer are derived with a kinetic model. This code solves a coupled ordinary differential equation system, con-sisting of one ordinary differential equation for each SOA monomer (Eq. 11) and one ordinary differential for each dimer (Eq. 12). The equations are given by the sum of all dimer degradation and formation rates for the individual re-actions which each monomer compound is involved in.
dcm,i
dt =
Z
X
q=1
(Fd,qxm,i,q)− N
X
j=1
Ff,i,j (11)
dcd,q
dt = −Fd,q+
M
X
i=1 (
N
X
j=1
Ff,i,j)xd (12)
xm,i,q= N
X
j=1 Ff,i,j/
M
X
i=1 (
N
X
j=1
Ff,i,j) (13)
In order to not end up with an enormous coupled ordinary differential equation system, the different dimers are classi-fied into different categories (types) depending on the dimer-ization mechanism (e.g. esters or peroxyhemiacetal forma-tion). Secondary ozonide formation (Reaction R3) is treated by the kinetic multilayer module for heterogeneous oxidation (see Sect. 2.4.2). In order to be mass-conserving, the number of moles of dimer formed is corrected with the molar ratio (xd) between the molar mass of the product(s) and the sum of
the molar masses of the reacting compounds. In ADCHAM all dimers have by default a molar mass of 400 g mol−1.
When we lump the dimers into different categories, the in-formation about their exact chemical composition and origin is lost. This can be a problem when considering the reversible reactions back to monomers. In this work we have assumed that a dimer is converted back to the monomers it is formed from, with fractions (xm) corresponding to the (current time
step) relative contribution of each monomer to the dimer for-mation (Eq. 13). This can be a reasonable assumption if the monomer SOA composition does not change substantially on a timescale longer than the lifetime of the dimer. However, if this is not the case it can distort the modelled particle compo-sition. With this method we do not take into account that spe-cific compounds of the same type of dimer (e.g. esters) may have substantially different formation and degradation rates, e.g. depending on other functional groups in the molecules (Ziemann and Atkinson, 2012). However, in principle the method still enables an unlimited number of different dimer types and dimer-specific formation and degradation rates.
The modelled relative amount and composition of oligomer SOA in each particle layer depends on (1) the monomer SOA composition, (2) the hydrogen ion concen-tration, (3) the dimer formation rates, (4) the oligomer degra-dation reaction rates, (5) possible evaporation and condensa-tion of monomers and dimers (vapour pressures), (6) the mix-ing between different particle layers (diffusion coefficients of monomers and dimers), (7) the ozone uptake at the particle surface, (8) the ozone diffusion rate within the particle bulk phase, (9) the reaction rates of ozone with unsaturated or-ganic compounds in the particle phase, and (10) the time of aging. Points 1–9 all bear large uncertainties which need to be constrained in order to represent oligomerization in an ac-curate way. For the model applications in this work we will not explicitly model the influence of particle acidity on the dimer formation rates because these values are very uncer-tain regardless.
2.4 Kinetic multilayer model
For the oxidation agents we model the uptake to the sorp-tion layer as a reversible adsorpsorp-tion process, followed by dif-fusion to and from the particle surface-bulk and bulk lay-ers. In this work, the partitioning of organic and inorganic compounds to and from the monolayer thick particle surface-bulk layer is modelled as a condensation/evaporation pro-cess (Eq. 1), taking into account the possibility of non-unity surface-bulk accommodation (Sect. 2.2.1). However, in prin-ciple ADCHAM could also model the gas–particle partition-ing of organic and inorganic compounds as a reversible ad-sorption process. Analogous to KM-SUB and KM-GAP, AD-CHAM explicitly treats the bulk diffusion of all compounds between the different layers using first-order mass transport rate equations.
The kinetic multilayer model in ADCHAM consists of two separate modules. The first module (Sect. 2.4.1) treats the diffusion of all organic and inorganic compounds (except
Zox) between the different bulk layers. The second module
(Sect. 2.4.2) considers the uptake, diffusion and reactions of
Zox with the organic compounds in the particle phase. The
main reason why these processes are treated by two sepa-rate modules is that the uptake, diffusion and reaction of O3
and other oxidation agents generally occur on substantially shorter timescales than the diffusion of the organic com-pounds.
2.4.1 Diffusion of organic and inorganic compounds The transport velocity of compoundXibetween the bulk
lay-ers or the surface and first bulk layer is given by Eq. (14).DXi is the diffusion coefficient of compoundXi, andδkandδk+1
represent the width of the two adjacent layers (kandk+1)
whichXi is transported between.
kk+1,k,Xi=kk,k+1,Xi=
4DXi π (δk+1+δk) /2
(14) The transport of compound Xi between the particle layers
(including the exchange between the surface- and first bulk layer) is modelled with Eq. (15).Akis the area of exchange
between layerk−1 andk. VXi
kis the absolute volume
con-centration (m3) and [X
i]k is the relative volume
concentra-tion (volume fracconcentra-tion) of compoundXi in layerk. The total
volume of each particle layer (Vk) is given by the sum of
the absolute volume concentrations of all compounds. Equa-tion (16) contains no terms for the chemical formaEqua-tion and degradation of Xi because this is considered by separate
modules for oligomerization (Sect. 2.3.4), heterogeneous ox-idation (Sect. 2.4.2) and organic salt formation (Sect. 2.3.3).
d VXi
k
dt =(kk−1,k[Xi]k−1−kk,k−1[Xi]k)Ak (15) + −kk,k+1[Xi]k+kk+1,k[Xi]k+1
Ak+1
The equations describing the concentration change of all compounds in all layers (Eq. 15) comprise a system ofN×
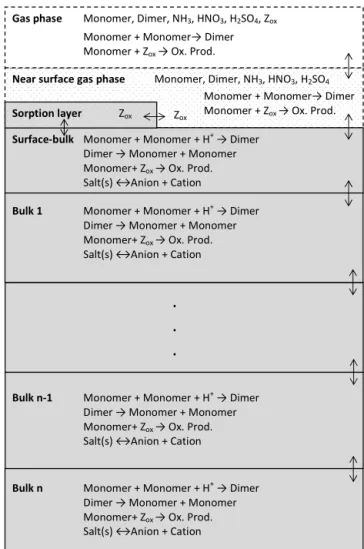
Gas phase Monomer, Dimer, NH3, HNO3, H2SO4, Zox
Near surface gas phase Monomer, Dimer, NH3, HNO3, H2SO4
Surface-bulk Monomer + Monomer + H+ → Dimer
Dimer → Monomer + Monomer Monomer+ Zox → Ox. Prod.
Salt(s) ↔Anion + Cation
Sorption layer Zox
Monomer + Monomer→ Dimer Monomer + Zox → Ox. Prod.
Monomer + Monomer→ Dimer Monomer + Zox → Ox. Prod.
Bulk 1 Monomer + Monomer + H+ → Dimer Dimer → Monomer + Monomer Monomer+ Zox → Ox. Prod.
Salt(s) ↔Anion + Cation
.
.
.
Bulk n-1 Monomer + Monomer + H+ → Dimer Dimer → Monomer + Monomer Monomer+ Zox → Ox. Prod.
Salt(s) ↔Anion + Cation
Bulk n Monomer + Monomer + H+ → Dimer Dimer → Monomer + Monomer Monomer+ Zox → Ox. Prod.
Salt(s) ↔Anion + Cation Zox
Figure 3.Schematic picture which illustrates the model structure
and processes included in the kinetic multilayer model in AD-CHAM. The double arrows represent the mass transport between the layers.
NLcoupled ordinary differential equations (NL=number of
particle layers), which we solve with the ode15s solver in MATLAB.
Figure 3 shows a schematic picture of the kinetic layer module in ADCHAM. In contrast to the kinetic multi-layer model by Shiraiwa et al. (2010, 2012), the number of particle layers increases when the particles grow. Hence, par-ticles of different sizes are composed of different number of layers.
Once the depth of the surface-bulk layer becomes larger than 1.1 nm, material is moved from this layer to the first bulk layer, leaving a 1 nm thick surface-bulk layer. If the first bulk layer becomes larger than a certain value (by default 3 nm thick) it is split into a first and second bulk layer with identical compositions, 1 and 2 nm thick, respectively.
layer in order to keep the surface-bulk layer width intact. If the first bulk layer width becomes less than a certain value (by default 0.8 nm), this layer is merged together with the second bulk layer, and together they form a new first bulk layer. The rest of the particle bulk is divided into layers with variable width. The layer width depends on the net mass transport to the adjacent layers and chemical reactions (e.g. between O3and unsaturated hydrocarbons).
In each particle layer the model considers different oligomerization reactions and the equilibrium reactions be-tween salts and their dissolved ions in the organic+water
phase (Sects. 2.3.3 and 2.3.4). The formed oligomers and salts make up a particle volume fraction (fp) with
gen-erally substantially lower diffusivity than the rest of the compounds. Hence, oligomerization and solid salt forma-tion increases the viscosity, which also limits the diffusion of the liquid compounds according to the obstruction the-ory (Stroeve, 1975). The treatment of the oligomers as solid non-diffusing compounds which limit diffusion of the liquid compounds was adopted from Pfrang et al. (2011), who used KM-SUB to model degradation of an organic 12-component mixture with ozone.
According to the obstruction theory the diffusivity of com-poundXi(DXi) is a function of the fraction of solid or semi-solid material and the diffusivity (D0,Xi) without any solid or semi-solid material (Eq. 16). The diffusivity of organic compounds can vary from ∼10−5 cm2s−1 in a liquid to ∼10−20cm2s−1 in a solid organic matrix (Shiraiwa et al.,
2011).
DXi=D0,Xi 2−2fp
/ 2+fp (16)
2.4.2 Diffusion of oxidation agents and reactions with SOA
The diffusion of oxidation agents (Zox) between the particle
bulk layers is similar to the treatment of other compounds (Eqs. 14 and 15), except that we do not consider that the dis-solvedZoxin the particle phase takes up a bulk volume of its
own.
The uptake ofZoxfrom the gas phase to the particle
sur-face is treated as a reversible adsorption process (Fig. 3). This approach was adopted from Shiraiwa et al. (2010). The sur-face accommodation coefficient ofZoxis given by Eq. (17). θs,Zox is the relative coverage of adsorbedZox on the parti-cle surface. The adsorption ofZox from the near-surface gas
phase (gs) to the sorption layer (so) and the desorption from the sorption layer to the near-surface gas phase are given by Eqs. (18) and (19), respectively. ωZox is the mean thermal velocity ofZoxandτd,Zoxis the desorption lifetime ofZox.
The transport velocity ofZox from the surface-bulk layer
to the sorption layer is given by Eq. (20).δsis the width of
the monolayer thick surface-bulk layer anddZoxis the width of the sorption layer. Hence, δs+dZox
/2 in Eq. (20)
repre-sents the average travel distance between the sorption and surface-bulk layer. The transport velocity of Zox from the
sorption layer to the surface-bulk layer can then be calcu-lated from Eq. (21).KH,Zox is the Henry’s law coefficient of
Zox.
αs,Zox=αs,0,Zox 1−θs,Zox
, θs,Zox=
[Zox]sodZ2oxπ
4 (17)
Jads,Zox=[Zox]gsωZoxαs,Zox/4 (18)
Jdes,Zox=τ
−1
d,Zox[Zox]so (19)
ksu,so,Zox≈
4DZox
π δs+dZox
/2 (20)
kso,su,Zox=
4ksu,so,ZoxKH,Zoxτd−,Z1ox
αs,ZoxωZox
T R (21)
Equations (22)–(24) form a differential equation system which describes the rate of change of theZox concentration
in the particle sorption layer, particle surface-bulk layer, and particle bulk layers. The chemical oxidation reactions be-tweenZox and the organic compounds (Xi)are represented
by the last term in Eqs. (23) and (24), where the summation is over all compounds which react and consumeZoxin the
par-ticle phase. The module also calculates the temporal evolu-tion of the organic compounds (Xi) consumed byZoxand the
organic compounds formed from the oxidation reactions (Yi)
(Eqs. 25 and 26). The diffusion of these compounds is treated by the kinetic multilayer module described in Sect. 2.4.1. d[Zox]so
dt =Jads,Zox−Jdes,Zox−kso,su,Zox[Zox]so (22) +ksu,so,Zox[Zox]su
d[Zox]su
dt = kso,su[Zox]so−ksu,so[Zox]su Asu
Vsu (23)
+ −ksu,b1[Zox]su+kb1,su[Zox]b1
Ab1 Vsu
− N
X
i=1
kOx,i[Xi]su[Zox]su
d[Zox]bk
dt =(kbk−1,bk[Zox]bk−1−kbk,bk−1[Zox]bk) Abk Vbk (24) +(−kbk,bk+1[Zox]bk+kbk+1,bk[Zox]bk+1)
Abk+1 Vbk
− N
X
i=1
kOx,i[Xi]bk[Zox]bk
d[Xi]bk
dt = −kOx,i[Xi]bk[Zox]bk (25)
d[Yi]bk
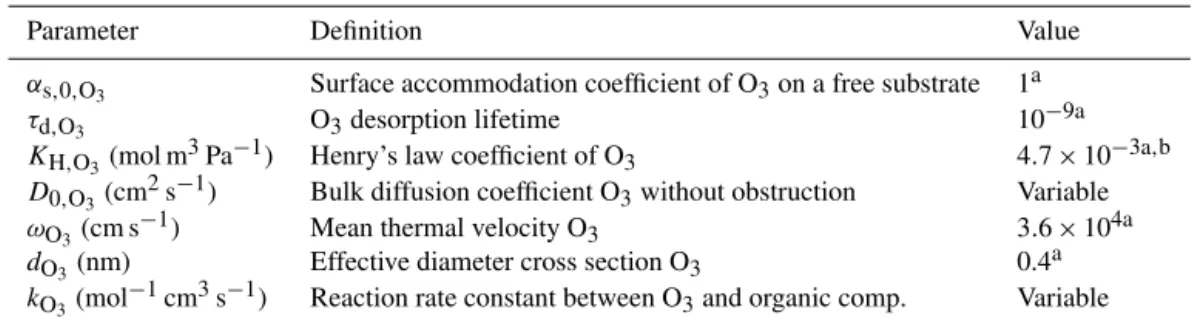
Table 1.Model parameters used in the multilayer module for O3uptake, diffusion and reactions in the particle phase.
Parameter Definition Value
αs,0,O3 Surface accommodation coefficient of O3on a free substrate 1a
τd,O3 O3desorption lifetime 10−9a
KH,O3(mol m3Pa−1) Henry’s law coefficient of O3 4.7×10⁻³a,b D0,O3(cm2s−1) Bulk diffusion coefficient O3without obstruction Variable
ωO3 (cm s−1) Mean thermal velocity O3 3.6×10⁴a
dO3 (nm) Effective diameter cross section O3 0.4a
kO3(mol−1cm3s−1) Reaction rate constant between O3and organic comp. Variable
aValues from Pfrang et al. (2011).
bDifferent unit than in Pfrang et al. (2011).
Table 1 gives the values of different parameters used in the multilayer module for ozone uptake, diffusion and reactions within the particle phase. Most of the values were adopted from Table 1 in Pfrang et al. (2011).
The coupled ordinary differential equation system describ-ing the temporal evolution of Zox and the concentration of
compounds which are consumed or formed from theZox
ox-idation is solved with the ode15s solver in MATLAB.
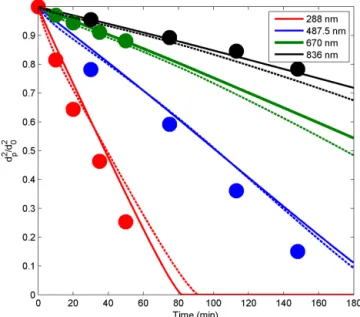
3 Model applications
In order to test and illustrate the capability of ADCHAM, we apply the model to four types of published experimental re-sults. In Sect. 3.1 we model the evaporation experiments of liquid DOP particles presented in Vaden et al. (2011), which have been modelled by Shiraiwa et al. (2012) with the KM-GAP model. In Sect. 3.2 we model the evaporation experi-ments ofα-pinene SOA particles by Vaden et al. (2011). In
Sect. 3.3 we model the SOA formation, ammonia uptake, and organic salt (NH4RCOO) formation in theα-pinene–NH3–
O3experiments by Na et al. (2007). Finally, we apply
AD-CHAM to anm-xylene oxidation experiment from Nordin et
al., 2013 (Sect. 3.4). These examples serve to illustrate the wide applicability of ADCHAM.
For the simulations in Sects. 3.2–3.3 we model the conden-sational growth of particles formed by homogeneous nucle-ation using the condensnucle-ation module described in Sect. 2.2.1 using the fully moving method (see Sect. 2.2.4). We start with one particle size and add new particle size bins during the early stage of particle formation. The new particles are assumed to be composed of non-volatile SOA material and are introduced into the model at an initial diameter of 5 nm. Hence, in this work we do not treat the initial activation and growth of the formed molecular clusters. The new particle formation rate (J5nm) is assumed to be constant during the
experiments. A new size bin is added for the time step when the smallest particle size grows larger than 10 nm in diameter. For the experiments which we simulate in this work, the SOA mass (condensation sink) increases rapidly during the early stage of SOA formation. This effectively prevents the newly
formed particles from growing and thus generally keeps the number of model particle size bins down to∼20 (see Fig. S2
in the Supplement).
Table 2 summarizes the different processes and range of parameter values used for the different simulations in Sects. 3.1–3.4.
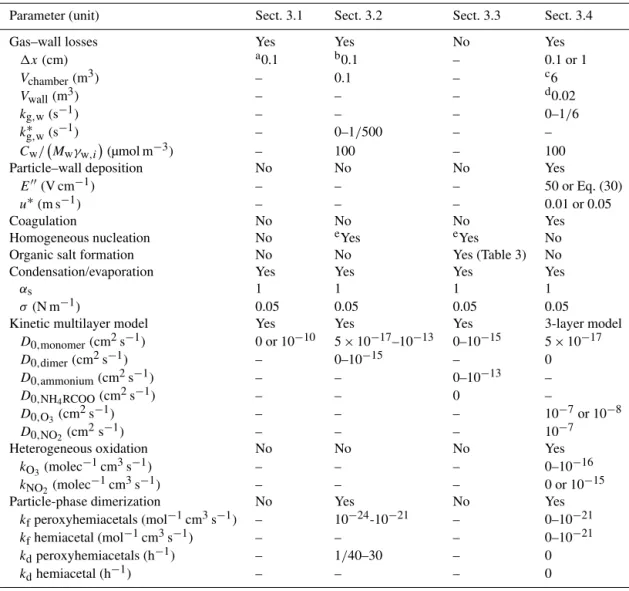
3.1 Simulations of DOP particle evaporation
Before modelling complex multicomponent SOA particle formation, growth and evaporation, we test ADCHAM on the evaporation experiments of single-component, liquid DOP particles (Vaden et al., 2011). In the study of Vaden et al. (2011), the particles were evaporated in a 7 L chamber with 1 L of activated charcoal at the bottom of the chamber. The particle number concentration was kept low (∼150 cm−3)
in order to keep the gas-phase concentration close to zero. Before the aerosol was introduced into the chamber, it was passed through two charcoal denuders in order to remove most of the gas-phase DOP (Vaden et al., 2011).
Here we adopt the approach from Shiraiwa et al. (2012), who modelled the gas-phase loss to the charcoal denuder us-ing Fick’s first law, on a laminar layer (1x)adjacent to the
charcoal denuder on the bottom of the chamber. Since the layer thickness is poorly known, we modelled the DOP(g) loss rate using different1xvalues. Coagulation and particle
wall losses were not considered. In this small chamber, the wall losses can be substantial; however particles deposited on the chamber walls not coated with charcoal will likely continue to evaporate and contribute to the gas-phase DOP. Neglecting the particle wall losses has the same effect as assuming that the particles deposited on the walls continue to take up vapours as if they were still suspended in the air (Sect. 2.2.3).
Vaden et al. (2011) and Shiraiwa et al. (2012) used a binary diffusion coefficient for DOP in air of 4.4×10⁻²cm2s−1
from Ray et al. (1988). This value was measured at a pres-sure of 98 Torr (0.13 atm), which is lower than the prespres-sure used in experiments. We have therefore estimated the diffu-sion coefficient (DDOP) with Eq. (27) (Jacobson, 2005a) and
Table 2.Summary of the processes and parameter values that were used for the simulations presented in Sects. 3.1 to 3.4.
Parameter (unit) Sect. 3.1 Sect. 3.2 Sect. 3.3 Sect. 3.4
Gas–wall losses Yes Yes No Yes
1x(cm) a0.1 b0.1 – 0.1 or 1
Vchamber(m3) – 0.1 – c6
Vwall(m3) – – – d0.02
kg,w(s−1) – – – 0–1/6
k∗g,w(s−1) – 0–1/500 – –
Cw/ Mwγw,i(µmol m−3) – 100 – 100
Particle–wall deposition No No No Yes
E′′(V cm−1) – – – 50 or Eq. (30)
u∗(m s−1) – – – 0.01 or 0.05
Coagulation No No No Yes
Homogeneous nucleation No eYes eYes No
Organic salt formation No No Yes (Table 3) No
Condensation/evaporation Yes Yes Yes Yes
αs 1 1 1 1
σ(N m−1) 0.05 0.05 0.05 0.05
Kinetic multilayer model Yes Yes Yes 3-layer model
D0,monomer(cm2s−1) 0 or 10−10 5×10⁻¹⁷–10−13 0–10−15 5×10⁻¹⁷
D0,dimer(cm2s−1) – 0–10−15 – 0
D0,ammonium(cm2s−1) – – 0–10−13 –
D0,NH4RCOO(cm2s−1) – – 0 –
D0,O3(cm2s−1) – – – 10−7or 10−8
D0,NO2 (cm2s−1) – – – 10−7
Heterogeneous oxidation No No No Yes
kO3(molec−1cm3s−1) – – – 0–10−16
kNO2 (molec−1cm3s−1) – – – 0 or 10−15
Particle-phase dimerization No Yes No Yes
kfperoxyhemiacetals (mol−1cm3s−1) – 10−24-10−21 – 0–10−21
kfhemiacetal (mol−1cm3s−1) – – – 0–10−21
kdperoxyhemiacetals (h−1) – 1/40–30 – 0
kdhemiacetal (h−1) – – – 0
aValue used for the gas uptake onto the charcoal denuder.
bSame value used for the charcoal denuder and the Teflon chamber walls.
cInitial value. During the experimentsV
chambergradually decreases.
dDerived with the assumption that the width of the thin air layer adjacent to the chamber walls is 1 mm.
eRepresented by adding new size bins with an initial particle diameter of 5 nm (see Sect. 3).
with Zhang et al., 1993). Equation (27) gives a DDOP of
1.5×10⁻²cm2s−1, while with the Chapman–Enskog theory,
utilizing a value of 1.34 for the collision integral ((DOP1,1),air)
(Hirschfelder et al., 1954), yields 2.9×10⁻²cm2s−1 for DDOPat 1 atm and 296 K.
Di =
5 16Nadi2ρair
s
RTMair
2π
M
i+Mair
Mi
(27)
Di=
3 8π (i,1air,1)pdi,2air
s
π k3bT3(mi+mair)
2mimair , (28)
di,air=
di+dair
2
In the above, Na is Avogadro’s number, ρair is the density
of air,Mair is the molar mass of air,Mi is the molar mass
of compoundi(MDOP=390.56 g mol−1),di is the collision
diameter of compoundi(dDOP=1.012 nm; Ray et al., 1979), di,air is the collision diameter for binary collisions between
compoundiand air molecules (dair=0.362 nm),mairis the
molecular mass of air,miis the molecular mass of compound
i, kbis the Boltzmann constant andpis the total pressure.
When we use Eq. (27), a laminar layer of 0.1 cm adjacent to the charcoal denuder wall and unityαs,DOP, the model is
in good agreement with the observed evaporation rates for all particle sizes. Similar results are also achieved when using Eq. (28), unityαs,DOPand a laminar layer of 0.6 cm adjacent
to the charcoal denuder (Fig. 4).
In Sect. 3.2 we compare the modelled and measuredα