RELATIVE ECONOMIC VALUE OF MAIZE - OKRA INTERCROPS IN RAINFOREST
ZONE, NIGERIA
Alabi, R. A and Esobhawan, A.O.
Department of Agric. Economics and Extension, Ambrose Alli University, P. M.B 14, Ekpoma, Edo State. TELEPHONE: (234)8033749812, E-mail: bayobimb@yahoo. com.
Manuscript received: November 15, 2005; Reviewed: December 4, 2006; Accepted for publication: December 5, 2006
ABSTRACT
This study determined the relative economic value of maize- okra intercrops in Edo State, Nigeria. The results of analysis show Land Equivalent Ratio (LER) of 0.82, Relative Value Total (RVT) of 0.99 and Relative Value of Intercropping (RVI) of 1.10. Although LER and RVT show that monocrops of maize and okra have advantage over intercrops, RVI shows that the profi t from intercrop is 10% higher than monocrops. This is because of the attendant reduction in variable costs of labour and fertilizer that are associated with intercrops. The economic implication of this study is that any strategy that reduces cost of production in maize/ okra intercrops will increase its profi tability and attractiveness to farmers.
INTRODUCTION
Agriculture plays an important role in the economic development of Nigeria. It provides food for the growing population, employment for over 65% of the population and raw materials and foreign exchange earnings for the development of industrial sector. However, the ability of Nigerian agriculture to perform its roles in development has been on the decline in the last two decades. Agricultural output started to decline rapidly in the 1970s, which coincided, not only with the end of the Nigerian civil war, but also the oil boom and the severe drought of 1972/73.
The overall agricultural situation deteriorated, creating wide gap between demand and supply for food. Revenue from the agricultural sector dwindled and the government was faced with mounting food import bills. At the same time, industries continued to import agricultural raw materials, thus putting considerable stress on Nigeria’s foreign exchange earnings. It was against this background of a rudimentary economy, but abundantly-endowed with human and natural resources, that Nigeria government adopted different agricultural programs and policies at raising the productivity and the effi ciency of the agricultural sector. These programs and policies placed the smallholder farmers in central focus. This was due to the fact that the nation’s agriculture had always been dominated by the smallholder farmers who represent a substantial proportion of the total farming population and produce over 90% of the total agricultural output in the country [3]. They produce grains, cassava, cocoa, yam, plantain, sweet potato, etc [6].
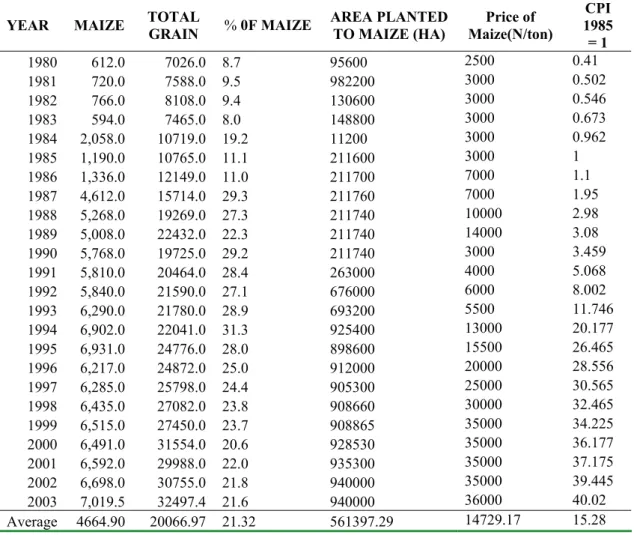
Grains produced in Nigeria are maize, rice, cowpea, soybean, sorghum, millet and groundnut [1]. The greater proportion of this grain is maize because of its ability to thrive under different ecological condition. FAO [9] fi gures show a consistent increase in production of these crops in Nigeria. Adekunle and Nabinta[1] also reported sustained increase in their output. Maize is the most important staple food in Nigeria. It accounted for about 43% of calorie intake [14]. The other major food crops in Nigeria are roots, tuber and other grains. Studies in maize production in different part of Nigeria have shown an increasing importance of the crop amidst growing utilization by food processing industries and livestock feed mills. The crop has thus grown to be local ‘cash crop’ most especially in the southwest part of Nigeria where at least 30% of the crop land has been devoted to maize production under various cropping system [7]. Growing maize in farms of 1-2 hectares can overcome hunger in the household and the aggregate effect could double food production in Africa [15]. Table 1 shows that the output of maize increased from 612 thousand
tonnes in Nigeria to 70195 thousand tonnes, which is more than 1000% increase. About 4.7 million tonnes of maize were produced on the average between 1980 and 2003 in Nigeria as shown in Table 1. The contribution of maize to total grains produced in Nigeria increased from 8.7% in 1980 to about 22% in 2003. About 561397.29 hectares of Nigerian land were planted with maize, which constitutes about 61% of total cultivable land in Nigeria. The table also shows that the price of maize increased from N2500 in 1980 to N36000/tones in 2003, this means that the price increased more than 14times of the price of 1980. All these data emphasised the importance of maize in the diet and the economy of Nigeria.
Data on economics of horticulture are rare in developing countries. This is partly because horticultural crops are generally cultivated by most farmers as minor crops [2], which could be inter-planted with ‘major’ root and cereals crops in their farms. Okra is well fi tted into cropping system in Nigeria. Farmers grow it under traditional mixed cropping system without considering their adaptability to system and their economic suitability [4].
Cultivations of maize in Nigeria, unlike temperate countries, are planted in intercropping. Intercropping has long been recognized as a common practice among subsistence farmers in the traditional semi-intensive system of agriculture, due to the fl exibility of labour used and less risk. Mixed cropping has been shown to lead to better utilization of land, labour and capital. It also results in less variability in annual returns compared with monocropping [8; 19].
The traditional farmers have reasons of technological, sociological, cultural and socio-economic for insisting on mixed farming. They proved that it is an insurance against crop failure, erosion control, effi cient use of land, stability of yield, risk minimisation, continuous and diversifi ed food supply and higher yields [16; 20; 21;23].
Table 1: The percentage contribution of maize to total grain production in Nigeria in thousand tonnes (1980 - 2003)
YEAR MAIZE TOTALGRAIN % 0F MAIZE AREA PLANTED TO MAIZE (HA) Maize(N/ton) Price of 1985 CPI = 1
1980 612.0 7026.0 8.7 95600 2500 0.41
1981 720.0 7588.0 9.5 982200 3000 0.502 1982 766.0 8108.0 9.4 130600 3000 0.546 1983 594.0 7465.0 8.0 148800 3000 0.673 1984 2,058.0 10719.0 19.2 11200 3000 0.962 1985 1,190.0 10765.0 11.1 211600 3000 1 1986 1,336.0 12149.0 11.0 211700 7000 1.1 1987 4,612.0 15714.0 29.3 211760 7000 1.95 1988 5,268.0 19269.0 27.3 211740 10000 2.98 1989 5,008.0 22432.0 22.3 211740 14000 3.08 1990 5,768.0 19725.0 29.2 211740 3000 3.459 1991 5,810.0 20464.0 28.4 263000 4000 5.068 1992 5,840.0 21590.0 27.1 676000 6000 8.002 1993 6,290.0 21780.0 28.9 693200 5500 11.746 1994 6,902.0 22041.0 31.3 925400 13000 20.177 1995 6,931.0 24776.0 28.0 898600 15500 26.465 1996 6,217.0 24872.0 25.0 912000 20000 28.556 1997 6,285.0 25798.0 24.4 905300 25000 30.565 1998 6,435.0 27082.0 23.8 908660 30000 32.465 1999 6,515.0 27450.0 23.7 908865 35000 34.225 2000 6,491.0 31554.0 20.6 928530 35000 36.177 2001 6,592.0 29988.0 22.0 935300 35000 37.175 2002 6,698.0 30755.0 21.8 940000 35000 39.445 2003 7,019.5 32497.4 21.6 940000 36000 40.02 Average 4664.90 20066.97 21.32 561397.29 14729.17 15.28
Sources : Central Bank of Nigeria, 2003 Ogunsumi, et al (2005).
Official Exchange rate( N135= 1US$)
to reduction of adverse conditions in the ecosystem. Although sole cropping tends to attract fewer types of diseases and insects, they are likely to be present in such quantities as to cause consider able damage. In mixed cropping, a greater variety of diseases and insects are likely to be present but damage may not likely to be acute. Also a denser plant population which usually results from crop mixtures helps to control the incidence of weeds. Mixed cropping may also lead to better soil management because of the fact that may crops overlap in terms of the time they are in the soil. The growing of crop mixtures extends the period of the soil. The growing of crop mixtures extends the period of the year in which the soil is protected by leaf cover and roots. This leaf cover also serves as soil nutrient especially where leguminous
crop is planted along with cereal. The leguminous crop will shed its leaves to produce a little amount of nitrogen back to the soil which stands for next farming operation. Other economic reasons such as dependability of returns and increased returns from the same piece of land may make farmers adopt mixed cropping.
However, the common system is the random mixture where there is no defi nite stand and geometry. In this type, planting is fully at the discretion of the farmer without recourse to standard or recommended spacing for the various crops. This may not allow farmers to enjoy intercropping (mixed cropping) advantages enumerated above[5]. Remison [18] suggested that crops should be planted in proportions and densities that maximize the total yield. This study was therefore designed to determine the relative economic advantage of maize and okra intercrops in systematic planting arrangement in rain forest zone, Nigeria.
MATERIALS AND METHODS (a). Experiment
This study was carried out at the Teaching and Research Farm of Ambrose Alli University, Ekpoma, Edo State, Nigeria. Ekpoma is in the humid rain forest vegetation belt of Nigeria, lying in latitude 60 420 North and Longitude 60
080 East. The soil is loamy sand with a soil P. H of 5.6
and organic content of 2.23% with mean monthly rainfall of 175mm [19].
The experiment which started in the month of June, 2000, was a randomized complete block design. Three planting combinations were used for this experiment. These were sole maize, sole okra, maize/okra. Land preparation was done manually with a total of fi fteen plots marked out. Each plot measured 4m x 3m with 1m between plots and replicates.
The maize cultivar used was the improved tropical zea mays resistant variety with yellow fl int (TZSRY) adapted to the lowland forest and Savanna regions. It is a medium maturing variety. The okra used was NHA474. This is an improved dwarf, early maturing variety.
Maize and okra were sown at one seed per stand, at a spacing of 75cm x 25cm for maize while okra was planted at a spacing of 60cm x 30 cm. In the intercrops, the crops were planted to maintain their original populations in sole stands.
Weeding was done manually thrice at 3, 7, and 11 weeks after plantings (WAP). Fertilizer (NPK 15-15-15) was applied once at 4 WAP. The amount of hours spent on clearing, weeding, fertilizer applications was recorded on plot and treatment basis and converted to man days using equation 1.
Man day =
T
H
(1)Where H = cumulative mean Labour input in hours. T= A time period of 8 hours.
Amount of fertilizer and planting materials were measured and costed appropriately. Harvesting of okra was done as they are matured and the weight was recorded on plot and treatment basis. Maize was harvested after 115 days after planting (DAP), shelled and weight recorded on plot and treatment basis. All yields were converted to hectare and presented in appendix 1a.
(b). Analytical Tool
The most basic tool that agricultural scientist generally employ to evaluate polyculture is the Land Equivalent ratio (LER) [12]. It is calculated as:
LER =
2 2 1 1
M
P
M
P
�
(2)where, P1 and P2 are the yields of two different crops in
polycultures and M1 and M2 are the yields of those of
these crops in monocultures.
Any result over 1 would signify a polyculture advantage; any result below one signifi es a monoculture advantage. The problem with LER is that such calculation does not account for the value of the crops that are being sown [13].
The solution to this problem is provided in calculating Relative Value Total (RVT) of the crop mixtures. Such calculation is relevant for the farmer that has monetary value as his farming goal [22]. RVT is given as
RVT =
i
aM
bP
aP
1�
2(3)
Where P1, P2 Mi are as defi ned in equation (2), a and b are the market prices of crop 1 and 2 respectively.
A slightly more complex but a better measure of economic advantage of intercropping or mixed cropping was given by Moseley [13], termed Replacement Value of Intercropping (RVI). RVI is superior to RVT because it accounts for variable cost in production process. RVI is computed as
RVI =
C
aM
bP
aP
i
�
�
21 (4)
C is the variable costs associated with monocropping. The variables costs (C) in this experiment are labour cost, cost of planting materials and fertilizer. Labour Cost is derived by multiplying man-days in equation 1 with N
N
N250.00, being the daily wage rate in the study area in 2000. Labour cost and other costs are in appendix 1b. Market Prices of maize and okra were also presented in appendix 1c. Equation 2, 3, 4 were used to analyzed the data.
RESULTS
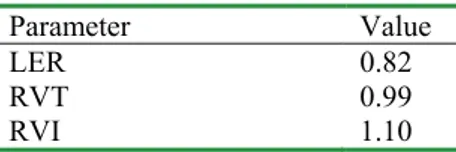
Table 2 shows that Land Equivalent ratio (LER) is 0.82. It means that 82% of the yield on intercrops is monocrops. In other words, the farmers will be using 82% of the land in intercrops of maize or okra to produce the same quantity of maize and okra if they are planted singly. Relative Value Total (RVT) of 0.99 means that the farmers that practiced intercropping of maize and okra will be making 99% of the income of the farmers who are involved in maize and okra monocropping. The relative value of intercropping (RVI) is 1.10, which means that the farmers who planted maize and okra will be making a profi t of 10% more than the farmers who are involved in monocropping of these crops.
Table 2: LER, RVT and Replacement value of Maize and okra inter crops Parameter Value
LER 0.82
RVT 0.99
RVI 1.10
Source: Computed from experimental data
Land Equivalent ratio (LER) of 0.82, means that 82% of the yield on intercrops is monocrops. In other words, the farmers will be using 82% of the land in intercrops of maize or okra to produce the same quantity of maize and okra if they are planted singly. This may be as a result of competition for light and other resources between the plants [17]. Relative Value Total (RVT) of 0.99 means that the farmers that practiced intercropping of maize and okra will be making 99% of the income of the farmers who are involved in maize and okra monocropping. This may be as a result of low yields resulting from the competitions between the crops. Another reason is that if the spacing is too large or too small it may result in lower yields of the intercrops. The relative value of intercropping (RVI) is 1.10, which means that the farmers who planted maize and okra will be making a profi t of 10% more than the
farmers who are involved in monocropping of these crops. This can be accounted for by inclusion of variable costs in computing RVI.
The profi t (gain) of the farmers involved in the intercrops may be increased by reduction in the cost of labour. The labour of moving from one monocrops plot to the other is eliminated. The man-days in weeding of intercrops may be reduced as a result of ability of the companion crops to suppress the obnoxious weeds. Ability of companion crops to reduce spread of weeds has been observed by other scholars [11]. The cost of fertilizer will also be reduced in inter-cropping because of the ability of companion crops to reduce the impact of rainfall and erosion, thereby reducing the nutrient depletion of the soil. The ability of companion crops in restoring soil fertility has been highlighted [17]. Generally, the study strongly indicates that the calculation of LER and RVT are not enough criteria to judge the economic advantages of intercropping. Relative Value of Intercropping should be considered because it connects the farmers to the real world situation, and the cost of production is considered. RVI of intercropping shows that maize/okra intercrops has 10% economic advantage over monocrops, this may be the reason why the farmers are still planting them together. The economic implication of this study is that any strategy that reduces cost of production in maize/ okra intercrops will increase its profi tability and attractiveness to farmers. Such policies as price support and subsidizing of inputs are example of such strategies. However, more researches should be carried out, using different planting arrangements, so that the appropriate planting spacing that will maximize the economic advantages of the intercropping of the maize/okra can be recommended to the farmers.
REFERENCES
1. Adekunle, O.A. and Nabinta, R.T. Indigenous Storage Structure Of Cereals, By Women Farmers In Kaltungo Area of Gombe State, Nigeria. Journal of Rural Economics and Development(2000) 14(1):47-54.
2. Adeniyi, O.R. An economic evaluation of intercropping tomato with okra in rainforest zone of Nigeria. The Journal of Horticulture Science and Biotechnology(2001) 76(3): 347-349.
3. Ajibefun, I.A., Battese, G.E., Daramola: Determinants Of Technical Effi ciency In Smallholder Crop Farming In Oyo State. Nigeria. Quarterly Journal of International Agriculture(2002) 41(3):226-240.
in Nigeria(2004). www. tropentag.de /2004/abtracts/ full/143.pdf
5. Alabi, R.A. and P. O. Onolemhemhen Relative Economic Advantage of Maize-Soybean Mixed Cropping. Nigerian Journal of Agric-business and Rural Development (2001) 2(1): 13 - 21.
6. Anselm, A.E., Nweke, F. I. and Tollens E. Determinants of Cassava Cash Income in Female Headed Households of Africa. Quarterly Journal of International Agriculture(2002) 41(3):241-284.
7. Ayeni, A.O. Maize production in Nigeria: Problems and Prospects. Journal of Food and Agriculture (1991) 2:123-129.
8. Eneh, F. K. Onwubuja, I. I. and Inedia. The Economics of Intercropping Young Oil palms with Maize and Cassava. Nigeria Journal of Palms and Oils Seeds (1997) 13: 11-21.
9. FAO. FAO 1988-1989 Production Year Book .Statistical Series(1989) 142 (85) :159-172.
10. Jain, S.K. and Singh, P. S. Economic Analysis of Industrial Agroforestry in India. Agroforestry Systems(2000) 49: 255-273.
11. Kumar, V., Ogunlela, V. B. and Yadav. Production of Maize and Associated Intercrops in Relation to bed Confi guration and Planting. Samaru Journal of Agricultural Research (1987) 5(1): 97-108.
12. Mead, R. and Rilley, R.W. The Concepts Of Land Equivalent Ratio And Advantages In Yield From Intercropping. Experimental Agriculture(1980) 16: 27-228.
13. Moseley, W.G. An Equation for the Replacement value of Agroforestry. Agroforestry Systems (1994) 26:47-52.
14. Nweke, F. New Challenges In The Cassava Transformation In Nigeria And Ghana. EPTD Discussion Paper No. 118. Environment And Production Technology Division(2004) .International Food Policy Research Institute 2033 K Street, NW. Washington, D.C. 2006 USA.
15. Ogunsumi, L.O, S.O. Ewuola and A. G Daramola. Socio-economic impact assessment of maize production technology on farmers’ welfare in Southwest, Nigeria. Journal of Central European Agriculture ( 2005) .6 (1): 15-26
16. Perin, R.M. Pest Management in Multiple Cropping Systems. Agro- ecosystems (1977) 3:93-118.
17. Remison, S.U. Introduction Between Maize And Cowpea At Various Frequencies. Journal of Agric. Science(1980) 94: 617-621.
18. Remison, S.U. Interference between Crops Grown In Binary Combinations In The South West Zone Of Nigeria. Nig. Journal of Agric(1991) 26:59-72.
19. Remison, S.U and O.P Onelemhemhen. Effect Of Maize, Okra And Rice Intercropping With Soybean On Grain Yield In A Humid Tropical Environment. Nigerian Journal of palm and oil seeds(1999) 14: 169-175.
20. Steiner, K.G. Intercropping In Tropical Smallholder Agriculture With Special Reference To West Africa. Germany, German Agency for Tech. Coop (GTZ) (1982)
21. Uvah, I.I. Crop diversity and Management. Nigerian Journal of Entomology(1992) 5:5-11.
22. Vandermeer. The Ecology of Intercropping. Camb. Uni Press, New York.( 1989) 129.
23. Willey, R.W. Intercropping- It’s importance and Research Needs: Competition and Yield Advantages. Field Crop Abstracts (1979) 32: 1-10.
Appendix 1a: Yield Parameters Treatments Yield (hg/ha) Sole Maize 4052
Sole Okra 1558.50 Maize/Okra
(maize) 3117 Maize okra (Okra) 1491
Source: Computed from experimental data.
Appendix 1b: Variable Cost Associated With Monocrops.
Cost Amount (N) /ha
Fertilizer 4000 Labour 3750 Planting Materials 5600
Total N13350
Source: Calculated from Experimental data
Appendix 1c: Market Prices of Maize and Okra.
Items Price (N/kg)
Maize 25
Okra 15