Study on Minimum Shear Reinforcement of Reinforced
Concrete Flat Slabs
Estudo sobre Armadura Mínima de Cisalhamento de
Lajes-Cogumelo de Concreto Armado
A. P. R. VAZ a
R. B. GOMES b
L. C. D. SHEHATA c
© 2009 IBRACON
a Saneamento de Goiás S/A, SANEAGO, [email protected], Avenida Fued JoséSebba 570, Jardim Goiás, Goiânia, Goiás, GO, CEP 74805-100 b Escola de Engenharia Civil, Universidade Federal de Goiás, UFG, [email protected], Praça Universitária s/n., Setor Universitário, Goiânia,
Goiás, GO, CEP 74605-220
c Escola de Engenharia, Departamento de Engenharia Civil, UFF, [email protected]; COPPE-UFRJ, [email protected], Caixa Postal 68506,
Rio de Janeiro, RJ, CEP 21945-970
Received 08/08/2008. Accepted 20/02/2009. Available Online 03/04/2009
Abstract
Resumo
In a preliminary study that aims to deine the minimum shear reinforcement of lat slabs that, leading to a punching shear failure surface that crosses that reinforcement, can avoid a sudden failure, nine slabs with 1800 mm x 1800 mm x 130 mm dimensions were tested. Their main variables were the number of shear reinforcement layers of the stud type, the cross-section area of that reinforcement in each circumferential layer and the diameter of the studs. In the attempt to deine the minimum punching reinforcement of the slabs, a parameter κ, equal to the total force in the transverse reinforcement inside a truncated cone bounded by the shear crack divided by the punching strength of a similar slab without shear reinforcement, was used. The values of κ of the slabs varied between 0.27 and 1.03 and the punch
-ing failure surface crossed the shear reinforcement when κ was smaller than around 0.70. The value of κ equal to 0.6 was deined as close to the minimum for slabs with effective depth of 90 mm and lexure reinforcement ratio of 1.38%. In comparison with the slab with no shear reinforcement, slabs having κ of that order had a punching strength and rotation increase of about 10% and 30%, respectively.
Keywords: lat slabs, minimum shear reinforcement, reinforced concrete
Dando início a estudo que visa deinir a armadura transversal mínima de lajes-cogumelo de concreto armado que, levando a uma superfície de ruptura por punção atravessando essa armadura, pode evitar uma ruptura brusca, foram testadas nove lajes de dimensões 1800 mm x 1800 mm x 130 mm. Suas principais variáveis foram o número de camadas de armadura de cisalhamento do tipo studs, a área dessa armadura em cada
camada circunferencial e o diâmetro dos studs. Na tentativa da deinição da armadura mínima de punção das lajes, utilizou-se o parâmetro κ, igual
à força total da armadura transversal situada dentro de tronco de cone de ruptura delimitado pela issura de cisalhamento dividida pela resistência à punção de laje semelhante sem armadura de cisalhamento. Os valores de κ das lajes variaram de 0,27 a 1,03 e ocorreu superfície de ruptura cruzando as camadas de studs quando κ foi menor que cerca de 0,70. Deiniu-se o valor de κ igual a 0,6 como próximo daquele mínimo para lajes com altura efetiva igual a 90 mm e taxa de armadura de lexão de 1,38%. Para as lajes com valor de κ dessa ordem, em relação à laje sem armadura transversal, os acréscimos de resistência à punção e de rotação foram, respectivamente, cerca de 10% e 30%.
Study on Minimum Shear Reinforcement of Reinforced Concrete Flat Slabs
1. Introduction
The use of lat slabs in concrete structures has become common
-place in recent years, due to the reduction in execution time and costs as well as the lexibility of use of constructed spaces it provides. In the region of slab-column connections of these slabs, there are stresses that may cause failure by punching with load below that of lexural failure. Shear reinforcement is generally used in this region aiming at increasing the strength and the ductility of the slabs and one of the types of this reinforcement is the one consisting of studs. The objective of the experimental study described here was to pro -vide an initial contribution towards the establishing of the minimum
transverse reinforcement for reinforced concrete lat slabs, of the stud kind, that, leading to a punching failure surface that crosses
this reinforcement, prevents from a sudden failure. The main
vari-ables considered in the study were the number of shear reinforce
-ment layers, the cross-section area of this reinforce-ment in each layer and the diameter of the studs.
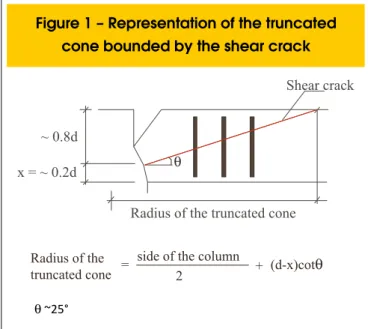
In the attempt to deine that minimum reinforcement, it was used the transverse reinforcement index κ = (Aswfyw)ef./PuLref, where (A s-wfyw)ef is the total force in the transverse reinforcement inside an
assumed failure truncated cone and PuLref. is the failure load of the
reference slab, without shear reinforcement. Figure 1 shows the
shear crack which bounds the failure truncated cone [1]. Although PuLref may be calculated using formula of any code of practice ad
-opted, in the presented analysis it was chosen to consider for that load the experimental value obtained.
2. Experimental programme
2.1. Characteristics of the slabs and test method
The main variables of the 9 slabs tested were: n Number of shear reinforcement layers (2 to 4)
n Cross-section area of shear reinforcement in each layer,
that deined the number of reinforcement lines (4 to 8)
n Diameter of the studs (4.2 mm and 5.0 mm)
The slabs were split into two groups. Group 1 had the number of lines
(8) and the transverse reinforcement area per layer (157 mm2)
con-stant, and the number of transverse reinforcement layers was varied (2, 3, or 4). These slabs, together with those that had internal punching failure, tested by other authors, led to the deinition of the numbers of layers and lines of the transverse reinforcement and also of the diam
-eter of this reinforcement of the slabs in Group 2. All slabs in this group had 3 transverse reinforcement layers, varying the number of lines (4, 5, or 6) and the reinforcement area per layer (55.4 mm2, 69.3 mm2 or
83.1 mm2), that was always smaller than that adopted in Group 1 slabs
as a punching failure surface crossing this reinforcement was intended. Figure 2 and Table 1 show the characteristics of the tested slabs.
The load was applied upward to the bottom from a jack located at the centre of the slab and a metallic plate with a 150 mm diameter
circular cross-section simulated the column. The reaction to
load-ing was made by a set of metallic beams anchored in the strong loor and supported on eight steel plates, positioned between the metallic beams and the slab under study, 825 mm away from the centre of the slab (Figure 3).
The measurement of the displacements on the upper face of the slab was made with dial gauges and displacement transducers (linear potentiometers). Measuring points were distributed on a
straight line over the slabs in x and y directions (Figure 4). For the measurement of the strains in the lexural and shear reinforcement
resistance strain gauges were used.
The measuring of the applied load was made by a load cell con
-nected to an automatic data acquisition system. Load values were increased in steps of around 10 kN, 20 kN or 25 kN, until the failure load, deined as being the highest load recorded during the test.
2.2. Materials
The CA-50 steel bars used in the lexural reinforcement had 6.3 mm and 12.5 mm diameters. For shear reinforcement, CA-60 steel bars with 4.2 mm and 5.0 mm diameters were used. In order to obtain their mechanical properties, four samples of each type of bar were tested. The average values of yield stress and tensile strength obtained were, respectively, 708 MPa and 725 MPa (4.2 mm), 624 MPa and 757 MPa (5.0 mm), 594 MPa and 714 MPa (6.3 mm), 555 MPa and 673 MPa (12.5 mm).
The concrete mix design aimed a 28 days compressive strength of 35 MPa. During each concrete casting cylindrical specimens were moulded for the compression, tensile and modulus of elasticity
tests. The mean values obtained in the specimens related to the
irst and second concreting were, respectively: 38.0 and 38.5 MPa for compression strength, 3.28 and 3.56 MPa for splitting tensile strength, and 21.6 and 25.3 GPa for modulus of elasticity.
3. Results and discussion
3.1. Failure load and mode and shear
reinforcement index
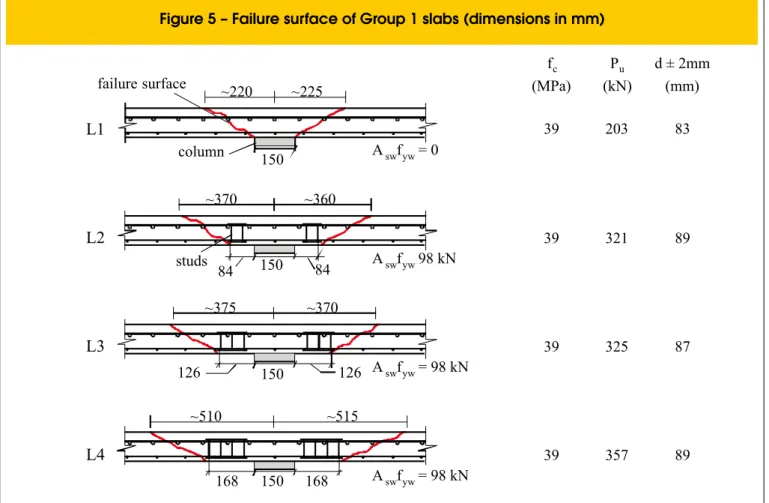
The failure load and mode of the tested slabs, together with the
shear reinforcement index, are shown in Table 2. All slabs had a
punching failure. From the slabs with transverse reinforcement, those of Group 1 had a punching failure surface outside the shear
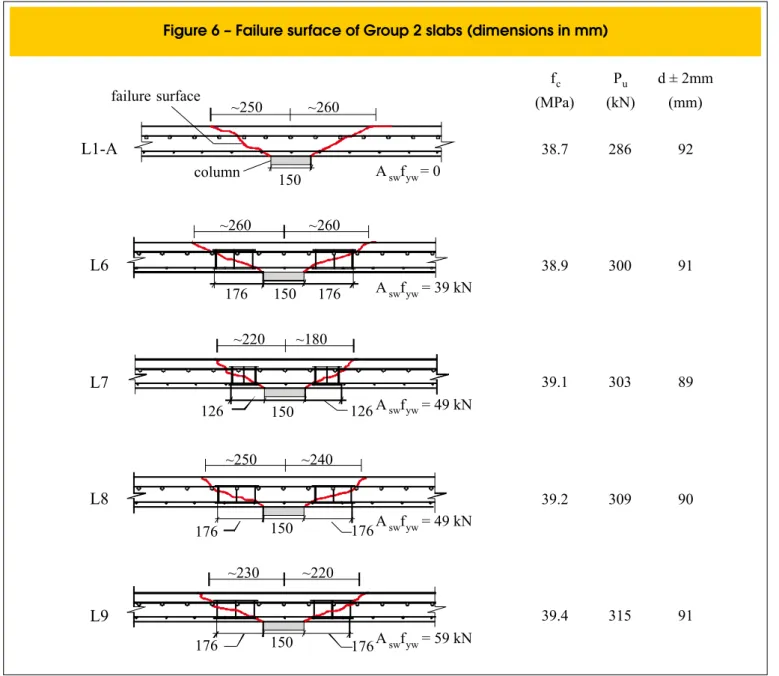
reinforcement region (Figure 5) and those of Group 2 had punch
3
IBRACON Structures and Materials Journal • 2009 • vol. 2 • nº 1
L1-A were between 12% and 25% and in Group 2, these increments ranged from 5% to 10%. Slab L1-A was considered as a reference
in the two groups as its strength was closer to the results from similar
2 show that not all reinforcement layers are inside the assumed
truncated cone.
5
IBRACON Structures and Materials Journal • 2009 • vol. 2 • nº 1
slabs in previous works ([2] and [3]), and its effective depth was more similar to the one of the other slabs tested in this work.
Figure 7 shows the values of Pu/PLref as a function of the κ index for the
slabs of this and other studies that had the same kind of reinforcement ([2], [3], [4] and [5]), where PLref. is the failure load of the reference slab
in each study. Slabs L2, L10 and L11 tested by Gomes [5] had punch
-ing failure surface cross-ing the shear reinforcement region. Slab L3
had two failure surfaces, one crossing the shear reinforcement
re-gion e other immediately outside that rere-gion. Slab L9 showed signs of lexural failure with yielding of almost all bending reinforcement, great
rotations and some concrete crushing in the compressed region.
Fig-ure 7 suggests that κ values until around 0.7 lead to punching failFig-ure surface crossing the transverse reinforcement region, while higher κ
values cause punching failure surface outside this region.
3.2. Vertical displacements and rotations
For loading levels over 100 kN, the vertical displacements varied al
-most linearly in relation to the distance to the centre of the slab and
the highest values were found in the central region, where the load
was applied. As a result of that, the rotation of slab ψ, in radians, was obtained dividing the vertical displacement at the centre of the slab by
the distance from this point to the circumference that passes through
the centres of the support plates, with 825 mm radius.
Figure 8 shows the graphs of vertical displacement for two slabs
(one without and one with transverse reinforcement) as a func-tion of the distance to the centre, for different load values, while Figure 9 presents the central vertical displacements of the slabs
as a function of the load. In Figure 8 one can see that the displace
Study on Minimum Shear Reinforcement of Reinforced Concrete Flat Slabs
in all slabs, and in Figure 9 it is noticed the behaviour differential between slabs of groups 1 and 2.
Figure 10 presents the values for ψu/ψLref as a function of κ for the slabs
tested in this and in other works that had the same type of reinforce
-ment, where ψLref is the rotation of the reference slab of each work car
-ried out. In the case of the slabs in Group 2 of this study, ψu and ψLref
refer to the failure load, while in the other cases they refer to a load near to the ultimate one (from around 85% to 95% of the failure load). The highest values of these relations for the slabs tested by Gomes [5] suggest that they depend on the effective depth of the slab that, in these slabs, was around 160 mm.
3.3. Strains
a) Flexural reinforcement
The highest strain values in lexural reinforcement were found in the cen
-tral region of the slabs. Flexural reinforcement of Group 1 slabs reached yielding with a load near 200 kN and, in the slabs with transverse rein
-forcement, the region where there was yielding of the lexural reinforce -ment included that outside the shear reinforce-ment (Figure 11, slab L2).
In Group 2 slabs, the yielding of the longitudinal reinforcement did not oc
-cur in all the slabs and, in those where there was yielding, this took place in the loading region and for a load around 250 kN (Figure 12, slab L8).
b) Shear reinforcement
The shear reinforcement strains of the slabs that had punching
failure surface crossing the layers of studs (L6, L7, L8 and L9)
were higher than those of the slabs with punching failure surface
outside these layers (L2, L3 and L4), reaching the yielding strain. In the shear reinforcement strains graph of slab L9 (Figure 13) it can be seen that they were greater for the studs located nearer the
loading region, which was also found in the remaining slabs.
3.4. Cracks
Radial cracks were the irst ones to be visually noted, for a load between 45 kN and 55 kN. The irst radial crack appeared with 19% of the failure load for the L1-A, with around 14% of the failure
load for the slabs with shear reinforcement in Group 1, and with
around 16% of the failure load for the slabs of Group 2 with studs. At the time the irst radial cracks appeared, the obtained strains at the points of lexural reinforcement monitored were below 0.35 mm/m in the slabs with punching failure surface outside the region of shear reinforcement and below 0.20 mm/m in those with punch -ing failure surface inside this region.
For a load between 75 kN and 100 kN, the circumferential cracks appeared in all slabs and, from this load level on, the
elements of the shear reinforcement started to show bigger
strains. The circumferential cracks appeared under 26% of the failure load for slab L1-A, under around 22% of the failure load
for the slabs with shear reinforcement of Group 1, and under
33% to 40% of the failure loads for the slabs of Group 2 with
7
IBRACON Structures and Materials Journal • 2009 • vol. 2 • nº 1
3.5. Evaluation of the shear reinforcement index for
slabs with punching failure crossing the layers
of studs.
Several variables may affect the failure load and the rotation of reinforced concrete lat slabs such as the lexural reinforcement
ratio, effective depth, compressive and tensile strength of the
con-crete, perimeter of the loaded area, existence of holes, etc. Table 3 shows the relations between the rotations (ψu/ψL1-A) and
loads (Pu /PL1-A) of each slab tested as a function of the shear
rein-forcement index κ. It is possible to see that there is a tendency of the rotation and the load decreasing when the κ index decreases.
The highest increases in rotation and in failure load occurred in the
slabs L4 and L3, with the highest shear reinforcement index (κ = 1.03). The smallest increases in rotation and failure load occurred in slab L6, with the smallest shear reinforcement index (κ = 0.27).
The slabs with punching failure surface external to the shear reinforce
-ment layers (Group 1) showed, in relation to slab L1-A, rotation incre
-ments of at least 46% and failure load incre-ments of at least 12%. In
slabs with punching failure surface crossing the region of shear
rein-forcement (Group 2) these increments were of at least 8% and 5%, respectively. Slab L6, with the smallest number of lines (4) of shear re -inforcement, angle between lines of 90º and radial spacing between lay
-ers of 67 mm, presented the smallest increases for rotation and load. Slab L9, with index κ=0.41 presented a rotation increase of 29%, nearly the same of L7 (30%) with κ=0.51, and one load increase equal to 10%, higher than that of L7 (6%). The radial distance be
-tween the layers of the studs in slab L9 was equal to that of slabs L6 and L8 (~0.75d) but, due to its number of lines of six, higher
than that of the remaining slabs of Group 2, the circumferential
Study on Minimum Shear Reinforcement of Reinforced Concrete Flat Slabs
that of slabs L6 (~3.95d) and L8 (~3.28d).
Comparing the behaviour of slabs L7 and L9 one inds that the circum
-ferential spacing does not seem to have a signiicant inluence on the increase of rotation (near 30% for the two slabs). However, the number of lines of shear reinforcement in slab L9 (six) higher than that of slab L7 (ive) may have caused its highest gain in failure load (L9 = 10%, L7 = 6%) in spite of its larger radial and circumferential spacing values. These results and those from other authors (Figures 7 and 10) indicate the possibility of deining a minimum shear reinforcement considering a value of κ around 0.6. For slabs with effective depth
and other characteristics similar to those of the slabs tested in this
study and κ of this order, there should be a gain in failure load of around 10% and a gain in rotation of around 30%. The slabs tested by Gomes [5] suggest that these increments are greater in slabs
with a higher effective depth.
4. Final considerations
The results of this and other works that are more detailed by Vaz [6] indicate that the minimum shear reinforcement to avoid the
sudden failure showed by lat slabs without this reinforcement can be deined from the parameter κ adopted here. The results of the analyzed tests point out that the value of κ corresponding to the minimum reinforcement should be around 0.5 to 0.7. However, ad -ditional studies are needed given that the increase of the failure
load and rotation related to a certain value of κ probably depends on the effective depth, radial and circumferential spacing and lay -ers of the shear reinforcement of the slab.
5. Acknowledgements
To companies: Carlos Campos Consultoria Limitada; Compan
-hia Siderúrgica Belgo-Mineira; Perinasa – Perilados, and Ferros Nossa Senhora Aparecida Ltda; Realmix – Concreto and Arga
-massa for their cooperation in supplying several materials and in the execution of characterization tests. To CNPq and PROCAD/ CAPES for their inancial support.
6. References
[01] GOMES, R.B. and REGAN, P.E. Punching resistance of RC lat slabs with shear reinforcement. Journal of Structural Engineering, EUA, v. 125, n.6, p. 684-692, June 1999.
[02] SILVA, J.A. Punção em lajes cogumelo: pilares
retangulares, furos e armadura de cisalhamento.
Dissertation (Master in Civil Engineering). Universidade Federal de Goiás, Goiânia, Goiás, 2003. [03] MUSSE, T.H. Punção em lajes cogumelo – ibras de
aço e armaduras de cisalhamento. Dissertation
(Master in Civil Engineering). Universidade Federal de Goiás, Goiânia, Goiás, 2004.
[04] BORGES, L.L.J. Comportamento ao puncionamento
de lajes cogumelo de concreto armado com pilares retangulares e furos de grandes dimensões. Thesis
(Doctorate in Structures and Construction), Publication E.TD-002A/04, Universidade de Brasília, Brasília, DF, 2004.
[05] GOMES, R.B. and REGAN, P.E. Punching Strength
of slabs reinforced for shear with offcuts of rolled
steel I section. Magazine of Concrete Research, v. 51, n. 2, p. 121-129, 1999.
[06] VAZ, A.P.R., Resistência à punção em lajes
cogumelo de concreto armado: uma contribuição
![Figure 7 shows the values of P u /P Lref as a function of the κ index for the slabs of this and other studies that had the same kind of reinforcement ([2], [3], [4] and [5]), where P Lref](https://thumb-eu.123doks.com/thumbv2/123dok_br/18859459.417657/5.892.67.442.175.569/figure-shows-values-lref-function-index-studies-reinforcement.webp)