In this paper a numerical analysis of three-pile caps is developed to study the inluence of concrete compressive characteristic strength in pile caps resistance capacity. A three-pile cap model derived from Miguel’s [1] work was adopted. From this model, variations on the compressive charac-teristic strength were made in order to observe modiications in its structural behavior. The numerical analysis was developed with inite element software ATENA 3D [2]. The results demonstrated that an increase in the compressive characteristic strength was not followed by a signiicant increment in pile cap’s strength, since models’ ruin were due to concrete splitting (opening cracks parallel to principal compressive stresses as a result of perpendicular tension stresses within the structure) and ties steel bars yielding. In the models analyzed high-tension stresses were developed along the struts and at the bottom of the pile cap’s section, demonstrating that pile cap’s ultimate resistance is not inluenced by the compressive strength.
Keywords: pile caps, inite elements, reinforced concrete, foundation.
Este trabalho tem por objetivo realizar uma análise numérica da inluência da resistência característica à compressão do concreto (fck) em blocos sobre três estacas. Para tanto, foi utilizado um modelo-padrão de bloco sobre três estacas originalmente desenvolvido por Miguel [1]. A partir deste modelo foram realizadas variações na resistência à compressão do concreto de modo a se observar modiicações no comportamento estru-tural do elemento. A análise numérica é desenvolvida por meio de programa de computador baseado no MEF. Os resultados demonstraram que o aumento do fck não provocou um aumento signiicativo da resistência do bloco, visto que a ruína dos modelos ocorreu devido ao fendilhamento (desenvolvimento de tensões de tração perpendiculares às bielas comprimidas) e escoamento da armadura dos tirantes. Nos modelos analisa -dos desenvolveram-se tensões de tração elevadas ao longo das bielas e na seção inferior do bloco, demonstrando que a resistência última -dos blocos não é função da resistência à compressão.
Palavras-chave: blocos de concreto, elementos initos, concreto armado, fundação.
Concrete compressive characteristic strength analysis
of pile caps with three piles
Análise da resistência característica à compressão
do concreto em blocos sobre três estacas
T. E.T. BUTTIGNOL a [email protected]
L.C. ALMEIDA b [email protected]
a Mestre em Estururas pela Faculdade de Engenharia Civil, Arquitetura e Urbanismo da Universidade Estadual de Campinas – [email protected] Rua Capitão José de Sousa, 118 – Centro – Campinas-SP – Brasil
b Professor Doutor do Departamento de Estruturas da Faculdade de Engenharia Civil, Arquitetura e Urbanismo da Universidade Estadual de Campinas [email protected] – Campus Zeferino Vaz – Av. Albert Einstein, 951 – Campinas-SP – Brasil
Received: 07 Aug 2012 • Accepted: 29 Oct 2012 • Available Online: 08 Feb 2013
Abstract
1. Introduction
Pile caps are an important structural element which transmits forc -es of the superstructure to the infrastructure. According to Fusco [3], pile cap’s structural behavior must be suficiently rigid to allow that its deformations do not affect the superstructure stresses nei-ther the onsite foundation.
In the last decades, great advances in this area were achieved with the development of the struts and ties model to describe pile cap’s structural behavior. Since 1980’s, inite element software’s evolution and structural monitoring allowed a deeper knowledge of pile caps inner stresses and, hence, allowed the development of less conservative and more realistic design models. Nowadays, it is possible to analyze pile caps’ behavior in detail, observing stress low in the struts and ties, crack pattern, plastic strains, among other relevant aspects.
Studies in this ield have proved that the struts and ties model is the best representation of the structural behavior of pile caps. The struts and ties theory is the result of Blévot e Frémy’s [4] pioneer work, which framework was the observation that most of the pile caps ruin were due to a brittle collapse as a result of concrete splitting. Adebar et al. [5] and Miguel [1] researches proved pile caps col-lapse due to concrete splitting as a result of compressive stresses expansion (cracking increase with concrete collapse) followed by ties yielding.
Delalibera [6], through a statistical analysis of variance, deter -mined four main variables that inluence in the pile cap’s struts stress low and load bearing capacity, which are the column and piles cross-section dimensions, external vertical load eccentricity and pile caps height. In addition, through experimental and numeri -cal models, [6] proved that the pile caps structural behavior is inlu-enced by column and piles cross-section dimensions, struts angle, pile caps height and existence or not of splitting reinforcement. In reference to pile caps design, most design codes recommend deep beams, bending or truss models. In spite of that, pile caps are volume structures that present discontinuity zones due to the non-dissipation of local disturbances and, therefore, Bernoulli’s hypoth -esis is not applied. In this particular case, Saint Venant principle is applied. In pile caps, tensions are not uniform due to stresses con-centration in the superior and inferior nodal zones which generates a discontinuity zone (D-region) in all the elements. According to
Fusco [3], struts and ties model should be adopted to the elemen-tary treatment of stresses distribution in the regularization zones of structures subjected to Saint Venant principle. Thus, bending theory and linear models do not correctly represent the behavior of pile caps.
Su and Chandler [7] noted the lack of an established design mod -el. The authors afirmed that, in the last decades, struts and ties
model has been one of the most popular and rational methods of structural analysis not submitted to bending. And the main design directives were given by national codes such as the Canadian [8], Australian [9] and Neo Zeland [10] Standards and the CEB-FIP. In the CEB-FIP:1973 [11] the procedures for the design of pile caps are described and in the ib-Model:2010 [12] design procedures are prescribed for structures or elements with discontinuities using struts and tie models.
Despite that, each of the design code has its own safety factors and different design methodologies. Brazilian ABNT NBR 6118:2007
models in relation of linear and non-tridimensional ones. The refer-ences largely adopted in Brazil, according to Ramos [14] are the strut and tie model and the CEB-FIP code.
Clarke [15] observed that ties bars anchorage is positively inlu -enced by struts conining action, which would dispense the use of hooks. Studies conducted by Rausch et al. [16], Miguel [1] and Delalibera [6] demonstrated that ties stresses are not constant, oc -curring a signiicant reduction in the inferior nodal zones. More -over, at the border of the ties the strains are close to zero. Buttignol [17] has shown, through numerical analysis in pile caps with two and three piles, that the ties stresses are not constant through the bars and, at their borders, stresses were very low, dispensing the use of hooks.
In addition, adherence is not a determinant factor to pile cap’s ul-timate strength capacity, since ties bars slipping occur after pile cap’s collapse. Clarke’s [15] experimental results have shown that ties bars without hooks slipped only after the crushing of the struts. Finally, splitting reinforcement can contribute to the increase of pile cap’s ultimate strength capacity and to the control of cracking. Butt-ignol [17] analyzed numerical models with splitting reinforcement (steel bars disposed perpendicular to the struts in order to combat tensile stresses and to resist concrete splitting) as proposed by [6], demonstrating an increase in pile cap’s resistance, which pre-sented high strains in the struts cross-section as a result of tensile stresses action within this region.
1.1 Justiication
Despite the advances on pile cap’s research in the last decades, an analysis about the inluence of the concrete compressive char -acteristic strength in the structural behavior of pile caps is still needed. There are few references about this matter which are con-centrated in beams analysis.
According to Delalibera [6], an increase in pile cap’s stiffness in -creases the element strength capacity. And the collapse of rigid pile caps occurs by concrete splitting followed by struts crushing. Therefore, it is preferable to increase pile cap’s height (stiffness increment) than to increase concrete compressive strength. Through numerical modeling of three-pile caps using the inite ele -ment software ATENA 3D, this paper demonstrates that the varia-tion on the concrete compressive strength (fck) is not followed by a signiicant gain in pile cap’s resistance. Moreover, high tensile stresses were observed within the struts and in the nodal zones. These results highlight the fact that in the case of a necessary increase in the ultimate strength capacity of pile caps, a simple increase in the concrete compressive strength will not result in a consistent beneit. To obtain an increase in the load bearing capac -ity, it will be necessary to adopt one of the hypotheses brought by [6] and cited before.
To sum up, this paper has the merit of bringing to light a fundamen-tal property of pile cap’s behavior, which must be taken in account by designers and constructors.
2. Analysis method
2.2 Numerical analysis
The software ATENA 3D [2], which has its main architecture based on the inite element theory and tridimensional non-linear analysis of reinforced concrete structures, was used to develop the numeri -cal analysis. The ultimate load is -calculated by an integer in time of force increments, applying the Arc-Length or Newton-Rhapson methods. To determine the structural behavior of the deformed structure either the Lagrange or the Euler formulation is used. the column’s cross-section projection, as shown in Figure 1. The
pile caps analyzed were originated from [1] research. All original geometric, materials characteristics and reinforcement conigu -ration were maintained, varying only the concrete compressive strength. In total, three pile caps with three piles with different concrete compressive strength (fck) were modeled, as shown in Table 1.
2.1 Geometric model and reinforcement disposal
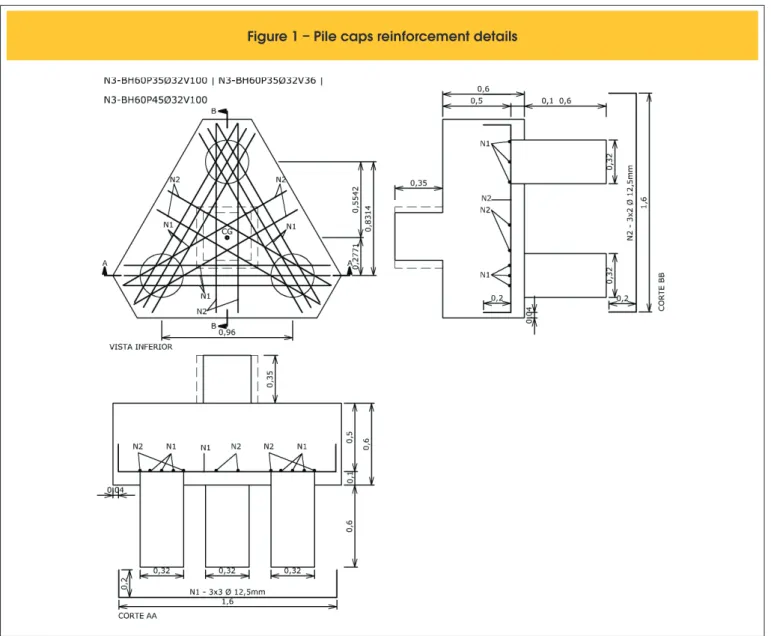
The pile caps have a prismatic shape with 60 cm height. The columns are rectangular with 35 cm height and 25 cm x 25 cm cross-section. The piles are cylinders with 32 cm diameter and 60 cm height. The pile cap’s reinforcement has principal ties (bars with hooks dis-posed above the piles and parallel to the sides of the pile cap) and complementary reinforcement passing through the cross-section pro-jection of the column, as shown in the Figures 1 and 2. The column reinforcement have eight bars with 12,50 mm diameter and stirrups with 6,30 mm diameter, spaced with 10,0 cm, as shown in Figure 3.
Figure 1 – Pile caps reinforcement details
Table 1 – Numerical models analyzed
Model 1
Pile cap with
f = 30 MPa
ckModel 2
Pile cap with
f = 35 MPa
ckModel 3
Pile cap with
2.3 Materials speciications
A non-linear elastic-plastic behavior was assumed for the concrete, according to the characteristics shown in Table 2.
The concrete behavior, in the elastic regimen, follows Hook’s Law which establishes linear relations in the stress-strain ield. In the post-cracking stress regimen, structure’s collapse plane is deter-mined by Drucker-Prager (in compression) and Rankine criteria (in tension).
The Speciic Fracture Energy (Gf), determined by the Equation 1,
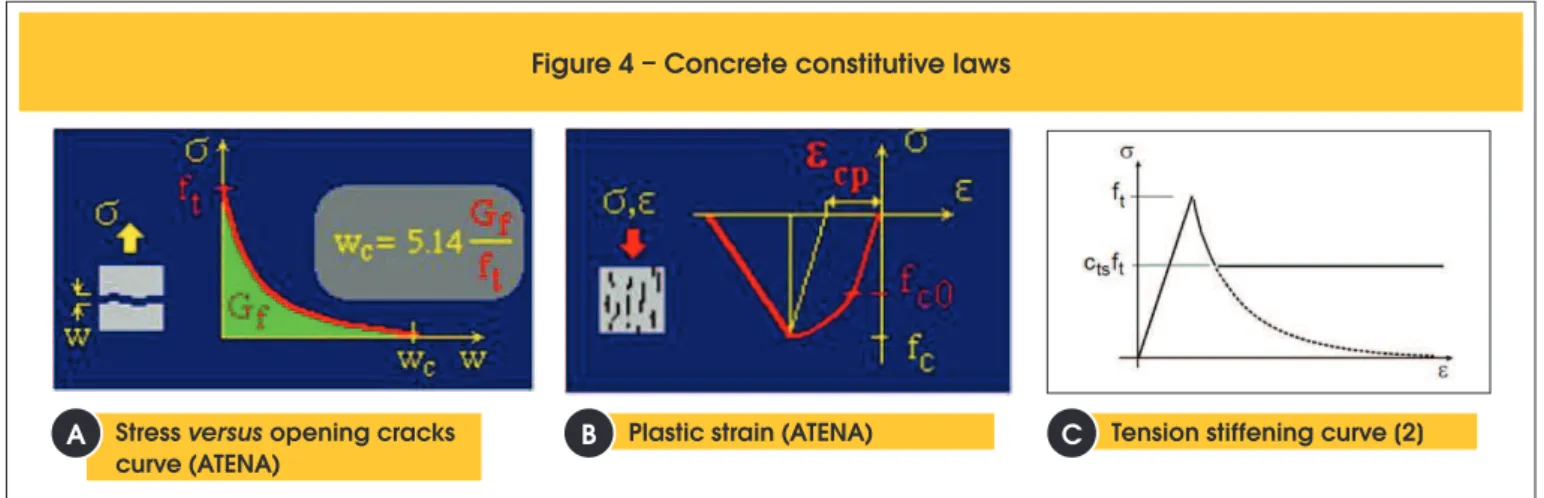
was originally proposed by Irwin [18] and corresponds to the tax relief of the potential energy stored in the system. Nowadays, this is an essential parameter of concrete structures numerical simula-tions, allowing the development of more sophisticated modeling forms. Its value corresponds to the internal area of the tension ver-sus crack opening graphic shown in Figure 4a.
(1)
tf
c
f
G
w
5
,
14
�
The software also considers the plastic strain effect in concrete, as shown in Figure 4b, and the tension stiffening effect, which is the concrete tension stress limit value that contributes to limit the crack expansion, increasing the structural stiffness. Its value is deter -mined by the tension stiffening factor (cts), as shown in Figure 4c. A perfect elastic-plastic behavior was assumed to the reinforce -ment, with the properties shown in Table 3. The steel yielding crite-rion was based on the von Mises deinitions.
An elastic-isotropic material was assumed for the steel plates of the piles supports and for the columns superior cross-section, as speciied in the Table 4.
The numerical analysis is divided in three main parts, the pre-pro-cessing, the processing and the post-processing. In the pre-pro -cessing, the geometric shape of the structure is deined, with the reinforcement, the external load, the supports, the inite element mesh, the monitoring points and the analysis method (Newton-Rhapson or Arc-Length). In the processing, the numerical analysis is executed and the loading (increments of force) and reactions (stresses, strains and cracking) are monitored. In the post-pro -cessing, the results are analyzed with auxiliary graphic elements that show the structural behavior in different angles and situations.
Figure 2 – Piles reinforcement details
Figure 3 – Column's reinforcement detail
Table 2 – Concrete properties
Properties
Pile caps
Piles and
columns
Poisson’s
ratio (
)
0,2
0,2
Especific
fracture
energy (G )
f2
70,18 J/m
120,5 J/m
2Modulus of
elasticity (E )
c34,03 GPa
43,69 GPa
Concrete
compressive
strength (f )
ck30 MPa (Model 1)
35 MPa (Model 2)
40 MPa (Model 3)
76,50 MPa
Ultimate
concrete
tensile
strength(f )
tk2,58 MPa (Model 1)
2,86 MPa (Model 2)
2.4 Analysis method
The Newton-Rhapson method was adopted in the numerical analysis, with a uniform load at the top of the column’s cross-section and force increments of 50 N/cm2. For the elements, a tetrahedral finite element mesh was adopted as shown in Figure 5, since the pile caps have a cylindrical mesh and AT -ENA software only generates hexahedral forms for prismatic elements.
The structure’s load and displacement monitoring points were ixed
respectively in the center of the column’s superior cross-section and in the center of the pile cap’s inferior section.
The piles vertical movement was restricted in all of their inferior cross-section as shown in Figure 5. In the contact-faces of the pile cap with the piles and with the column, a 3D element interface based on Mohr-Coulomb criterion was adopted, as shown in the table 5.
3. Results
3.1 Stiffness and bearing capacity
All three models displayed intense cracking in the pile cap’s inferior
Figure 4 – Concrete constitutive laws
Stress versus opening cracks curve (ATENA)
A
B
Plastic strain (ATENA)C
Tension stiffening curve [2]Table 3 – Reinforcement properties
Poisson’s
ratio
()
0,3
Modulus
of elasticity
(E )
s210 GPa
Ultimate
tensile
strength
(f )
yk591 MPa
Yielding
(
yd)
0,207%
Ultimate
strain
(
lim)
1%
Table 4 – Steel plates properties
Poisson’s
ratio ()
0,3
210 GPa
591 MPa
Modulus of
elasticity (E )
sYielding (f )
yksection and in the lateral faces within the struts, as illustrated by Figure 6. In addition, a fragile collapse was observed due to con -crete crushing in the inferior nodal zones, con-crete splitting and ties bars yielding.
The pile caps ultimate strength capacities were very close in all three models, as shown in Table 6, demonstrating that the increase
exert a signiicant inluence in the pile cap’s load bearing capacity. An increase of 33,33% in the concrete’s compressive strength (from 30 MPa to 40 MPa) and of 21,20% in the concrete’s tensile strength (from 2,58 MPa to 3,13 MPa) caused a meager increase of 13,32% in the pile cap’s ultimate load, from 2.756 kN to 3.123 kN. Table 6 presents the correlations between the concrete com -pressive strength and ultimate load variations.
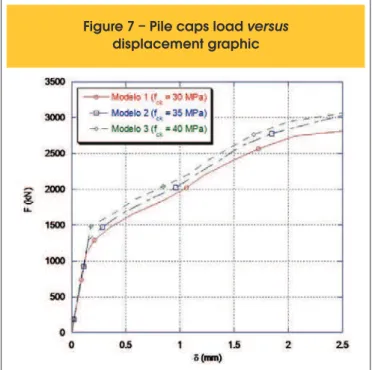
Figure 7 shows the load versus displacement curve where it is pos -sible to notice the great similarity in the behavior of the three pile caps. It is important to stress that no variations in the pile caps stiffness were observed.
3.2 Cracking pattern
In all three models the irst supericial cracks appeared in the cen-ter of the pile cap’s inferior section, expanding through the cencen-ter of the pile cap’s span and towards the pile cap’s superior faces. In the ultimate load, intense cracks occurred in the pile cap’s inferior section and in its lateral sections, as can be seen in Figure 6.
Table 5 – Contact elements properties
Contact element
Values
Normal stiffness parameter (K )
nn5 3
2,0 . 10 kN/m
Tangential stiffness parameter (K )
tt5 3
2,0 . 10 kN/m
Cohesion
0,0
Friction coefficient
0,0
Concrete ultimate tensile strength (f )
tk3,2 MPa
Figure 6 – Crack pattern in the ultimate load (ATENA)
Table 6 – Ultimate load variation (f ) in relation to the concrete compressive strength
ckfck
fck
ftk
f (%)
tkF (Ultimate load)
u
F
uModel 1
30 MPa
-
2,58
-
2.756 kN
-
Model 2
35 MPa
+16,66%
2,83
+9,69
2.940 kN
+6,68%
The increase in the concrete compressive strength (fck) caused a reduction in the cracking intensity, as shown in Table 7, due to the increase in the concrete tensile strength. It is worth noting that the cracking process begins in the region where the structure reaches the ultimate tensile strength, thus beginning a microcracking process, which leads to stress reduction until the material reaches the critical opening crack (wc) – Figure 4a –, when a complete separation of the crack sides takes place. Therefore, the higher the concrete’s ultimate tensile strength, the higher the pile cap’s cracking resistance.
Having mentioned that, in Table 8 a correlation between the pile cap’s crack intensity reduction according to the concrete tensile strength increase is presented. From model 1 to model 3 there was an increase of 21,32% (from 2,58 MPa to 3,12 MPa) in the concrete tensile stress and a reduction around 30% in the crack opening intensity.
3.3 Compressive struts stresses
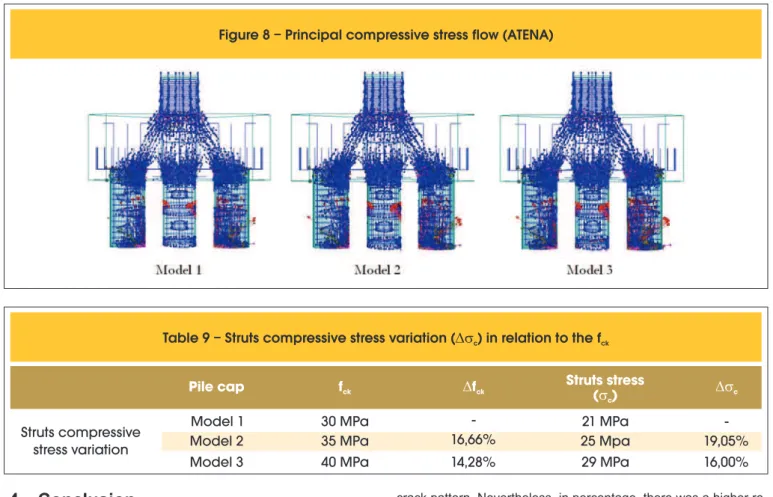
In all three pile caps analyzed compressive struts were developed with equal divisions of the stress low at the bottom of the column’s cross-section in direction to the piles, as shown in Figure 8. In addition, in all models struts compressive stresses were con -centrated in the piles superior cross-section region closer to the column, corroborating Delalibera’s [6] statement that in the inferior nodal zones the struts stresses are not uniformly distributed. The concrete compressive strength led to a proportional in -crease in the struts compressive stresses, as demonstrated in Table 9. The concrete’s compressive strength increase from 30 MPa to 40 MPa (+33,33) generated an increase of 38,09% in the struts stresses.
Notwithstanding, as shown in Figure 8, pile caps stress low did not have a perceptible modiication.
In all models, the inferior nodal zones stresses were higher than the concrete compressive strength (fck), indicating concrete col -lapse, as shown in Table 10.
There was also the development of tensile stresses in the nodal zones and along the struts which reached values higher than the concrete tensile strength, as can be seen in Table 11, demonstrat -ing the concrete splitt-ing.
3.4 Ties tension stresses
Tie bars yielded in the ultimate load in all three models. Moreover, in the inferior nodal zones an abrupt reduction in the ties tensile stresses occurred due to the positive action of the compressive struts in the steel bars.
From igures 9 to 11, it is possible to observe that, in the pile cap’s span, reinforcement tensile stresses were practically constant with values around 590 MPa. Nonetheless, at the beginning of the nod-al zones, tensile stresses were greatly reduced, reaching very low values, around 5 MPa in the borders of the bars and in the hooks. These results prove that tie hooks are not necessary, since tie bars anchorage is made almost totally in the inferior nodal zones which receive the positive inluence of the compressive struts.
Ties tensile stresses in the inferior nodal zones and at the bars bor-ders were not altered by the increase in the concrete compressive strength, as shown in the Figures 9, 10 and 11.
Figure 7 – Pile caps load versus
displacement graphic
Table 7 – Opening cracks values
Load values
(kN)
F=920
F=1.840 F=2.750
Maximum
opening
crack on
the pile
cap’s
surface (mm)
Model 1
0,022
1,52
3,88
Model 2
0,019
1,27
3,33
Model 3
0,015
0,97
3,20
Table 8 – Opening cracks variation (
) in relation to the concrete tensile strength
f
tk
f
tkF=920
F=1.840
F=2.750
Opening cracks
variation (%)
Model 1
2,58 MPa
-
-
-
-
Model 2
2,83 MPa
+9,69%
-13,63%
-16,45%
-14,17%
4. Conclusion
The increase in the concrete compressive strength was not fol-lowed by a signiicant augment in the pile cap’s load bearing ca-pacity and structural behavior. In addition, pile cap’s stiffness was not altered.
In all three models, a brittle collapse was observed due to concrete crushing in the inferior nodal zones, concrete split -ting, and the yielding of the ties. Despite the small incre-ment in the ultimate load caused by the concrete compres-sive strength increase, the influence of high tensile stresses through the struts and the nodal zones was determinant to the pile cap’s collapse.
In all models analyzed, there was no perceptible variation in the
crack pattern. Nevertheless, in percentage, there was a higher re-duction in the pile caps opening cracks in relation to the increase of the concrete’s tensile strength.
In all three models a concentration of compressive stresses in the piles cross-section closest to the column was observed.
Concrete compressive strength increase led to a proportional in-crease of the struts compressive stresses.
In all models, the ties reinforcement yielded and there was a signif -icant decrease of the ties stresses in the inferior nodal zones due to the positive action of compressive struts stresses. At the ends of the bars and on the hooks stresses were practically null, thus corroborating that hooks anchorage in pile caps is unnecessary.
5. Acknowledgments
To FEC-UNICAMP for the provision of all necessary tools for the development of this research which has resulted in a participa-tion and presentaparticipa-tion of a paper related to this subject in the 53º Brazilian Concrete Congress with a subsequent publication in the Congress Annals.
Figure 8 – Principal compressive stress flow (ATENA)
Table 9 – Struts compressive stress variation (
c) in relation to the f
ckStruts compressive
stress variation
Pile cap
f
ck
f
ckStruts stress
(
)
c
cModel 1
30 MPa
-
21 MPa
-Model 2
35 MPa
16,66%
25 Mpa
19,05%
Model 3
40 MPa
14,28%
29 MPa
16,00%
Table 10 – Compressive stresses in the
nodal zones at the ultimate load
Compressive
strength
(MPa)
Pile cap
Inferior
nodal
zones
Superior
nodal
zones
Model 1
> 30
24
Model 2
> 35
28
Model 3
> 40
30
Table 11 – Pile caps tensile stresses
at the ultimate load
Tensile stresses
(MPa)
Model 1
> 2,58
Model 2
> 2,86
6. References
[01] MIGUEL, G. M. Numerical and experimental analysis of three-pile caps. Thesis (Doctorate). School of Engineering of São Carlos, São Paulo University, São Carlos, 2000 (in Portuguesse).
[02] CERVENKA, V.; JENDELE, L. e CERVENKA, J. ATENA Program Documentation—Part 1: Theory. Praha, Czech Republic, 2005.
[03] FUSCO, P. B. Methods for concrete structures reinforcement. Pini Ltda. Publishing House, São Paulo, 1994 (in Portuguesse).
[04] BLÉVOT, J. L.; FRÉMY, R. Semelles sur Pieux. Institut Technique du Bâtiment et des Travaux Publics, V. 20, No. 230, pp. 223-295, 1967.
[05] ADEBAR et al. Strut-and-tie models for design of pile caps: an experimental study. ACI Journal, v. 87, pp. 81-91, Jan-Febr, 1990.
[06] DELALIBERA, R. G. Numerical and experimental analysis of two-pile caps submitted to axial and eccentric load. . Thesis (Doctorate). School of Engineering of São Carlos, São Paulo University, São Carlos, 2006 (in Portuguese).
[07] SU R. K. L.; CHANDLER A. M. Design criteria for Uniied Strut and Tie Models. Progress in Structural Engineering and Materials, V.3, No. 3, pp 288-298, October 2001.
[08] CSA. 1994. Design of concrete structures. Standard CSA-A23.3– 94. Canadian Standard Association, Rexdale, Ont.
[09] AUSTRALIAN STANDARD. AS 3600 – Concrete structures. Standards Australia International, 2002. [10] NZS 3101: Part 1: 1995 (1995), Concrete Structures
Standard - The Design of Concrete Structures. Standards New Zealand, Wellington.
[11] COMITÉ EURO-INTERNATIONAL DU BÉTON. CEB-FIP Model Code 1970. Recommandations particulières au calcul et à l’exécution dês semelles de fondation. Bulletin D’Information, Paris, n.73.
[12] FÉDÉRATION INTERNATIONALE DU BÉTON. ib Model Code 2010 – Final draft. V. 2, ib nº. 66, pp. 370, 2012. [13] BRAZILIAN ASSOCIATION STANDARDS.
NBR 6118:2007 – Design of concrete structures. Rio de Janeiro, 2004 (in Portuguese).
[14] RAMOS, F. A. C. Numerical analysis of tem-pile caps: Supports reactions calculation. São Carlos. Dissertation (Master) - School of Engineering of São Carlos, São Paulo University, 2007 (in Portuguese).
[15] CLARKE, J. L. Behavior and design of pile caps with four piles. Cement and Concrete Association, London, Technical Report n.42.489, 1973.
[16] RAUSH, A; D’ASCENSO, N; GOLDSCHMIDT, P; NATALINI, M. Analisis Experimental sobre Cabezales de Pilotes Sometidos a Cargas Verticales. XXVIII Jornadas Sul-Americanas de Engenharia Estrutural, V.01, p. 309-318, São Carlos, 1997.
Figure 9 – Model 1 ties tensile stresses
in the anchorage zone (ATENA),
where stresses values are highlighted
in some ties points (values in MPa)
Figure 10 – Model 2 ties tensile stresses
in the anchorage zone (ATENA),
where stresses values are highlighted
in some ties points (values in MPa)
Figure 11
– Model 3 ties tensile stresses
in the anchorage zone (ATENA),
where stresses values are highlighted
caps. Dissertation (Master) – Faculty of Civil Engineering, Architecture and Urbanism, State University of Campinas, 2011 (in Portuguese).