J. Aerosp. Technol. Manag., São José dos Campos, Vol.8, No 4, pp.475-482, Oct.-Dec., 2016 AbstrAct: This paper addresses the static distortion and
stress analysis of inlatable antenna structures subjected to a thermal load, which is a very important type of load experienced by such structures during service in orbit. Non-linear inite element analysis methods for inlatable structures were formulized, and the thermal stress of thin ilms was considered. The dynamic relaxation method was used to address the singularity problem of the stiffness matrix for the non-pre-stressed membrane structures. When the thermal load is changing, the state of the inlation gas inside the structure chamber varies, as well as the thermal stress of the membrane material. An iterative algorithm was presented to solve this coupling problem between thermal load, the structures, and inlation gas. The presented algorithm has been implemented into an own inite element code of inlatable structures. The thermal deformation and the stress distribution of a 3.2-m inlatable antenna structure were analyzed to illustrate the feasibility of the numerical method. The results indicated that the change in the state of the inlation gas adversely affects the structural performance, so the inlation gas must be considered.
Keywords: Inlatable antenna structures, Thermal distortion analysis, Non-linear FEM, Gas state equation.
Thermal Distortion Analysis of Inlatable
Antenna Structures Considering Inlation Gas
Yan Xu1, Fuling Guan2, He Huang2, Qian Ye3INTRODUCTION
Membrane structures are excellent as architectural and aerospace ones. With respect to the latter, membranes are used to construct inlatable structures, such as inlatable antennas, sunshield structures, sail arrays, Mars explorers, space capsules, etc. Inlatable structures ofer many advantages, including low manufacturing cost, light weight and small launch volume.
Thermal loads represent a very important type of load experienced by inlatable antenna structures during service in orbit. To evaluate the performance of such structures, it is necessary to analyze their static deformation and stress distribution under varying external heat lux. To date, the thermal deformation of membrane structures has been investigated through some research and development eforts. he thermo-mechanical coupling and the efect of thermal disturbance on membrane structures were studied (Wang et al. 2008). A thermal-structural analysis method was described for predicting the stress state in a thin-ilm membrane of a sunshield subjected to both mechanical and thermal loads (Johnston and Parrish 2003). he structural integrity of a 3-m Ka-Band inlatable/self-rigidizable relectarray antenna under space thermal conditions was examined (Fang et al. 2003) as well as the temperature distribution, thermal deformation and buckling strength of the inlatable boom. Both theoretical and experimental analyses of a plan membrane relector under a thermal load were provided (Jenkins and Faisal 2001). he wrinkled deformed shape of the envelope of a stratospheric airship induced by a thermal load was analyzed (Roh et al. 2008). he inlation gas in the internal chamber of these investigated inlatable structures was released
doi: 10.5028/jatm.v8i4.625
1.Zhejiang University – School of Aeronautics and Astronautics – Department of Aeronautics and Astronautics – Hangzhou – China. 2.Zhejiang University – College of Civil Engineering and Architecture – Department of Civil Engineering – Hangzhou – China. 3.Zhejiang University of Finance and Economics – Dongfang College – Department of Engineering Management – Hangzhou – China.
Author for correspondence: Yan Xu | Zhejiang University – School of Aeronautics and Astronautics – Department of Aeronautics and Astronautics | 38 Zheda Rd, Xihu | Postal code: 310027 – Hangzhou – China | Email: [email protected]
J. Aerosp. Technol. Manag., São José dos Campos, Vol.8, No 4, pp.475-482, Oct.-Dec., 2016 476 Xu Y, Guan F, Huang H, Ye Q
ater full deployment; thus, the efect of the residual gas on the performance of the structures was ignored.
For other types of inlatable structures, such as inlatable antenna relectors (Freeland et al. 1996; Freeland et al. 1997) and lunar habitats (Di Capua et al. 2011; Viscio et al. 2013), the inlation gas in the internal chamber will be kept during service. herefore, the efect of the residual gas must be considered for thermal deformation analysis. his paper reports a recent efort to develop a theoretical framework for a thermal statics analysis method for inlatable antenna structures considering the variation in the state of the inlation gas in the internal chamber of these structures. An iterative algorithm is presented to solve this coupling problem between thermal load, structure and inlation gas.
he remainder of this paper consists of 4 sections. Inlatable Membrane Mechanics section presents the FEA formulations of inlatable membrane mechanics and the dynamic relaxation method used to address the singularity problem of the stifness matrix. he iterative algorithm of the thermal statics analysis is described in hermal Distortion Analysis Method section. he thermal deformation and the stress distribution of a 3.2-m inlatable antenna structure are analyzed in Analysis Results and Discussion section. Finally, Conclusion section provides a few concluding remarks and suggestions for future research.
INFLATABLE MEMBRANE
MECHANICS
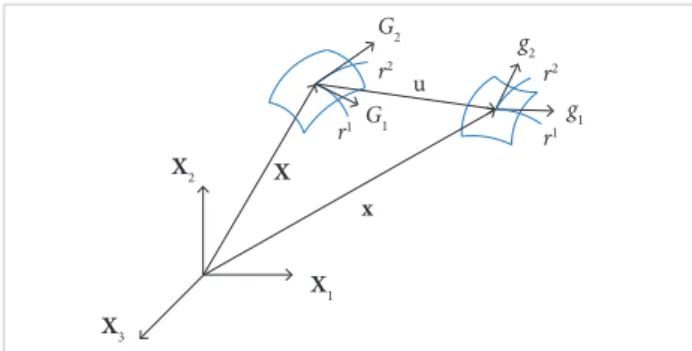
he total Lagrange (TL) method is used to formulate the mechanics of membrane structures. he initial coniguration ω0 is selected as the reference coniguration in this method. Membrane structures are considered to deform from the known deformed coniguration ωt to the unknown deformed configuration ωt+Δt, as shown in Fig. 1. Let us consider the deformation from position vector X to x with respect to the
configurations on the surface ω0 and ωt, respectively. The following notation is used:
Figure 1. Base vectors of the middle surface.
X 3 X 1 X 2 X x u
G2 g
2
g1 G1
r2 r2
r1
r1
where: X is the position vector of a material point in the
reference coniguration; x is the position vector of a material
point in the actual coniguration; u is the deformation vector.
The covariant basis vectors of the surfaces ω0 and ωt are:
where: α = 1, 2, r1 and r2 are the convective curvilinear
coordinates of the surfaces.
he covariant components of the surfaces are deined as:
where: α, β = 1, 2; Gβ, gβ are the covariant basis vectors of the surfaces ω0 and ωt.
he contravariant basis vectors are obtained as follows:
where: Gαβ and gαβ are the contravariant components, being
[Gαβ] = [G αβ]
−1, [gαβ] = [g αβ]
−1 .
For strain and stress measurements, the Green-Lagrange strain tensor E and the energetically conjugated second
Piola-Kirchhof stress tensort
0S are used. Considering thermal stress,
the Green-Lagrange strain tensor E is given by:
where: t
0X is the deformation gradient, which links the
reference configuration to the deformed one; I is the unit
tensor; γ is the thermal expansion coeicient; ΔT is the change in temperature.
he second Piola-Kirchhof stress tensor is expressed in terms of the Green-Lagrange strain tensor by the constitutive law for an isotropic and linear elastic material:
(1) (2) (3) (4) (5) (6)
u
x
X
x
,
α
α
τ
Q
F
F
,
r
r
X
x
G
g
g
α
α
τ
Q
F
F
,
G
G
G
g
g
g
α
α
τ
Q
F
F
,
G
g
G
G
g
g
α
α
τ
Q
F
F
0 0 1 1 ( ) ( ) 2 2t T t T T
E X X I α g G G G α
τ
Q F F
α α
E
C
S
tt
0
0
:
τ
Q F F
∙
∙
J. Aerosp. Technol. Manag., São José dos Campos, Vol.8, No 4, pp.475-482, Oct.-Dec., 2016 477
Thermal Distortion Analysis of Inlatable Antenna Structures Considering Inlation Gas
where: C is the elastic matrix of the material; t
0E is the
Green-Lagrange strain tensor.
he formula relating the Cauchy stress tensor to the second Piola-Kirchhof stress tensor is:
where:
where: J is the determinant of the Jacobian matrix; t tτ is
the Cauchy stress tensor.
he weak form of the equilibrium equation is attained by the principle of virtual work, which states that the sum of internal and external works vanishes at equilibrium:
where: 0V is the volume of the structure; t+ΔtδR is the work
done by the external loads.
he stifness matrix of the membrane element includes two parts: the initial deformation stiffness matrix and the geometric stifness matrix. he initial deformation stifness matrix K L can be obtained as:
he formulas used to analyze inlatable structures do not feature a pre-stress of the material at the initial coniguration. If the bending stifness of the thin-ilm material is ignored, the geometric stiffness matrix K NL is zero, and the values in the initial stiffness matrix are small. The process of FEM iterative calculation cannot be successfully employed because of the singularity of the stifness matrix. he dynamic relaxation method is presented to solve this problem. hrough this method, the static problem is transformed into a quasi-dynamic problem. he deformation of a non-pre-stressed membrane subjected to thermal loads is analyzed by the iterative calculation. he equilibrium formula is rewritten as follows:
where: Q is the internal force vector; F is the external force vector; u is the displacement vector of the nodes.
he N-R method is applied to solve the equilibrium formula:
(7) (8) (9) (11) (10) (12) (13) (14)
α
α
1
0 0 0
t t t t T
t
S
J X
τ
X
Q
F
F
α
α
τ
0
0
0
(
0)
t t t t
t t
V
d V
S
E
R
Q
F
F
− −
⋅ ⋅τ
τ
αβ
δ
αβδ
Δ Δ Δ
∫
Δδ0
0
0 0 0
(t T t )
L L L
V
d V
=
∫
⋅ ⋅K B C B
]
! ∂ ∂ ∂ ∂ ∂ ∂ ∂ ∂ ∂ ∂ ∂ ∂ ∂ ∂ ∂ ∂ ∂ ∂ ∂ ∂ ∂ ∂ ∂ ∂ α αΩ
⋅ ⋅∫
L
− −
⋅ ⋅τ
τ
αβ
δ
αβδ
Δ Δ Δ
∫
Δδ⋅ ⋅
∫
here:
0tBL=[
0tB1L 0tBL2 ! 0tBLn]
. ∂ ∂ ∂ ∂ ∂ ∂ ∂ ∂ ∂ ∂ ∂ ∂ ∂ ∂ ∂ ∂ ∂ ∂ ∂ ∂ ∂ ∂ ∂
∂ n n
α α
Ω
⋅ ⋅
∫
L
− ⋅ ⋅τ −
τ
αβδ αβ δ
Δ Δ Δ
∫
Δδ ⋅ ⋅∫
! ∂ ∂ ∂ ∂ ∂ ∂ + ∂ ∂ ∂ ∂ + ∂ ∂ ∂ ∂ ∂ ∂ ∂ ∂ ∂ ∂ ∂ ∂ ∂ ∂ = 1 2 2 2 2 1 1 1 2 2 1 1 2 2 2 2 1 2 1 2 1 1 1 1 0 ( ) ( ) ( ) ( ) ( ) ( ) ( ) ( ) ( r N r N r N r N r N r N r N r N n t n t n t n t n t n t n t n t n L t g g g g g g g g B tα t α
Ω
⋅ ⋅
∫
L
− ⋅ ⋅τ −
τ
αβδ αβ δ
Δ Δ Δ
∫
Δδ ⋅ ⋅∫
]
! ∂ ∂ + ∂ ∂ ∂ ∂ ∂ ∂ ∂ ∂ ∂ ∂ ∂ ∂ ∂ ∂ ∂ ∂ ∂ ∂ ∂ ∂ ∂ ∂ 1 3 2 2 3 1 1 2 3 2 1 3 1 ) ( ) ( ) ( ) ( r N r N r N r N n t n t n t n t g g g g α α Ω ⋅ ⋅∫
L
− ⋅ ⋅τ −
τ
αβδ αβ δ
Δ Δ Δ
∫
Δδ ⋅ ⋅∫
! ∂ ∂ ∂ ∂ ∂ ∂ ∂ ∂ ∂ ∂ ∂ ∂ ∂ ∂ ∂ ∂ ∂ ∂ ∂ ∂ ∂ ∂ ∂ ∂ α α Ω 0 0 0 0 0(t T t t )
V
d V
=
∫
⋅ ⋅K B S B
L
where:
where: (tg
α)i is the component of tg
α according to the
global coordinate vector e i; 0C is the elasticity tensor in the coniguration ω0; Nn is the interpolation function according
to node n in the element.
he geometric stifness matrix K NL can be obtained from:
− ⋅ ⋅τ −
τ
αβδ αβ δ
Δ Δ Δ
∫
Δδ ⋅ ⋅∫
! ∂ ∂ ∂ ∂ ∂ ∂ ∂ ∂ ∂ ∂ ∂ ∂ ∂ ∂ ∂ ∂ ∂ ∂ ∂ ∂ ∂ ∂ ∂ ∂ α α Ω ⋅ ⋅∫
where: 1 2
0 0 0 0
t t t t n
=
B B B L B
T n n n n n n n t r r r r r r ∂ ∂ ∂ ∂ ∂ ∂ ∂ ∂ ∂ ∂ ∂ ∂ = 2 1 2 1 2 1 0 0 0 0 0 0 0 0 0 0 0 0 0 B
Q F − − ∂ ∂
α
α
τ
( )
u
Q
F
)
F
α
α
τ
1(
k) *(
k
k)
(
k)
K u
u
u
F Q u
F
α
α
τ
(
)
(
)
kk
Q u
K
u
u
F
α
α
τ
u
( )
Du Q u
F
where the tangent stifness matrix is:
When the thin-ilm material is not pre-stressed at the initial coniguration, the stifness matrix is singular and Eq. 12 cannot be solved. he static problem is equivalent to the quasi-dynamic problem described by the following quation:
where: D is the hypothetical damping term.
Ater the iterative calculation convergence, the velocity term u . tends to zero. he previous equation is transformed into Eq. 11. In one time step, the velocity term u . is:
t
J. Aerosp. Technol. Manag., São José dos Campos, Vol.8, No 4, pp.475-482, Oct.-Dec., 2016 478 Xu Y, Guan F, Huang H, Ye Q
where: k = nR, which only depends on the numerator of the inlation gas state equation.
When the leaking of the inflation gas is ignored, k is a
constant value. If the environmental temperature changes to
T1, from the equation of state for an ideal gas, where: Δt is the hypothetical iterative time step.
Equation 15 is substituted into the N-R method equation, then:
he iterative calculation process is completed when the previous equation and the equilibrium state subjected to the loads are calculated:
he hypothetical damping term in Eq. 14 is:
where: kμis the attenuation coeicient.
To accelerate the iterative calculation, kμ can be determined as:
where: kΔu
is the increment in the node displacement vector in kth iterative step, and the attenuation coeicient kμof the irst
step is manually input.
THERMAL DISTORTION ANALYSIS
he equation of state for an ideal gas is:
As indicated by Eq. 22, pressure and volume are inversely proportional. As the environmental temperature increases or decreases, the deformation of the membrane surface and the equilibrium state of the inlation gas vary synchronously. A new equilibrium state is reached when the constant value k reverts to the initial value. An iterative algorithm is required to solve this coupling problem and to calculate this new equilibrium state.
IterAtIve AlgorIthm
he purpose of this section is to present an iterative algorithm for calculating the new equilibrium state of the gas in the inlatable structure chamber ater the environmental temperature changes, where the pressure and volume of the gas are analyzed.
As shown in Fig. 2, when the environmental temperature changes from T0 to T1, the pressure and volume of the inlation gas change from their initial values to P1 and V1, respectively, where Pmax = kT1/V0; Vmax = kT1/P0. When the temperature changes to T2, the pressure and volume of the inlation gas change from their initial values to P2 and V2, respectively, where
Pmin= kT2/V0; Vmin = kT2/P0.
From the initial state V0, P0, T0 of the inflation gas to the new equilibrium state V1, P1, T1 (or V2, P2, T2), there are n increment steps in the calculation process. When the temperature changes to T1, the volume of the gas is assumed to be constant at first. Thus, according to the state equation of a constant change in volume, the pressure changes to
Figure 2. Pressure-volume curve of the inlation gas.
P
V
Pmax
(P2, V2) (P0, V0)
(P1, V1)
T1 >T0
T2 < T0 T0
Vmax Pmin
Vmin (15)
(16)
(17)
(18)
(19)
(20)
(21)
&
&
&
− Δ
&
Δ
1
[ ( ) ]*( ) ( )
k k k k
t
+
+ − = −
Δ
D
K u u u F Q u
− &Δ
−
Δ Δ
Δ
1k
u
ku
u
t
RT
kT
b u
&
&
&
− Δ
&
Δ
− −
Δ
− &Δ
k
µ
=
D I
−
Δ Δ
Δ
&
&
&
− Δ
&
Δ
− −
Δ
− &Δ
1
1
k
k k
k
µ µ
−
Δ
=
Δ
u
u
Δ
P
=
nRT
kT
)
and yields:
1 1 0 0
1 0
V
V
k
T
=
T
=
kT
where: V, P, and T are the volume, pressure, and temperature, respectively, of the inlation gas.
For the internal chamber of the inlatable structure, the leaking of the inflation gas is ignored. Therefore, the gas undergoes a transition from the initial state (P0, V0, T0) to the inal one (P1, V1, T1)and yields:
(22)
1 1
1
kT
V
=
α
α
τ
1
k k
t
u
u
J. Aerosp. Technol. Manag., São José dos Campos, Vol.8, No 4, pp.475-482, Oct.-Dec., 2016 479
Thermal Distortion Analysis of Inlatable Antenna Structures Considering Inlation Gas
P*
1= T1 P0
/
T0. Therefore, the increase in the gas pressurein the first incremental step is ΔP1= (P*
1– P0 )/n. The total
pressure after this step is P1 = P0 + ΔP1. Thus, the thin-film material deforms under this pressure. The deformed configuration and the new volume of the structure chamber
V1 are determined by FEM analysis. Based on the equation of state for an ideal gas, the new pressure is obtained:
P*
2= (P0V0T1)/(T0V1). The increase in pressure in the second incremental step is ΔP2= (P*
2– P1)/(n–1). The total pressure
after this step is P2 = P1 + ΔP2. The deformed configuration and the new volume of the structure chamber V2 are analyzed again. Further iteration is performed until the increase in pressure in each incremental step is very small.
enclosed volume of structure chAmber he volume of the structure chamber must be calculated in the iterative algorithm. he method for calculating the volume of the chamber is presented in this section. he structure’s surface is modeled by a mesh composed of triangular elements. The volume of the chamber is equal to the sum of the volumes of the triangular prisms covered by the corresponding triangular elements. The volume of one triangular prism is shown in Fig. 3. he underside of each triangular prism is on the xy
plane in the global coordinate system. he volume of each triangular prism is:
and k of the n element deform from a coniguration Xn, the increase in the value of the node displacement vector is Δdn
and the increase in the triangular prism volume is ΔVn.he relationship between these 2 incremental values is:
Z
Y
X i
k
n
j
Figure 3. Chamber volume of a triangular prism.
where:
his equation describes the change in the chamber volume with the deformation of the surface.
RESULTS AND DISCUSSION
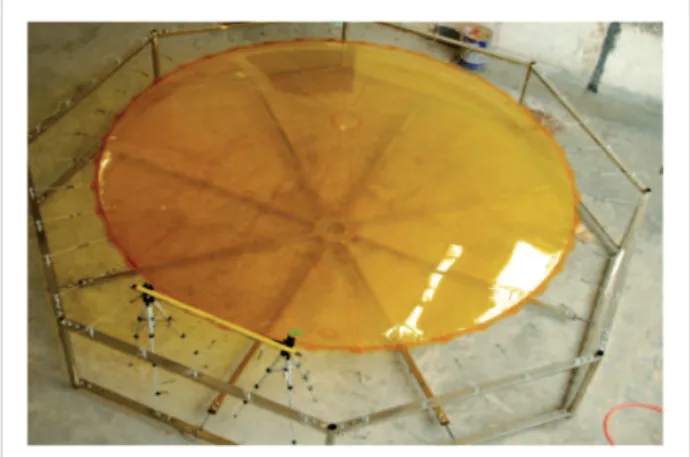
In this section, the thermal distortion analysis of an inlatable antenna structure is performed to illustrate the feasibility of the numerical method. A 3.2-m ground demonstration space antenna structure was designed and manufactured (Xu and Guan 2012). he thermal distortion analysis method was applied to the inlatable antenna structure, but the high- and low-temperature experiments have not been performed yet to validate these results. he ground demonstration model is shown in Fig. 4. he aperture of the inlatable relector is 3.2-m, and the ratio between the focus length and aperture is 0.5. he designed inlatable pressure is 20 Pa. he membrane material is Kapton®
VN (DuPont™). he elastic modulus is 2.5 GPa, the Poisson’s
ratio is 0.340 and the membrane thickness is 0.025 mm. he coeicients of thermal expansion of the thin-ilm material in each temperature range are shown in Table 1.
he absolute value sign guarantees that the volume value is always positive, whether the nodes i, j, and k are numbered clockwise or counterclockwise. When the three nodes i, j,
(23)
(24)
1
( )( ) (
6 j i i
V = x −x y −y − x − −
Δ Δ
( )
Δ − X
− −
− − − − −
−
−
− − − − −
−
−
− − − − −
) ( k i)( j i) ( i j k)
y x x y y z z z
− − − − − + +
Δ Δ
Δ − b u
− −
− − − − −
−
−
− − − − −
−
−
− − − − −
−
−
−
−
−
Δ
Δ
( ) ( )
n n n n n n n n
V V V
Δ = X +u − X =b u
− −
− − − − −
− −
− − − − −
− −
− − − − −
− − − − −
Δ Δ
Δ −
1 2 3 4 7 8 9
1 6
n= bn bn bn bn bn bn bn bn bn
b
1
2
3
5
6
7
8
( )( ),
( )( ),
( )( ) ( )( )
( )( ),
( )( ),
( )( ) ( )( )
( )( ),
( )( ),
n j k i j k
n k j i j k
n j i k i k i j i
n k i i j k
n i k i j k
n j i k i k i j i
n i j i j k
n j i i j k
n
y y z z z
x x z z z
x x y y x x y y
y y z z z
x x z z z
x x y y x x y y
y y z z z
x x z z z
= − + +
= − + +
= − − − − −
= − + +
= − + +
= − − − − −
= − + +
= − + +
9
( j i)( k i) ( k i)( j i)
T
n i i i j j j k k k
x x y y x x y y
dx dy dz dx dy dz dx dy dz
= − − − − −
=
J. Aerosp. Technol. Manag., São José dos Campos, Vol.8, No 4, pp.475-482, Oct.-Dec., 2016 480 Xu Y, Guan F, Huang H, Ye Q
Z coordinate of the vertex (m)
rms of the relective surface (mm)
I n i t i al
coniguration 0.4268 0.1295
Load case 1 0.4254 0.1883
Load case 2 0.4252 0.5713 Table 2. The numerical results of the relective surface.
Figure 4. Ground demonstration model (Xu and Guan 2012).
z
x
temperature range (oc)
thermal expansion coeficient
(ppm/oc)
30 – 100 17
100 – 200 32
200 – 300 40
300 – 400 44
Table 1. Thermal expansion coeficients of Kapton® VN (DuPont™).
The inflatable antenna structure consists of a reflective surface, canopy, tension/adjustment cable system and support structure. The reflective surface and the canopy were assembled individually by fastening the planar membrane gores together. The reflective surface and the canopy were then glued together along their circumferences to form an envelope structure to contain the inflation fluid (i . e .
ambient air in our case). The envelope structure was mounted onto the support structure by the tension/adjustment cable system.
The iterative algorithm presented in the last section was employed to analyze the thermal static deformation and stress of this inflatable antenna structure. Considering structural symmetry, the thermal static deformation of reflector was calculated. The reflector surface was modeled by 360 triangular elements, and each tension/adjustment cable was meshed by a single element. The movement of each circumference node of the envelope structure along the z direction was fixed, as was that of the nodes on the
support structure along all directions. Top and side views of the numerical model are shown in Fig. 5.
Because the size of this demonstration model is small, the temperature gradient on the structure’s surface is ignored. The environmental temperature of the inflatable structure
Figure 5. Numerical model of the inlatable antenna. (a) Top view; (b) Side view.
changes from 30 to 10°C. Two load cases were defined and analyzed to investigate the effect of the inflation gas.
• Load case 1: Only the thermal deformation of the membrane material was considered; the pressure in the chamber was fixed to the designed pressure, 20 Pa.
• Load case 2: The thermal deformation of the mem-brane material and the change in the state of the inflation gas were considered to occur synchronously. After the environmental temperature changed, the gas pressure was no longer equal to the designed pressure.
hese two load cases were analyzed. he total number of incremental steps was n = 50. he results of the analysis, the z
coordinate of the vertex and the RMS of the relective surface are shown in Table 2.
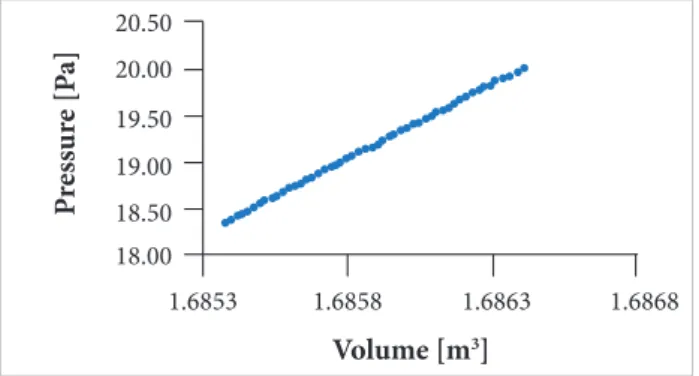
The numerical results for the second load case, and the curve relating pressure P and volume V for each incremental
step are shown in Fig. 6. Through iterative analysis, the initial gas state (V
0, P 0)in the curve changes to the final
one(V
2, P 2), where P 2 = 18.35 Pa and V 2 = 1.6853 m 3.
The gas constant value k changes though the iterative
analysis process (Fig. 7). At irst, the k value greatly deviates
from the initial one, 0.1232 Nm/°C. hen, the k value tends
to the initial one, reaching 0.1132 Nm/°C.
Ater the environmental temperature changes, the maximum displacement of the nodes (−1.7 mm) occurs along the top
J. Aerosp. Technol. Manag., São José dos Campos, Vol.8, No 4, pp.475-482, Oct.-Dec., 2016 481
Thermal Distortion Analysis of Inlatable Antenna Structures Considering Inlation Gas
Figure 7. Gas constant value change.
0.1240 0.1220 0.1200 0.1180 0.1160 0.1140 0.1120 0.1100
0 10 20 30 40 50
I n t erative step
G
as c
o
ns
ta
n
t va
lu
e
[
k
]
20.50
20.00
19.50
19.00
18.50
18.00
1.6853 1.6858 1.6863 1.6868
Volume [m3]
P
ress
ur
e [P
a]
of t h e r e f l e c t o r s u r f a c e. The maximum stress zone of the
membrane material occurs along the boundary of the canopy. he maximum irst principle stress is 1.56 MPa, the maximum second principle stress is 1.32 MPa, and the tension stress of the cables is 12.56 MPa.
Based on the analytical results, it can be concluded that the effect of the thermal stress of the thin-film material on the deformation of the structure is not very great. But the change in the state of the inflation gas adversely afects the relector precision, and the inlation gas must be considered in evaluating the structural performance of the inlatable structures. Ater the environmental temperature changes, the inal gas pressure is not equal to the designed pressure.
CONCLUSION
A thermal statics analysis method for inlatable antenna structures considering the variation in the state of the inlation gas was investigated. An iterative algorithm was presented to solve the coupling problem between thermal load, structural deformation, and inlation gas. he dynamic relaxation method was used to address the singularity problem of the stifness matrix for the non-pre-stressed membrane structures. he analytical results indicated that the efect of the thermal stress of the membrane material on the distortion distribution and stress distribution of the structure is not very great, although the change in the state of the inlation gas adversely afects the inal coniguration. he thermal deformation of the inlatable antenna structures is large, and it is necessary to investigate the thermal and inlation pressure control system. As the antenna moves in and out of the Sun, the inlatable gas may be vented and reilled. hus, the present study will provide a reference for the controller design.
ACKNOWLEDGEMENTS
This paper was supported by the National Natural Science Foundation of China (Grant No. 11402229) and the Natural Science Foundation of Zhejiang Province (Grant No. LQ14A020003).
AUTHOR’S CONTRIBUTION
Xu Y and Guan F conceived the idea and co-wrote the main text. Xu Y and Huang H performed the numerical simulation and experimental works. Ye Q prepared the figures and formulas. All authors discussed the results and commented on the manuscript.
Figure 6. Pressure-volume curve of the relector structure.
REFERENCES
Di Capua M, Akin DL, Davis K (2011) Design, development, and testing of an inlatable habitat element for NASA lunar analogue studies. Proceedings of the 41st International Conference on Environmental Systems; Portland, USA.
Fang H, Lou M, Huang J, Quijiano U, Hsia LM (2003) Thermal distortion analyses of a three-meter inlatable relectarray antenna. Proceedings of the 44th AIAA/ASME/ASCE/AHS/ASC Structures,
Structural Dynamics, and Materials Conference; Norfolk, USA.
Freeland RE, Bilyeu GD, Veal GR (1996) Development of light hardware for a large, inlatable-deployable antenna experiment. Acta Astronaut 38(4-8):251-260. doi: 10.1016/0094-5765(96)00030-6
J. Aerosp. Technol. Manag., São José dos Campos, Vol.8, No 4, pp.475-482, Oct.-Dec., 2016 482 Xu Y, Guan F, Huang H, Ye Q
41(4-10):267-277. doi: 10.1016/S0094-5765(98)00057-5
Jenkins CH, Faisal SM (2001) Thermal load effects on precision membranes. J Spacecraft Rockets 38(2):207-211. doi: 10.2514/2.3671
Johnston J, Parrish K (2003) Thermal-structural analysis of sunshield membranes. Proceedings of the 2003 AIAA Structures, Structural Dynamics, and Materials Conference; Norfolk, USA.
Roh JH, Lee HG, Lee I (2008) Thermoelastic behaviors of fabric membrane structures. Adv Compos Mater 17(4):319-332. doi: 10.1163/156855108X385285
Viscio MA, Viola N, Gargioli E, Vallerani E (2013) Conceptual design of a habitation module for a deep space exploration mission. Proc IME G J Aero Eng 227(9):1389-1411. doi: 10.1177/0954410012457292
Wang XY, Sulik C, Zheng WP, Hu YR (2008) Thermo-mechanical analysis of thin membranes and application in active latness control design. Proceedings of the Industrial and Commercial Applications of Smart Structures Technologies 2008; San Diego, USA.