*e-mail: [email protected]
Using the Ratio: Maximum Load over Unload Stiffness Squared, P
m/S
u2, on the
Evaluation of Machine Stiffness and Area Function of Blunt Indenters on
Depth-sensing Indentation Equipment
Juan Manuel Mezaa∗, María Cristina Moré Fariasb,
Roberto Martinz de Souzab, Luis Javier Cruz Riañoc
a
New Materials Research Group, Pontifical Bolivarian University,
Circular 1 No 70-01, Medellín, Antioquia, Colombia
b
Surface Phenomena Laboratory, Department of Mechanical Engineering,
Polytechnic School, University of São Paulo – USP,
Av. Prof. Mello Moraes, 2231, 05508-900 São Paulo - SP, Brazil
Received: May 21, 2007; Revised: October 9, 2007
Depth sensing indentation study was conducted in a Fischerscope H100V machine, equipped with a Vickers indenter with a tip roundness of approximately 1330 nm. Tests were carried out on soda-lime glass, fused silica, sapphire, aluminum (1100 alloy), high alloyed steel, titanium and copper. The widely used iterative method of Oliver and Pharr was unsuccessful in the attempts to analyze machine compliance and indenter area function. Therefore, an alternative procedure was adopted. The alternative procedure is based on the ratio between maximum load and unload stiffness squared, Pm/Su2. It was found that this procedure, which is not iterative, gives good results.
A careful study of the Pm/Su
2 ratio, lead us to conclude that the Fischercope machine has a low compliance which
depends on the sample mounting. This low compliance in conjunction with the recent discovery of the dependence of β factor on the tip roundness/maximum depth ratio, which appears in the relation between contact stiffness and contact area, explains why the iterative method does not converge. However, variations in β and machine compliance produces deviation on the hardness and elastic modulus lower that 6% with respect to expected values for the materials and the machine studied in this work.
Keywords: depth-sensing indentation, nanoindentation, mechanical properties, machine compliance, tip roundness
1. Introduction
The depth-sensing indentation technique has turned into one of the most important tools for the evaluation of the mechanical proper-ties of coatings and bulk materials. The contact area is a paramount parameter required to analyze indentation data, since it is used for estimating elastic modulus, hardness and other material properties. Machine compliance, initial contact depth, thermal drift and indenter geometry should be taken into account, such that the contact area can be correctly estimated1.
Currently, different methods are available1-7 for the correction
of tip bluntness, for Vickers and other types of indenters. The most accurate method is the topographic characterization by atomic force microscopy5,7; however, it is time consuming and requires
large investments in terms of equipments and optical-laser sensors. The iterative method proposed by Oliver and Pharr3 is widely used
to obtain both the indenter geometry (area function) and machine compliance; however, the method is very sensitive to mathematical data treatment and, in some cases, it is not able to provide an accurate value of the area function4,6,8,9. The computational routines developed
through the iterative method may lead to inaccurate results, due to an underestimation of the machine compliance9. In fact the iterative
method does not converge for the Fischercope machine-tip used in this work. For this reason, a combination of the Doerner and Nix, Oliver and Pharr method was used in a previous study on the same machine-indenter by Franco et al.8 in order to calibrate the indenter
area function. Although the method adopted by Franco et al. gives good results, it requires the use of microscopy techniques, which
also means that it is very difficult to implement at a small scale as well as time consuming.
It has been recently proposed that the Pm/Su2 parameter can be
used in order to find the machine compliance and to calibrate the area function. However, it was only applied to the continuous stiffness measurement technique10 and to fused silica11 but not for a simple
loading-unloading cycle and other materials. Research efforts have been made on the Pm/Su
2 parameter and the most important variables
that affect the Oliver and Pharr method using different materials, to provide the reasons why the iterative Oliver and Pharr method does not converge for Fischercope-indenter under study. The parameter Pm/Su
2 allows the detection of potential problems in the machine
cali-bration as well as performing the area function calicali-bration, even for a very low compliance machine such as Fischecope. It suggests that it is a very important parameter. Given the importance of the iterative method, it will be briefly reviewed in this work, based on the works by Oliver and Pharr3,11,12,14 and other publications1,2,4,9.
2. Background
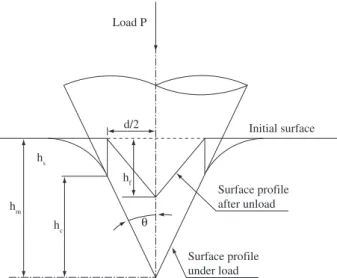
The analysis by the iterative method is applied to the unloading portion of the indentation cycle, assuming that the unloading behavior of the material is characterized only by elastic recovery. Figures 1 and 2 show the key parameters used in the analysis.
distance from its tip, and the machine compliance. The method is based on the measurement of contact stiffness and does not require imaging of the indentation.
The method models the instrument and the specimen as two springs in series, in which case the machine compliance, Cf, and the specimen compliance, Cu, are related through the equation:
CT = Cf – Cu (1)
The specimen stiffness, Su, can be calculated using the theory of elasticity14 through the equation14:
(2)
where β is a parameter which depends on the indenter geometry and material properties and usually takes a value from 1.00 to 1.0811,
but that have been demonstrated that it can take values as high as 1.2615,16.
Also, Er is the reduced modulus, which accounts for the elastic dis-placement of both the indenter and the specimen and is given by:
(3)
where E and ν are the elastic modulus and the Poisson ratio of the specimen, respectively. Ei and νi are the same parameters for the indenter.
After correcting the data by the machine compliance, the speci-men stiffness, Su, can also be obtained directly from the unload slope, as illustrated in Figure 1.
The procedure initially involves the conduction of high load indentations in a soft material, i.e high depths, such as aluminum. An estimate of the machine compliance and the area function can be obtained through an iterative procedure, which is listed below:
Load raw data.
Correct data: zero point reference (h0) and thermal drift (Equa-tion 4), where TD is the thermal expansion coefficient of the machine frame and t is the time:
h = ht – h0 – tD x T (4)
Fit unloading portion of load-displacement data to power-law relation, where K, hf and m are fitting parameters:
P = K(h – hf)m (5)
Calculate the total unload stiffness at maximum load:
(6)
Estimate the contact depth:
(7)
Estimate the contact area (Ac) through the ideal contact area (Acid):
Acid - 24.5h2
c (8)
Estimate the machine compliance (Cf) and the indentation reduced modulus (Er) by plotting CT as a function of Ac:
(9)
Calculate the corrected contact area:
(10)
Adjust the contact depth as a function of the contact corrected area to Equation 11, where Ai are fitting parameters:
(11)
Correct indentation data for the machine compliance:
(12)
Using the new area function (Equation 11), the iterative calibration procedure is repeated several times until convergence is achieved
In Equation 7 the constant 0.75 is usually named ε and is a parameter which depends on the indenter geometry and material properties3,11, and usually takes values from 0.72 to 0.78 for a Vick-P,
Depth h (m) Loading
Unloading Pm
hf hc hm
hm Su = dP/dh
(N)
Load
Figure 1. Schematic representation of indentation load-displacement data, showing the main parameters: Pm: peak indentation load; hm indenter displace-ment at peak load; hc contact depth; hf final depth of the contact impression
after unload and Su initial unload stiffness3.
hs
hm
hc
hf
d/2
θ
Surface profile after unload
Surface profile under load
Initial surface Load P
Figure 2. Schematic representation of the impression during load and impres-sion left after unload, during a nanoindentation test3: h
s: distance form surface
ers indenter. In addition, it is worth noting that after the first iterative cycle, the raw data is corrected by the estimated machine compliance. Therefore, the total stiffness, ST, in Equation 7 is changed by the estimated sample stiffness, Su.
The method follows by conducting a series of indentation meas-urements in a harder material, such as fused silica or sapphire, to obtain information at shallower depths, but in this case the machine compliance is the one previously obtained for the soft material (alu-minum). The data produced for the soft and hard materials, contact depth, hc, and contact area, Ac, are then used together to establish a unique area function for all depth levels.
After the projected contact area, AO&P, has been calculated through Equation 11, the hardness (H) is calculated as the maximum load, Pm, divided by AO&P (Equation 13). The elastic modulus of the speci-men, E, is calculated using Equation 9, with the reduced modulus, Er obtained from Equation 3.
(13)
Although, the iterative O&P method has many advantages, its use has been limited for different reasons. Firstly, it is mathematically and time intensive. Secondly, Cf is subjected to large extrapolation and due to the significant dispersion in nanoindentation data, bias are created in the least squares estimative of the machine compliance, leading to an underestimation of its value9. The machine compliance can vary
significantly from specimen to specimen, and may even depend on the location of the indentation in a single specimen13. Finally, the iterative
method cannot be applied to materials that experience pile-up, since, in this case, the actual contact depth and the actual contact area would be larger than those predicted by this method, which results in an overestimation of both hardness and elastic modulus13,17-19.
Other techniques for determining the area function and machine compliance include imaging of the residual imprints by optical microscopy, scanning electron microscopy13, transmission electron
microscopy2 or atomic force microscopy20,21. In these cases, the area
function can be obtained by fitting the imaged areas as a function of the contact depths computed from the indentation load-displacement data to Equation 9. However, optical and scanning imaging of small indentations is very difficult. Transmission electron microscopy imaging requires the use of replicas, besides being a technique that is both expensive and time-consuming3. Another option refers to the
topographic characterization of the indenter through atomic force microscopy; however, it is also time consuming and requires large investments in terms of equipments and optical-laser sensors5.
The iterative method can be simplified if reference materials with known elastic modulus are used; a technique defined as the Constant Modulus Method. These known values allow the method to converge to the machine compliance, Cf, more quickly. Once the machine compliance, Cf, is known, there is no need for iteration in other materials.
Another alternative method was recently developed by O&P11,
based on an earlier idea of Joslin and Oliver22, that the ratio of the
load to the stiffness squared (Pm/Su2) can be used to determine the
ratio H/E2 without the need of determining the indenter area function.
According to O&P11, this method, defined in which follows as the
Constant Hardness and Constant Elastic Modulus Method, is valid
provided that the hardness and elastic modulus of the specimen do not vary with depth. Other authors have used similar ideas4,23,24. To
explain this method, it is useful to rewrite some of the equations used above. Equations 9 and 13 can be combined as:
(14)
which can also be written as:
(15)
and also as:
(16)
The Constant Hardness and Constant Elastic Modulus Method is organized as follows: A plot of CT as a function of 1/√Pm provides Cf as the intercept and the slope is related to the hardness and the reduced modulus (Equation 14). Note that under these conditions, there is no necessity of knowing the area function a priori, neither of an iterative procedure, however, the use of Equation 14 has the same large extrapola-tions problems than Equation 9. The Constant Hardness and Constant Elastic Modulus Method follows correcting the raw data by a value of –PCf (Equation 12), which allows the calculation of the unload speci-men stiffness, Su, at different loads. In practice, to obtain the machine compliance, only indentations in reference materials, obtained at high loads must be used, in order for the effect of the tip roundness to be negligible and, therefore, for hardness to be constant.
Then, Equation 7 (with ST substituted by Su) and Equation 15 provide the contact depth, hc, and the contact area, Ac, respectively. At this point, a non linear weighed least square fitting procedure be-tween hc and Ac, to a function with the characteristics of Equation 11, provides the area function.
In addition, once Cf is established, the ratio Pm/Su
2 is a directly
measurable experimental parameter, since Su is determined form the slope of the unloading data (Equation 6) and Pm corresponds to the maximum applied load in the indentation test. According to Equation 16, the ratio Pm/Su
2 must be constant (a material property11), since it
depends only on Er and H, and both quantities are assumed constant. Therefore, a plot of the ratio Pm/Su
2 as a function of depth or load, must
be a flat curve, at least at high loads (or depths), where the indenter tip has no effect on the hardness. Thus, the ratio Pm/Su2 provides a
manner to corroborate if the value of the machine compliance is correctly assessed11.
The calculated value of Pm/Su2 can also be compared with
theo-retical ones, but care must be taken in the hardness value that will be used, because the contact area measured in nanoindentation tests is the area at maximum load, defined by the indentation contours, rather than by the diagonals11,13,25.
Although, the idea of using the ratio Pm/Su
2 to corroborate the
ac-curacy of the machine compliance was recently developed by Oliver and Pharr, no other works have explored it.
In this work, the applicability of the different methods for the calibration of the machine compliance and calibration of area function was initially investigated based on measurements conducted on differ-ent materials. In particular, it was analyzed if the procedure described above for the Constant Hardness and Constant Elastic Modulus Method provides values of area function and machine compliance comparable with those provided by other methods.
In addition, the effect of tip radius on the ratio Pm/Su
2 was also
stud-ied. Other issues related to initial contact depth, thermal drift, contact stiffness, unloading curve and tip roundness are also discussed.
3. Experimental Procedure
3.1. Materials
proper-ties and homogeneous structure. Polycrystalline sapphire, aluminum (1100), glass (standard reference material provided by Fischerscope), steel (standard reference material with 695 HV), high purity copper and polycrystalline titanium were also used. The aluminum speci-men was mechanically polished and finished until 0.025 µm with silica colloidal with the aim of eliminating mechanical hardening. This procedure was conducted in accordance to the work by O&P3,
although it is recognized that electropolishing would probably be more efficient in removing all mechanically worked material.
The elastic modulus values reported for materials in Table 1 was measured by standard acoustic methods26 and the other values in
Table 1 were extracted from the literature.
3.2. Equipment and indentation procedure
Indentations were conducted on a Fischerscope H100V depth-sensing machine, manufactured by Helmut Fischer GmbH and equipped with a Vickers diamond indenter. In this work, care was taken in order to analyze indentation tip roundness and its effects on the results.
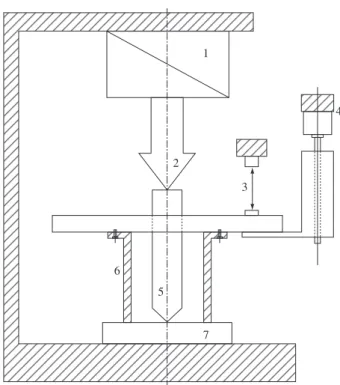
A schematic representation of the head of a Fischerscope H100V machine is shown in Figure 3. It is possible to observe that this ma-chine has a reference ring.
A series of indentations were conducted following the sequence shown in Figure 4, with load values between 10 and 1000 mN. In each loading and unloading cycle, 200 data points were acquired in steps of 0.1 s at a constant dP/dt ratio. Although this equipment is also capable of applying the load according to a “Squared law”, constant d√P/dt27, the latter was avoided. After loading, a dwell time of 30 s at
the peak load was used for the harder materials and 60 s were selected for the softer materials, with the aim of reducing creep effects28. A
dwell time of 30 s was also implemented at the end of the unloading step in order to evaluate thermal drift effects3,7,25,28.
It is important to mention that the Fischerscope H100V equipment does not allow the application of a series of loading-unloading cycles to minimize the reverse plastic effects during the last unload cycle. However, Simões28 has demonstrated, in a similar machine, that the
dwell time at maximum load is also efficient in this regard. At least, eight indentation curves were obtained for each value of maximum load and only the five within two standard deviations from the average Pm/Su
2 ratio were used in the analysis. After the
series of indentations in each specimen, the indenter was cleaned by impregnation with drop of alcohol and conduction of an indentation in Polymethyl methacrylate, PMMA, which, due to its electrostatic action, helps with the removal of adhered particles.
The zero-point for the measurement of the load-displacement curve, which is affected by specimen roughness29 and other machine
and software parameters1,25, was obtained by a polynomial fitting of
the first fifteen data points of indentation depth during loading, fol-lowed by the extrapolation to zero load25.
For the aluminum specimen, the residual imprints at high maxi-mum loads (from 50 to 1000 mN) were measured by direct obser-vation in an optical microscope BX60M Olympus, equipped with a Leica image analysis software. For all materials, the diagonals of the
1
2
6
5
7 3
4
Figure 3. Schematic representation of head system measurement of a Fischercope H100V machine: 1) electro-magnetically load system; 2) force; 3) displacement sensor; 4) motor; 5) indenter; 6) reference ring; and 7) speci-men27.
Table 1. Materials used in indentation studies. Elastic modulus and poisson’ ratio were measured by acoustic methods except for sapphire and titanium specimens.
Material E
(GPa)
HV0.1 (GPa)
Poisson ratio
Fused silica(a) 72.90±0.52 6.7 0.160±0.008
Aluminum (1100) 67.90±1.95 0.27 0.356±0.007 Sapphire 430 – 460(b) 18 0.21 – 0.27(b)
Glass(c) 72.50±0.42 5.2 0.230±0.005
Steel(d) 212.50±1.22 6.8 0.280±0.002
Copper 99.99% 116.6±0.1 1.1 0.360±0.001 Titanium 99.99% 107.0 – 112.5(b) 1.95 0.340 – 0.354(b)
(a)Standard calibration sample from CSM instruments; (b)Values obtained
from CES EduPack Software R; (c)Standard calibration sample from Helmut
Fischer GmbH; and (d)Asahi Oio Hyogo Japan standardized block for hardness
700 HV Buehler Ltd ISO 4547,
Time (s) P,
(N)
Creep at maximum load
Creep at 0.4 mN
Load Unload
Load
residual impressions obtained at a maximum load of 1000 mN were used to calculate the Vickers hardness values presented in Table 1.
4. Results and Discussion
4.1. Zero reference contact point and thermal drift
The reference ring (Figure 3) provides the advantage of acquir-ing a first reference point duracquir-ing an indentation, and, consequently, a better precision in setting the zero reference point. The Fischerscope equipment detects the zero reference point by extrapolation from the first three incremental load steps27. However, although very low
loads are applied in this initial contact stage, little penetration will always be present and must be taken into account25. Figure 5 shows
a typical plot of the initial load data obtained for fused silica. In all specimens under study, corrections for this initial penetration were always lower than 5 nm, which demonstrates the advantage of the reference ring in setting the zero reference point.
Another advantage of this ring is related to the thermal drift. Fol-lowing the results obtained by Simões28, only the data after 20 s of
creep at 0.4 mN were used to calculate the thermal drift coefficients, which always resulted in values lower than –0.3 nms–1. This value
is in the same order of magnitude of that of the newer instruments, which are designed with better materials, i.e., materials with lower thermal expansion coefficient than those in the Fischerscope25. The
fact that thermal expansion is low in the Fisherscope equipment is due to the fact that the ring moves together with the measurement head, thus compensating elastic recoils, such as those due to frame compliance and thermal drift.
4.2. Unloading data
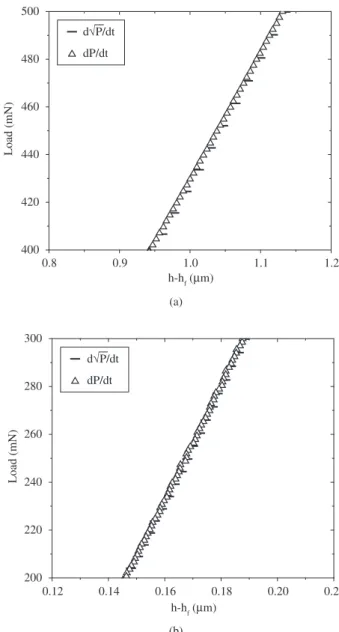
In theory, if the material hardness is constant, a linear dependence will exist between dh/dt and d√P/dt. For this reason, some machines are designed with the possibility of maintaining the ratio d√P/dt con-stant (i.e., concon-stant deformation rate), as in the case of Fischerscope machines. Figure 6 shows the difference between acquiring the data with constant d√P/dt ratio and with constant dP/dt ratio, in the unloading portion close to the maximum load of the load-unload cycle. It is clear that when a constant d√P/dt ratio is used, less data is acquired close to the maximum load. This fact occurs because at high depths the contact stiffness rises and large increases in load are required to obtain little
increase in depth. Therefore, since this part of the unload curve is the one selected to provide the unload stiffness, a less precise measurement of Su is obtained when constant d√P/dt is used, in comparison with the data obtained with constant dP/dt ratio. Therefore, in this work constant dP/dt ratio was selected during the load-unload cycles.
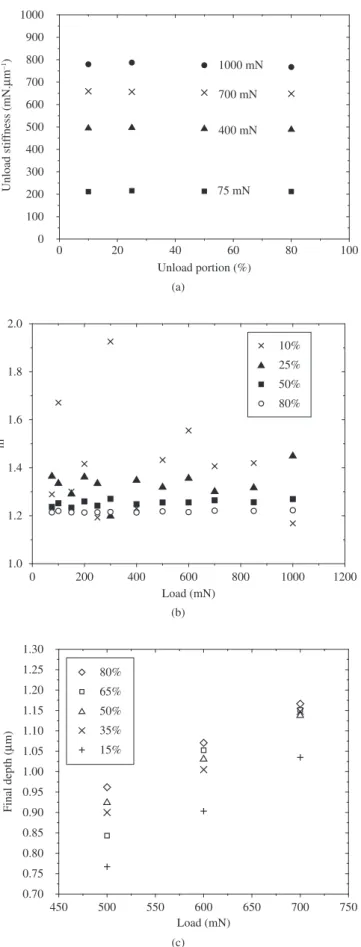
Figure 7a shows the variation of the unload stiffness as a function of the portion of the unload curve used to analyze unload data, for dif-ferent values of peak load. These values were obtained by fitting the unload data to Equation 5. Figure 7a indicates that, for fused silica, results were only slightly susceptible to the portion of the unload data chosen, particularly when less than 50% was selected. However, pa-rameters such as hf and m (Equation 5) were highly dependent on the unload portion, as illustrated in Figure 7b,c. It is worth to mention that hf diminished with the unload portion down to unrealistic values, which is a result of the mathematical fitting, especially for materials with low hf/hm ratio, i.e, those with high elastic recovery during unloading. In this work, 50% of the unload data was adopted for the analysis.
0.00 0.05 0.10 0.15 0.20 0.25
0.000 0.001 0.002 0.003 0.004 0.005 0.006 0.007 0.008 0.009
h (
µ
m)
P (mN) Raw data
Corrected by h0
Figure 5. Initial depth correction for fused silica.
Figure 6. Unloading data acquired for a) fused silica; and b) aluminum close to maximum loads of 500 mN (constant d√P/dt ratio) and 300 mN (constant dP/dt ratio) respectively.
0.8 0.9 1.0 1.1 1.2
400 420 440 460 480 500
Load (mN)
h-hf (µm)
d√P/dt
dP/dt
(a)
0.12 0.14 0.16 0.18 0.20 0.22
200 220 240 260 280 300
Load (mN)
h-hf (µm)
d√P/dt
dP/dt
4.3. Machine compliance
4.3.1. Machine compliance through constant hardness and
elastic modulus method
The iterative O&P method did not converge when both Cf and Er were unknown, neither when the elastic modulus was substituted for the one measured by acoustic methods.
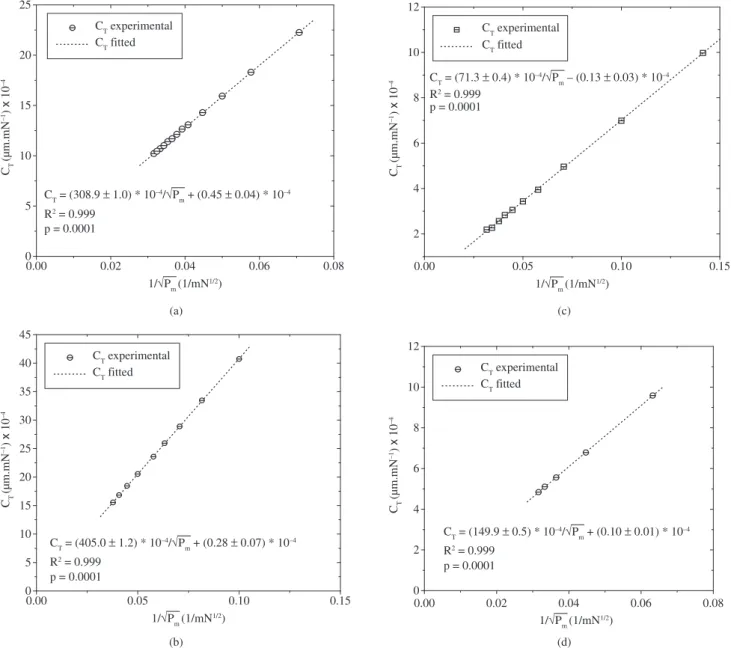
As explained in Sec. 2, through the Constant Hardness and Con-stant Elastic Modulus Method, a plot of CT as a function of 1/√Pm (Equation 14) provides the machine compliance as the intercept. This procedure was implemented, and results are shown in Figure 8.
For fused silica, the use of the data obtained at loads above 800 mN was avoided due to the propagation of lateral cracks, as shown in Fig-ure 9. This extensive damage of the surface probably affected the shape of the unload curve25. Figure 8 indicates that, even when the specimens
were tested in the same region of the XY stage, the values of the machine compliance were not unique. When testing glass, fused silica and sap-phire, values were equal to 0.045, 0.028 and 0.001 nm.mN–1, respectively
(Figures 8a,b,c). Standard errors are reported on Figure 8.
An important issue with respect to machine compliance is the clamping of the specimen onto the XY stage by the reference ring, as explained in Sec. 4.1. Since the measuring head travels together with the reference ring, the machine hardly suffers deformation and, consequently, the measured compliance will be lower compared with that of other types of equipment; typically ten times higher (see values reported in Sawa6 for various machines).
It is important to add that, in the literature, the value of Cf obtained for a similar machine was approximately equal to 0.04 nm.mN–1 4,7,
which is close to the values obtained in present work, for glass and fused silica (Figures 8a,b).
Figure 8d indicates that the value of machine compliance cal-culated for the aluminum specimen was different from those calcu-lated for the other specimens. This result is probably associated to a hardened layer on the aluminum specimen, in spite of the care taken during preparation. This hardened layer was confirmed by calculation of hardness values measured as the maximum load divided by either the corner to corner area (ACC) or the real contact area inside indenta-tion borders (Ar) (Figure 10), both based on measurements conducted with the Leica image analysis software. This variation in hardness precludes the use of the Constant Hardness and Constant Elastic Modulus Method for the evaluation of the machine compliance.
For the aluminum specimen, the intercept of the graph of CT as a function of 1/√Pm provided a value of machine compliance of –0.013 nm.mN–1, Figure 8d. The accuracy of the calculated value of
Cf was assessed in the following manner: The second right hand term of Equation 14, i.e., the slope of CT vs. 1/√Pm (Figure 8d) is related with the hardness H and the elastic modulus E. Therefore, any E or H can be found, provided one of them is known. In this work, both were known. The elastic modulus is reported in Table 1 (67.9 GPa) and the true hardness is reported in Figure 10, being equal to 0.27 GPa. Using the hardness and the slope of Equation 14, an elastic modulus of 63 GPa was obtained, which is 8% lower than the expected value (67.9 GPa). Thus, due to the aluminum hardened layer, the use of a measured value of hardness did not provide the measured value of elastic modulus, which suggests that the Cf value reported in Figure 8d is incorrect.
4.3.2. Machine compliance: direct imprint measurement
method with the aluminum specimen
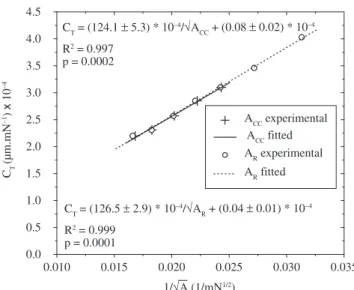
Since the constant hardness method did not work properly for the calculation of Cf for the aluminum specimen, the procedure of plotting the contact compliance CT as a function of 1/√Ac, with Ac measured by imaging methods (Equation 9), was implemented2,13; this
Figure 7. a) Unloading stiffness Su; b) m constant of Equation 5; and c) final unloading depth hf, as function of both the peak load, Pm, and the percentage
of the unload data respect the maximum load used to obtain these parameters for fused silica.
0 20 40 60 80 100
0 100 200 300 400 500 600 700 800 900 1000
75 mN 400 mN 700 mN 1000 mN
Unload stif
fness (mN.
µ
m
–1)
Unload portion (%)
(a)
0 200 400 600 800 1000 1200
1.0 1.2 1.4 1.6 1.8 2.0
m
Load (mN)
10%
25%
50%
80%
(b)
450 500 550 600 650 700 750
0.70 0.75 0.80 0.85 0.90 0.95 1.00 1.05 1.10 1.15 1.20 1.25 1.30
Final depth (
µ
m)
Load (mN) 80%
65%
50%
35%
15%
0.00 0.02 0.04 0.06 0.08 0
5 10 15 20 25
CT
(µm.mN
–1)
x
10
–4
p = 0.0001
CT experimental
CT fitted
CT = (308.9 ± 1.0) * 10–4/√P
m + (0.45 ± 0.04) * 10 –4
R2 = 0.999
1/√Pm (1/mN1/2)
(a)
0.00 0.05 0.10 0.15
2 4 6 8 10 12
CT
(µm.mN
–1)
x
10
–4 CT = (71.3 ± 0.4) * 10
–4/√P
m – (0.13 ± 0.03) * 10 –4
R2 = 0.999
p = 0.0001
CT experimental
CT fitted
1/√Pm (1/mN
1/2)
(c)
0.00 0.05 0.10 0.15
0 5 10 15 20 25 30 35 40 45
CT
(µm.mN
–1)
x
10
–4
R2 = 0.999
p = 0.0001
CT experimental
CT fitted
1/√Pm (1/mN
1/2)
CT = (405.0 ± 1.2) * 10–4/√P
m + (0.28 ± 0.07) * 10 –4
(b)
0.00 0.02 0.04 0.06 0.08
0 2 4 6 8 10 12
CT
(µm.mN
–1)
x
10
–4
CT = (149.9 ± 0.5) * 10–4/√P
m + (0.10 ± 0.01) * 10 –4
R2 = 0.999
p = 0.0001
CT experimental CT fitted
1/√Pm (1/mN
1/2)
(d)
Figure 8. Variation of total compliance CT as function of 1√Pm for: a) glass; b) fused silica; c) sapphire; and d) aluminum samples.
1500 nm
Figure 9. Indentation on fused silica at 1000 mN, showing the lateral cracks that have emerged to the surface during unload.
0 200 400 600 800 1000 1200
0.00 0.05 0.10 0.15 0.20 0.25 0.30 0.35 0.40
Hardness (GP
a)
Load (mN)
Hardness - corner to corner area (HCC)
Hardness - enclose area (HR) C
C
C C
Ar
Acc
method is referred as direct imprint measurement method. This kind of plot is shown in Figure 11 for the aluminum alloy. It is possible to observe that both the corner to corner (i.e. the one calculated as the diagonal squared) and real contact (i.e. the one calculated by means of the borders of the impression) areas produced similar results. However, the values of the real contact area must be employed in order to reduce the effect of material deformation (pile-up/sink-in). In this case, a machine compliance of 0.004 nm.mN–1 and a slope of
1.265 x 10⁻⁴ were obtained. The accuracy of the calculated C f was
proved in a similar manner to that employed in Sec. 4.3.1, but us-ing Equation 9. In this case, an elastic modulus of 67 ±1 GPa was obtained, which is close to the expected one. Thus, in the case of the aluminum specimen the direct imprint measurement method provided a result in better agreement with the expected one.
4.4. Ratio of load to the stiffness squared (P
m
/S
u 2)
Figure 12 shows the ratioPm/ST2 (before C
f correction) and also the
ratio Pm/Su 2 (after C
f correction) for each one of the materials studied in
Sec. 4.3.1. The Cf values used for fused silica, glass and sapphire, were Figure 11. Variation of the total compliance CT against 1/√Ac for aluminum.
0.010 0.015 0.020 0.025 0.030 0.035 0.0
0.5 1.0 1.5 2.0 2.5 3.0 3.5 4.0 4.5
ACC experimental ACC fitted AR experimental
AR fitted
CT
(µm.mN
–1)
x
10
–4
1/√A (1/mN1/2)
CT = (126.5 ± 2.9) * 10
–4/√A
R + (0.04 ± 0.01) * 10 –4
CT = (124.1 ± 5.3) * 10–4/√A
CC + (0.08 ± 0.02) * 10 –4
R2 = 0.999
p = 0.0001 R2 = 0.997
p = 0.0002
0 200 400 600 800 1000 1200
8.0 8.5 9.0 9.5 10.0 10.5 11.0
Pm /Su
2 (1/GP
a)
x
10
–4
Load, Pm (mN)
Uncorrected compliance Corrected compliance
(a)
0 200 400 600 800 1000 1200
1.95 2.00 2.05 2.10 2.15 2.20 2.25 2.30 2.35 2.40 2.45
Uncorrected compliance Corrected compliance Pm
/S
u
2 (1/GP
a)
x
10
–4
Load, Pm (mN)
(c)
0 200 400 600 800 1000 1200
15.0 15.5 16.0 16.5 17.0 17.5 18.0 18.5 19.0
Pm /Su
2 (1/GP
a)
x
10
–4
Load, Pm (mN)
Uncorrected compliance Corrected compliance
(b)
0 200 400 600 800 1000 1200
0.30 0.35 0.40 0.45 0.50 0.55
Pm /Su
2 (1/GP
a)
x
10
–4
Load, Pm (mN)
Uncorrected compliance Corrected compliance Theoretical β = 1.000 Theoretical β = 1.012
(d)
Figure 12. Variation of the P/S2 ratio for the uncorrected machine compliance C
f vs. the maximum load for a) glass; b) fused silica; c) sapphire; and
those found by the Constant Hardness and Constant Elastic Modulus Method in Sec. 4.3.1 (Figures 8a,b,c), while for aluminum the value was that found by the direct imprint method Sec. 4.3.2 (Figure 11). As stated in Sec. 2, to assess the accuracy of the calculated machine compliance, the ratio Pm/Su
2 must remain constant at relative high loads,
which allow avoiding effects of tip roundness on this parameter11. This
is not the same case when Equation 9 is used to find out Cf, because, as it was proved by Suganuma et al.10, tip roundness still plays an
important role on the contact area even at high depths. Then, Cf values found in Figure 8 which assumes a Pm/Su
2 constant ratio as is verified on
Figure 12, for fused silica, glass and sapphire, will be only influenced by experimental errors and for extrapolation of the adjusted data to zero. Thus, results shown in Figure 12 for these materials lead to the conclusion that the machine compliances were, within experimental error, correctly assessed in each of these three cases. The values of Pm/Su2 for fused silica, sapphire and glass at high depths were 0.00165,
0.000220 and 0.00095 GPa–1, respectively, with a standard deviation
less that 3%. Thus, it can be concluded that the machine compliance also depends on the sample mounting, which can be due in part to the reference ring system, because depending on the mechanical properties of the material it could slightly deform the surface sample in which it is sitting on.
Figure 12b also shows that for the fused silica there was an increase in both the value and standard deviation of the ratio Pm/Su
2 at loads greater than 800 mN, (Figure 12b), which is probably
due to the extensive damage of the specimen surface (Figure 9), as explained in Sec. 4.3.1.
It is instructive to compare the theoretical results of the ratio Pm/Su 2
(calculated using the right had side of Equation 16 with those obtained experimentally (directly from the unload slope and maximum load). Considering that in literature the hardness values reported for fused silica vary from 8 to 10 GPa25 and that its reduced elastic modulus
Er is about 69 GPa, and assuming a β value of 1.012, the theoretical Pm/Su2 values for this material, would be between 0.00127 and
0.00158 GPa–1. Values in this range were reported, for example,
by Oliver and Pharr11 (0.0015 GPa) and also by Fischer-Cripps25
(0.00145 GPa–1, obtained using H = 9.45 GPa and β= 1.034 for
Berkovich indenter). In the present work, the experimental value of the ratio Pm/Su2 for fused silica was 0.00165 GPa, for loads ranging
from 75 to 700 mN, Figure 12b, which is out of the theoretical range. In order to explain this difference, it is necessary to observe that the literature generally reports that loading and unloading curves are only a function of indenter geometry and elastoplastic properties. However, from the investigations of Cheng and Cheng30,31, based
on dimensional analysis for a perfectly rigid indenter, they proved that the load behavior also depends on the indenter tip roundness, according to Equation 17:
(17)
Besides, it is also possible to prove that the unload behavior fol-lows Equation 1832,33:
(18)
In Equations 17 and 18 ΠL and ΠU are dimensionless functions of: the yield strength Y, the elastic modulus E, the indenter tip radius R, the Poisson’s ratio ν, the hardening index η, the indenter angle θ, the load P, the depth h, and the maximum depth hm.
Using Equations 17 and 18, we have recently proved that33:
(19)
This equation shows that the β factor depends on indenter geom-etry, the ratio R/hm, and some of the specimen mechanical properties.
This dependence explains why, in order to obtain a correct hardness or elastic modulus, the β factor must be modified depending on the tip roundness-material combination, as reported by Troyon15,16. For
example, higher values of β may lead to a decrease in the theoreti-cal ratio Pm/Su215,16. In this work, a value of β of about 1.045 would
produce values of ratio Pm/Su
2 approximately equal to 0.0015 GPa–1
for fused silica, which is on the expected range. On the other hand, such high value of β would produce higher hardness values (Equa-tions 16), which, in our case, would be of approximately 11 GPa, for fused silica, which is a slightly high in comparison with common literature reported values.
Figure 12d shows a different situation in the case of the aluminum specimen. This behavior is explained by its variation in hardness. As indicated in Figure 10, higher hardness values were obtained for the aluminum specimen at lower loads. Therefore, at lower loads, Equation 16 predicts an increase in the ratio Pm/Su
2. Figure 12d also
shows that, contrary to the case of fused silica, the value of β must be equal to 1, i.e, less than the theoretical one (1.012), in order for the calculated value of Pm/Su
2 to be close to the theoretical one.
Although the results have shown that the machine compliance must be established according to the mounting sample, in the Fischerscope H100V machine the omission of this correction does not impose sig-nificant errors in the results, because Cf is very low. For example, in the worst cases, at the highest load (1000 mN), for sapphire and aluminum, the error in the contact depth is of about 0.2 and 0.03%, respectively, which are negligible considering that the indentation techniques are characterized by a relatively high dispersion in the results9.
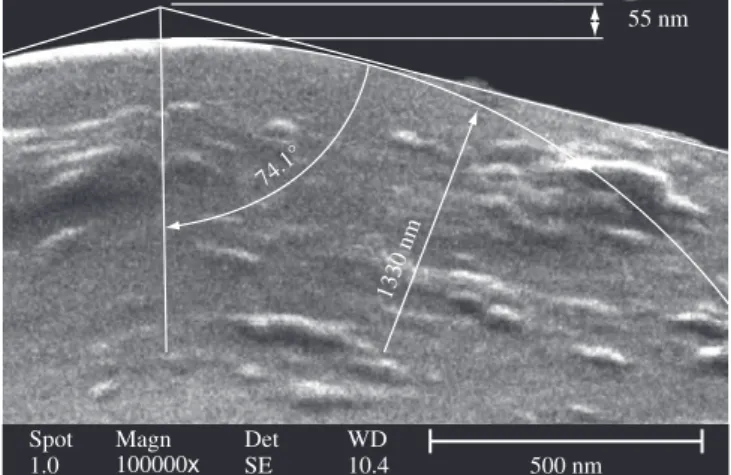
As the indenter has a tip radius of 1.33 µm, some parameters could be affected by the depth/tip radius ratio particularly at low values of it, as is the case for the β factor. This is one of the reasons why we avoid in our analysis the first 150 nm. However, according to ref. 10, the contact depth is not influenced by the maximum depth/ tip radius (See Figure 7 in ref. 10). Thus the area function can be already determined according to the O&P procedure as illustrated in next section.
4.5. Area function
Figure 13 indicates that an indenter with a tip radius of approxi-mately 1.33 µm, was used in all indentations. Figure 13 also shows some transferred particles of aluminum after indenting; particles that were eliminated by the careful procedure described in Sec. 3.2. The following paragraphs will discuss other implications of this high tip roundness, as well as two methods to calculate the area function of this rounded tip indenter.
55 nm
74.1°
1330 nm
Spot 1.0
Det SE
WD
10.4 500 nm
100000x
Magn
4.5.1. Iterative O&P method
The iterative O&P method was applied to find both the machine compliance and the elastic modulus of all the materials studied above, but the method did not converge in any case. Even when the correspond-ent elastic modulus was substituted in the respective equations, i.e. when the O&P Constant Elastic Modulus Method was used, the convergence to Cf was not obtained. Three explanations are possible in this case. First, the machine compliance is very low and, therefore, is very sensi-tive to the large extrapolations involved in Equation 9. Second, even at relative high depths, the relatively large tip radius leads to higher values of the first estimated ideal contact area, in relation to the real area10.
In other words, the slope of Equation 9 will be much higher than the ideal one and, therefore, the first elastic modulus will be overestimated. Third, the dependence of β factor on the ratio R/hm is accentuated at low depths. With the rounded tip used in present work, this influence possible extent until considerable depths. Therefore, under these condi-tions the iterative O&P method will hardly converge.
4.5.2. Constant modulus and constant hardness method
An alternative procedure was implemented, based on the assump-tion that the hardness and the elastic modulus are constant and known11.
After correction of the data by initial depth, thermal drift and machine compliance, as established in Sec. 4.3, the contact area was calculated based on Equation 15 for each contact depth, using the standard glass calibration specimen and a β factor equal to 1.012. Later on, a non linear least square interpolation of these data to (Equation 11), weighed by the inverse of the maximum depth25, was conducted and led to the area
function shown in Equation 20, in which hc is in µm:
(20)
Equation 20 is valid for depths higher than 150 nm. This dis-tance is higher than the transition disdis-tance from the rounded part of the indenter to the straight sides of the indenter. Under 150 nm, Equation 20, produces a high dispersion, which is probably due to a combination of specimen surface roughness and to the fact that the rounded tip shape is not perfectly spherical.
4.6. Hardness and elastic modulus
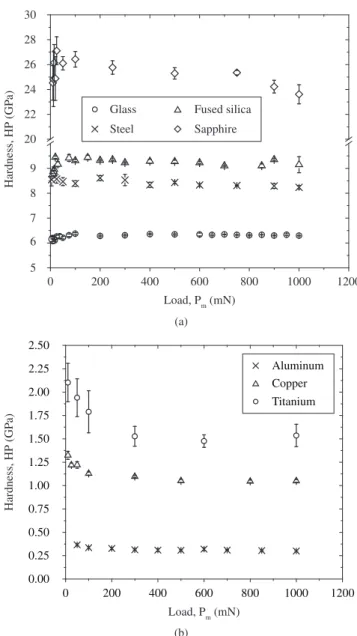
To assess the validity of the area function presented in Equation 20, copper, steel and titanium specimens were also tested at different loads. A machine compliance of 0.02 nm.mN–1 was used in these cases (an
average of the compliances obtained for aluminum, fused silica, sap-phire and glass). The values of the hardness and elastic modulus of these materials are shown in Figures 14 and 15. A comparison of elastic modulus values with those on Table 1, indicates that the area function obtained in this work, in conjunction with the assumed machine compli-ance, produced measurements with differences lower than 6% for all materials, except for sapphire, for which the measured value presents a difference lower than 10% with respect to the expected one. How-ever, a close inspection, for example in the case of fused silica, shows mean values of 68.13 ± 0.5 for its elastic modulus and 9.2 ±0.18 for its hardness. The difference of the obtained elastic modulus 68.13 with respect to that measured by acoustic methods 72.9 can be explained by the fact that the β factor used in this work (1.012) is less than the true value for this material, as discussed in Sec. 4.4.
5. Conclusions
The ratio Pm/Su2 proved to be a very helpful parameter to assess
the quality of the analysis of depth-sensing indentation data; to obtain
0 200 400 600 800 1000 1200
5 6 7 8 9 20 22 24 26 28 30
Hardness, HP (GP
a)
Load, Pm (mN) Fused silica
Sapphire Glass
Steel
(a)
0 200 400 600 800 1000 1200
0.00 0.25 0.50 0.75 1.00 1.25 1.50 1.75 2.00 2.25 2.50
Hardness, HP (GP
a)
Load, Pm (mN)
Aluminum Copper Titanium
(b)
Figure 14. Hardness values vs. the maximum load for the tested materials.
0 200 400 600 800 1000 1200
0 50 100 150 200 250 300 350 400 450
Sapphire
Fused silica Copper
Titanium Glass
Steel
Elastic modulus, E (GP
a)
Load, Pm (mN)
the area function and to verify if machine compliance was correct as-sessed. This ratio can be used to study conventional nanoindentation machines without CSM capability. However, results suggest that this parameter could be not strictly a material parameter due to possible influences by the tip roundness of the indenter. Taking into account that
β factor also varies depending on the material and on the tip roundness, the area function calibrated with a reference material is always biased for other materials. However, this deviation was lower than 6% for the majority of the materials and the machine studied in this work.
Results obtained in this work have shown that good calibra-tions of the area function are possible, even if a highly rounded tip indenter is used.
The fused silica standard specimen, commonly used to calibrate nanoindenter machines, must be employed with caution at high load levels, due to the extensive damage produced, characterized by lateral cracks that emerge to the specimen surface during unload, affecting the contact unload stiffness.
A detailed study on a Fisherscope H100V machine confirmed that machine compliance varies depending on the sample mounting. Therefore, if accurate measurements must be obtained, this compliance needs to be established for each material under study, each time that a test is performed. However, since the machine compliance is low, errors lower than 0.2% in contact depth were obtained in this work.
Similar to the machine compliance, thermal drift and initial contact depth also resulted in little impact in the results. This is due to the refer-ence ring incorporated in the machine, which travels with the specimen and protects the indentation zone from the surrounding environment.
Acknowledgments
The authors would like to acknowledge the support for this re-search provided by the Instituto Colombiano para el Desarrollo de la Ciencia y la Tecnología ‘Francisco José de Caldas’ (COLCIENCIAS), by National doctoral grant program and by The State of Sao Paulo Research Foundation (FAPESP).
References
1. Fischer-Cripps AC. Review of analysis methods for sub-micron indenta-tion testing. Vacuum. 2000; 58(4):569-585.
2. Doerner MF, Nix WC. A method for interpreting the data depth-sensing indentation instruments. J. Mater. Res. 1986; 1(4):601-609.
3. Oliver WC, Pharr GM. An improved technique for determining hardness and elastic modulus using load and sensing indentation experiments. J. Mater. Res. 1992; 7(6):1564-1583.
4. Seitzman L. Mechanical properties from instrumented indenta-tion: Uncertainties due to tip-shape correction. J. Mater. Res. 1998; 13(10):2936-2944.
5. Herrmann K, Jennett N, Wegener W, Meneve J, Hasche K, Seemann R. Progress in determination of the area function of indenters used for nanoindentation. Thin Solid Films. 2000; (377-378):394-400.
6. Sawa T, Tanaka K. Simplified method for analyzing nanoindentation data and evaluating performance of nanoindentation instruments. J. Mater. Res. 2001; 16(11):3084-3096.
7. Antunes J, Cavaleiro A, Menezes L, Simões M, Fernandes J, Ultra-mi-crohardness testing procedure with vickers indenter. Surf. Coat. Technol. 2002; 149(1):27-35.
8. Franco ARJ, Pintaúde G, Sinatora A, Pinedo CE, Tschiptschin AP. The use of vickers indenter in depth sensing indentation for measuring elastic modulus and vickers hardness. Mater. Res. 2004; 7(3):483-491. 9. VanLandingham MR. Review of instrumented indentation. J. Res. Natl.
Inst. Stand. Technol. 2003; 108(4):249-265.
10. Suganuma M, Swain MV. Simple method and critical comparison of frame compliance and indenter area function for nanoindentation. J. Mater. Res. 2004; 19(12):3490-3502.
11. Oliver WC, Pharr GM,. Measurement of hardness and elastic modulus by instrumented indentation: Advances in understanding and refinements to methodology. J. Mater. Res. 2004; 19(1):3-20.
12. Hay JL, Pharr GM. Instrumented indentation testing, In: ASM Handbook Volume 8, Mechanical Testing and Evaluation, 10 ed., 2000, p. 232-243. Materials Park, OH.
13. McElhaney K, Vlassak J, Nix W. Determination of indenter tip geometry and indentation contact area for depth-sensing indentation experiments, J. Mater. Res. 1998; 13(5):1300-1306.
14. Pharr GM, Oliver WC, Brotzen FR. On the generality of the relation-ship between contact stiffness, contact area, and elastic modulus during indentation. J. Mater. Res. 1992; 7(3):613-617.
15. Troyon M, Huang L. Correction factor for contact area in nanoindentation measurements. J. Mater. Res. 20(3):610-617.
16. Troyon M, Huang L. Critical examination of the two-slope method in nanoindentation. J. Mater. Res. 2005; 20(8):2194-2198.
17. Baker SP, Nix WD. Mechanical properties of compositionally modulated au-ni thin films: Nanoindentation and microcantilever deflection experi-ments, J. Mater. Res. 1994; 9(12):3131-3144.
18. Bolshakov A, Pharr GM. Influences of pile-up on the measurement of mechanical properties by load and depth sensing indentation techniques, J. Mater. Res. 1998; 13(4):1049-1058.
19. Li Z, Cheng YT, Yang HT. S. Chandrasekar, On two indentation hardness definitions. Surf. Coat. Technol. 2002; 154(2-3):124-130.
20. Kese KO, Li ZC, Bergaman B. Method to account for true contact area in soda-lime glass during nanoindentation with berkovich tip. Mater. Sci. Eng. 2005; A 404(1-2):1-8.
21. Miyahara K, Nagashima N, Matsuoka S. Development and application of a combined atomic force microscopy-nanoindentation system with a silicon tip and a diamond. Philos. Mag. 2002; A 82(10):2419-2160.
22. Joslin D, Oliver W. New method for analyzing data from continuos depth-sensingmicroindentation tests. J. Mater. Res. 1990; 5(1):123-126.
23. Stone DS, Yoder KB, Sproul WD. Hardness and elastic modulus of tin based on continous indentation technique and new correlation. J. Vac. Sci. Technol. 1991; 19(4):2543-2447.
24. Gong J, Miao H, Peng Z. On the contact area for nanoindentation tests with berkovich indenter: case study on soda-lime glass. Mater. Lett. 2004; 58(7-8):1349-1353.
25. Fischer-Crips AC. Nanoindentation. 1 ed. New York: Springer; 2002.
26. Meza JM, Franco EE, Buiochi F, Farias CM, Souza RM et al. Using the ultrasound and instrumented indentation techniques to measure the elastic modulus of engineering materials. to appear in Rev. Metal. Mad., 2007.
27. Weiler W. Dynamic loading. a new microhardness test method. J. Test. Eval. 1990; 18(4)229-239.
28. Simões M, Fernandes J, Cavaleiro A. The influence of experimental parameters on hardness and young’s modulus determination using depth-sensing testing, Phil. Mag. 2002; A 82(10):1911-1919.
29. Bouzakis KD, Michailidis N, Hadjiyiannis S, Skordaris G, Erkens G. The effect of specimen roughness and indenter tip geometry on the determina-tion accuracy of thin hard coatings stress-strain laws by nanoindentadetermina-tion. Mater. Char. 2002; 49(2):149-156.
30. Cheng YT, Cheng CM. Scaling, dimensional analysis, and indentation measurements. Mater. Sci. Eng. 2004; R 44:91-149.
31. Cheng YT, Cheng CM. Further analysis of indentation loading curves: Effects of tip rounding on mechanical property measurements. J. Mater. Res. 1998; 13(4):1059-1064.
32. Meza JM, Cruz J. Tip bluntness effect in mechanical properties measured through nanoindentation test. Presented at IV International congress of materials, Pereira, and in Scientia et technica. 2007; 36:613-618.