30
and Chlorine) with Tropical Aquatic Fulvic Acids Monitored by
Differential Absorbance Spectroscopy
Eduarda Regina Carvalho1*, Marcilene Ferrari Barriquello2, Patrícia Valderrama2, Paulo Henrique
Março2, Nelson Consolin-Filho2, Ladislau Martin-Neto1
1Embrapa Instrumentação Agropecuária, P.O. Box. 741, 13560-970, São Carlos-SP, Brazil;
2Universidade Tecnológica Federal do Paraná, P.O. Box. 271, 87301-006, Campo Mourão-PR, Brazil
Abstract. The interactions of tropical aquatic fulvic acids (AFA) with chlorine, chlorine dioxide and
formation of disinfection by-products, were characterized using differential absorbance spectroscopy, to explore the formation by-products, such as chloroform (CHCl3) during halogenation of natural
organic matter with chlorine and chlorine dioxide. The interactions of AFA with chlorine and chlorine dioxide were characterized by using different disinfectants concentrations (2.5, 5.0, 10.0 and 20.0 mg.L-1) after 24 h of reaction, in solutions phosphate buffer at pH 7.0. Both disinfectants promote a decrease in absorbance at 254 nm and 272 nm, with the increase of the concentration. The concentration of CHCl3 formed was extremely well correlated, with the decrease of the absorbances,
with values for R2 of 0.99, which was also observed correlating with the magnitude of the differential absorbance at -ΔA272 and -ΔA254. The differential spectrum of chlorinated natural organic matter
(NOM) has a peak near 270 nm, being more defined, in the samples with chlorine, in contrast with samples with chlorine dioxide that does not have defined peaks. Differential absorbance spectroscopy proved to be as a powerful tool in monitoring transformations in the chemical state of humic species (HS) as the aquatic fulvic acids.
Palavras-chave: formation of by-product, aquatic disinfectants, drinking water and spectroscopy
Recebido: 17 de Outubro de 2014; aceito: 17 de Novembro de 2014, publicado: 18 de Dezembro de 2014. DOI: 10.14685/rebrapa.v5i3.160
INTRODUCTION
The study of organic compounds in drinking water continues to be of intense interest. Extensive work in this research area began with the disclosure of the results of a 1974 study of New Orleans where source water contaminants were still found in treated drinking water (EPA, 1974).
Chlorine is used universally as a disinfectant in drinking water. However, it has been shown that reaction between organic compounds and halogen-based oxidants can lead to the formation of halogenated disinfection by-products (DBPs) with proven or suspected adverse heath effects (KRAMER et al., 1992). The most important and dangerous by-products are halogenated organic substances, such as trihalomethanes (THMs), haloacetic acids (HAAs) and disinfection by-products derived from the addition of Cl2 and NaOCl in the
disinfection process (ROOK, 1974; KOCH;
KRASNER, 1989; PETERS; LEER; GALAN, 1990; PRAKASH, et al., 2012; YANG, et al., 2013, ÖZDEMIR, et al., 2013).
When gaseous Cl2 is used in bleaching, for
example, considerable amounts of organochlorine compound of high molecular mass are formed. These are lipophilic, and presist in the environment. About 30 % of the organically bound chlorine in spent chlorination water and about 5 % in spent alkali water are of low relative molecular mass. Cl2 largely been
replaced by ClO2 (chlorine dioxide) in recent
years and this has reduced the formation of lipophilic organochlorine compounds considerably. Also the formation of volatile low molecular chlorinated compounds has been shown to be decreased (CARVALHO, 2003, PRAKASH; 2012).
Studies have shown that when natural organic matter (NOM) is halogenated, changes in certain portions of the absorbance spectrum of
31
the NOM can serve as a surrogate for the progress of the reactions and the concentration of DBPs (KORSHIN; LI; BENJAMIN, 1997, 1998, 1999; KARANFIL et al., 2000; WU et al., 2000; PRAKASH, et al., 2012).
In particular, it has been found that the absorbance of solutions declines monotonically with both increasing dose of free chlorine and reaction time, and that the magnitude of this decrease near 270 nm is a sensitive and reliable indicator of the formation of total organic halogen, trihalomethanes and haloacetic acids (KORSHIN; WU; XIAO, 2000).
Korshin et al. (2002), shows that the differential absorbance A, after and prior to chlorination, can be used to evaluate the formation of by-products after chlorination.
In particular, differential spectra have a well-defined peak near 272 nm, in comtrast with the conventional absorbance spectra of NOM either prior to or after chlorination, which have no identifiable peaks. Results have suggested that the -ΔA272 is correlated with the formation of
by-products as the total organic halogen (TOX) (KORSHIN; WU; XIAO, 2000). The significance of the differential absorbance is related to the fact that the ultraviolet absorbance of natural waters is attributable overwhelmingly to the diverse population of organic molecules in the water referred to collectively as natural organic matter. When the NOM molecules react with oxidants, DBPs are formed and, simultaneously, the absorbance of the NOM changes, giving rise to the differential absorbance spectrum (KORSHIN et al., 2002). The connection between organic compounds and THM, for example, is based in part on similarities in the rates of THM formation and THM yields for natural waters and extracted aquatic humic substances. The chemical basis for organic halide formation from the chlorination of humic materials is not well understood. Aquatic humic materials are thought to have a moderate aromatic character (~25% of the total carbom) with large numbers of carboxyl groups, some phenolic groups, alcohol OH groups, methoxyl groups, ketones, and aldehydes (RECKHOW; SINGER; MALCOLM, 1990). Degradative structural studies have suggested the presence of
significant phenolic content, especially when the OH groups are protected by prior methylation. This may be important because actived aromatic structures such as phenolics are known from model compound studies to be especially reactive with chlorine, producting large amounts of chlorinated by-products (SCHULTEN; GUDRUN; FRIMMEL, 1987; RECKHOW; SINGER, 1995; NORWOOD et
al., 1980).
When individual phenolic compounds that are thought to be reasonable analogs for the active functional groups in NOM are chlorinared, their absorbance almost invariably increases over most of the range from 250 nm to 400 nm. Because aromatic functional groups are thought to be both the dominant chromophores in NOM and the dominant sites of attack by chlorine on NOM molecules, the absorbance at 254 nm has frequently been proposed as indicator of the concentration of DBP precursor sites in a water sample (ROOK, 1977; BOYCE; HORNING, 1983).
However, the spectroscopic characteristics and the formation of by-products, of NOM in presence of chlorine dioxide have not been examined. In this paper, we explore the formation of by-product and relationships with absorbance a 254 nm and 272 nm, in samples of tropical aquatic fulvic acids (AFA) in presence of chlorine and chlorine dioxide, as alternate disinfectant and show the applicability of differential absorbance spectroscopy for studies of the by-product formation, as the chloroform.
MATERIALS AND METHODS
Materials Chemicals
All reagents used were high-purity grade, unless otherwise stated. Diluted acid and base solutions required for the aquatic humic substances (AHS) isolation were prepared by convenient dilution of 30% (v/v) hydrochloric acid (suprapur, Merck AG) or sodium hydroxide monohydrate (suprapur Merck AG) dissolved in high-purity waTer (Milli-Q system, Millipore). The XAD 8 adsorbent (Serva Feinbio-chemica), used for isolation of AHS, was purified before
32
use by successive soaking with 0.5 mol L-1 HCl, 0.5 mol L-1 NaOH and methanol p.a. (24 h each).
HS isolation by XAD 8 resin
The AHS’s were isolated from a sample collected from a tributary stream of River Itapanhaú within of the State Park called “Serra do Mar”. This is an environmentally protected area located in the seaboard, 7th UGRHI of 11th group of UGRHI from São Paulo State/Brazil. For this purpose, 50 liters of surface water were filtered through 0.45 µm cellulose-based membranes and acidified with concentrated HCl solution to pH 2.0. Afterwards, the AHS from the acidified sample were isolated on the XAD-8 collector (AIKEN, 19XAD-85) following the recommendations of Malcolm (1989). After elution with 0.1 mol L-1 NaOH solution, the obtained concentrate (4.5 mg mL-1 DOC equivalent to 9.0 mg mL-1 aquatic HS) was acidified to pH 2.0 with 6.0 mol L-1 HCl solution and the aquatic fulvic acid AFA (soluble fraction) were separated from aquatic humic acid (AHA) by centrifugation at 12000 rpm (40 min). The determination of dissolved organic carbon (DOC) in the aquatic HS concentrate was carried out by catalytic combustion in oxygen stream and subsequent infrared detection by Analyser Schimadzu TOC 2000 (WANGERSKY, 1993). Metal concentrations
in the AHS were determined by ICP-OES spectrometer (ROSA; ROCHA; BURBA, 2002). The studied aquatic HS are summarized in Tables 1 and 2.
Chlorination and UV Absorbance spectroscopy
AFA samples (8.0 mg L-1), with 4.0 mg L-1 of dissolved organic carbon (DOC), were treated with chlorine and chlorine dioxide, in different disinfectants concentra-tions (2.5, 5.0, 10.0 and 20.0 mg L-1), in vials of 10 ml with stirring for 10 min. Solutions were prepared in phosphate buffer (KH2PO4/NaOH) at pH 7.0, at room
temperature between 20 and 25°C. The reaction time was typically 24 h. These different disinfectants concentrations were chosen in exploratory character. All samples were placed in a dark glass bottle and sealed to protect against solar radiation (which could degrade the oxidant).
The experimental conditions to chlorination were conducted following the recommendations of the literature (APHA; AWWA; WPCF, 2005). Chlorination was carried in the presence of 0.1 M phosphate buffer at temperature between 20 ºC and 25 ºC. Chlorine stock solution was prepared by dilution of a reagent-grade sodium hypochlorite solution (5% available chlorine) with Mili-Q water.
Table 1- The humic substances from Itapanhaú Stream, São Paulo State, Brazil.
Origin Itapanhaú Stream
pH 5.0 Conductivity 58 S.cm-1 Temperature 25 C DOC 4.5 mg.mL-1 UVA254 0.2 cm-1 SUVA 254 0.044 cm-1.mg-1L
Complexation capacity 3.4 mmol Cu(II) per g DOC
Table 2- Metal concentrations as determined by ICP-OES in water and in the aquatic humic substances isolated from
Itapanhaú Stream-São Paulo State-Brazil (n=5).
Metals Concentration Watera [g.L-1] Isolated HSb [mg.L-1] Cu 79.9 0.6 20.20 1.60 Co 0.5 (LD) 0.69 0.04 Ni 11.6 0.1 3.12 0.24 Cd 0.25 (LD) 5.53 0.42 Mn 18.7 0.1 4.71 0.16 Hg 0.5 (LD) 0.04 0.00
aTotal metals in the 0.45 μm membrane filtered original sample; bAfter isolation by the XAD 8 resin procedure (concentration 250x); (LD) Limit of Detection
33
The chlorine dioxide was produced from sodium chlorite activated by HCl 10% solution (APHA; AWWA; WPCF, 2005). The concentrations of these disinfectants was measured using the N,N-diethyl-p-phenylenediamine (DPD) methods just before application. Residual chlorine was
quenched with sodium sulfite
(MASSIMILIANO; KORSHIN, 2005).
The absorbance spectra were recorded using a
Shimadzu model UV-1601 PC
spectrophotometer, with 10 cm quartz cells. The instrument baseline was established using Milli-Q water. The differential absorbance A, what is defined by the equation (1):
A = Achl - Ainit Eq. (1)
where Achl and Ainit are the absorbance of light at wavelength after and prior to chlorination, respectively, were used to evaluate the formation of by-products after chlorination, second Korshin et al. (2002).
The chloroform was analyzed using a SHIMADZU 17A, gas chromatograph equipped with an electron capture detector (ECD) and a system of Solid-Phase Microextraction (SPME). The extrations were made with standard solution (5.0 mL) of the analytes, in a bottle of 10.0 mL with bar of agitation. The thermal desorption was effected the 250 °C for 5 min in the injector of the chromatograph the gas in the mode splitless, with column CROMA-5 (30 m x 0.25 mm x 0.33 µm). The temperature program was as follows: the initial temperature of 35°C was held for 3 min and then increased at a rate of 4 °C min-1 to 44 °C (6 min) at 8 °C min-1 to150 °C. The extrations were made with the optimized parameters, for the extration of standard sample chloroform, where the fiber was kept in headspace of the solution during 5 minutes at an extraction temperature of 32 °C with equilibrium time in the “headspace” of the solution of 10 min.
RESULTS AND DISCUSSION
Figs 1a and 1b, shows a set of UV absorbance spectra for tropical acids fulvic of the River Itapanhaú from São Paulo State/Brazil subjected to chlorination with chlorine and chlorine dioxide. In both cases, of decrease UV with
increasing oxidant dose is apparent, what also it was observed with the increase of the reaction time (data not shown). It has been shown that the chlorination also produces a decrease of absorbance in chlorinated coastal and deep ocean seawater at all wavelengths >250 nm (MONSALLIER et al., 2000).
Figure 1- UV spectra for tropical acids fulvic of the River Itapanhaú from São Paulo State/Brazil chlorinated, at pH 7.0, after reaction time 24 h. In (a) with chlorine and (b) with chlorine dioxide.
The fast decrease of the absorbance to the highest values of wavelength can be the result of the break of links in the electronic structure, or the destruction of insaturated conjugated compounds, present in the structure of the dissolved organic substance (CHANG et al., 2001). The halogenation, therefore, it promotes destruction and/or alteration of cromophores present in the organic substance (KORSHIN; LI; BENJAMIN, 1997).
(a)
34
The increase of the chlorine concentration also produced changes in the form of the curves, in contrast with the samples in presence of chlorine dioxide. The decrease of the absorbance in samples with chlorine it was of 0.14 (sample in absence of chlorine) to ~0.09 (sample with lesser chlorine concentration). Sample with higher chlorine concentration, the decrease it was ~0.06. In samples with chlorine dioxide, this decrease it was of 0.14 (sample in absence of the oxidant) to ~0.08 and ~0.07 (sample with lesser and higher chlorine dioxide concentration, respectively).
In case of the chlorine dioxide, this reacts primarily by oxidation reactions resulting in few organic compounds, both volatile and nonvolatile, and in which chlorine atoms have been incorporated. Increasing dose of chlorine dioxide, increase the possibility of reaction with groups (-OH, - OCH3), presents in fulvic acids.
Probably the chlorine dioxide only breaks large molecules structures in lesser (CHANG et al., 2001).
In contrast, the chlorine reacts in solutions of organic compounds by one or more of three basic mechanisms, namely, addition, during which chlorine atoms are added to a compound; oxidation and substitution, during which chlorine atoms are replaced with some other atoms that are present in the organic reactant (MORRIS; BAUM, 1978).
In the initial reactions between Cl and NOM, virtually 100% of the Cl that reacts is incorporated into the organic molecule. However, as the reaction proceeds (i.e., as reaction time or Cl dosage increases), less and less Cl that reacts is incorporated into the NOM molecules. Instead, most if not all of the Cl that reacts later in the process is reduced to Cl- and, is released into the solution. Possibly, these differences, explain the changes observed in the spectra of absorbance for the different oxidants. The specific information about variable Cl incorporation efficiency provides important new insights into the process of DBP formation (LI; KORSHIN; BENJAMIN, 1998).
The UV absorbance spectra of pure compounds dissolved in water consist of absorbance bands with well-defined maximum values at wavelengths that correspond to the energy
needed to produce an electron in the molecule to a higher energy orbital. Most aromatic compounds have three such bands (JAFFE; ORCHIN, 1962; SCOTT, 1964). The functional aromatic groups are cromophores that constitute in large part, in dominant sites, during the attack of chlorine on molecules of the organic substance. However, aliphatic groups can also
contribute (KORSHIN; CHI-WANG;
BENJAMIN, 1996). When the NOM is halogenated, changes in certain portions of the absorbance spectrum of the NOM can serve as a surrogate for the progress of the reactions and the concentration of by-products that form (WU
et al., 2000).
It is accepted that the position at 254 nm, is mainly determined by the susceptibility of aromatical groups, and the decrease of this, suggests na attack of the oxidant in these aromatical sites, in samples of aquatic origin. This decrease, was also proposed as an indicator of the concentration of by-product precursor sites in a water (KORSHIN; LI; BENJAMIN, 1999; WU et al., 2001).
Gauthier et al. (1987), showed that wavelength at 254 nm can occur transistions π - π* in benzenes substitutes. However, at 272 nm also it such transitions can occur. Kulovara et al. (1996). Also related to the degradation of aromatics parts, present in humic substances, with the decrease of the absorbance at 272 nm. The results obtained for absorbances at 254 nm and 272 nm, in present work, between the oxidants, did not present differences. It was observed a decrease of absorbance at 254 nm with the increase of the concentration of the oxidants, varying of 0.14 (sample in the absence of the oxidants), for approximately 0.06 and 0.07 (sample with bigger concentration of both oxidants and in presence of chlorine and chlorine dioxide, respectively). At 272 nm, the decrease it was of 0.12 for 0.05 (sample with chlorine) and 0.06 (sample with chlorine dioxide).
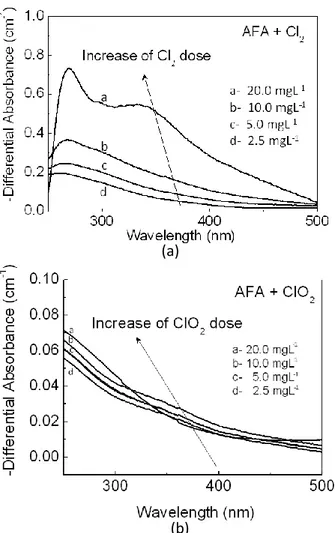
In Figs. 1a and 1b, all of the absorbance spectra are broad curves that have no identifiable peaks. In contrast, Fig. 2 shows differential spectra, which have a well-defined peak between 250 nm and 300 nm, near 270 nm. In samples with chlorine this peak is well defined, main in
35
samples with greater oxidant dose, what also it was observed with the increase of the reaction time. The band observed main in samples with bigger concentration of the chlorine, in the 340 - 380 nm range, can be attributed to aromatic chlorinated intermediates formed prior to the release of products such as HAAs and THMs (KORSHIN; BENJAMIN; XIAO, 2000). Consistent with the trends described in further details in more publications (LI; KORSHIN;
BENJAMIN, 1998); KORSHIN; WU;
BENJAMIN, 2002).
Figure 2- Differential UV spectra for tropical aquatic fulvic acids of the River Itapanhaú from São Paulo State/Brazil chlorinated, at pH 7.0, after reaction time 24 h. In (a), sample with chlorine, (b) with chlorine dioxide.
In contrast, less enhanced in the samples with dioxide chlorine, it was observed (Fig. 2). This does not present defined peaks, although the intensity of the differential spectra increased with increasing dioxide chlorine dose in region be-tween 250 nm and 300 nm).
The sign of the differential absorbance is virtually always negative, i.e., chlorination decreases the absorbance of the NOM and therefore of the solution. In particular, differential spectra have a well-defined peak near 272 nm, in contrast with the conventional absorbance spectra of NOM either prior to or after chlorination, which have no identifiable peaks and the intensity of the differential spectra grows with increasing time of chlorination or, at a given reaction time, increasing chlorine dose (KORSHIN; WU; BENJAMIN, 2002). The tropical aquatic fulvic acids, in present work and in presence of the chlorine, also presented these characteristics.
Table 3 shows the values for the differential absorbance at -ΔA254 e -ΔA272, in different
concentrations of the oxidants, obtained according Korshin et al. (2002) methodology. In contrast with the results obtained by absorbance spectra, differences were observed for the differential spectra (Table 3). The differential absorbance at 254 nm (-ΔA254),
varied from 0.20 (sample with lesser chlorine concentration) to 0.32 (sample with bigger chlorine concentration). In sample with chlorine dioxide, it varied from 0.05 (sample with lesser chlorine dioxide concentration) to 0.07 (sample with larger chlorine dioxide concentration). The differential absorbance at 272 nm (-ΔA272)
varied from 0.18 (sample with lesser chlorine concentration) to 0.73 (sample with higher chlorine concentration). In samples with chlorine dioxide, it varied from 0.04 (sample with lesser chlorine dioxide concentration) to 0.06 (sample with higher chlorine concentration) in the analyzed period.
The differential absorbance at 254 nm for sample in presence of chlorine, comparing with the samples with greater and minor concentration of the oxidant, it presented increase of 60 %. In sample with chlorine dioxide, this increase it was of 40 %. At 272 nm, the increase it was of 305% and 50 %, sample in presence of chlorine and chlorine dioxide, respectively.
These results, i.e., as increase of the differential absorbance (at 254 nm and 272 nm), evidence possible formation of byproducts and that also, possibly it is occurring degradation of aromatics
(a)
36
parts, presents in humic substances. The use of both wavelengths, presented results that agree with relation to the possible degradation of aromatics functional groups and formation of by-products.
The difference between the oxidants, with relation to the increase of the differential absorbance and increase concentration it suggests that, in the case of chlorine dioxide, although chlorine atoms are incorporated in the organic substance, these promote the oxidation of aromatics parts, oxidated faster the molecules presents in fulvic acids, under determined conditions and then, it stops to react, in con-trast with the samples in presence of chlorine, that went on reacting with molecules present in fulvic acids. This would possibly explain the lesser formation of trihalomethanes in solutions contends chlorine dioxide, which it was verified by the gas chromatography technique.
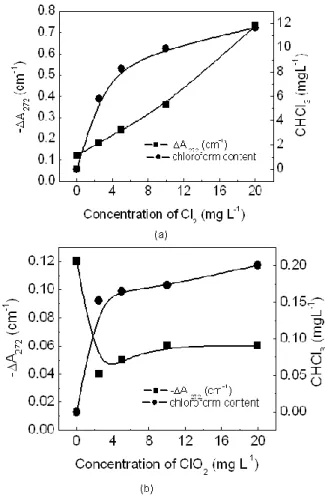
Fig. 3 show a comparison between the results obtained by gas cromatography and differential absorbance at 272 nm (-ΔA 272). These results
show the formation of chloroform after 24 hours of reaction, in function of the variation of the comcentration of the oxidants. In sample with lesser value for the differential absorbance -ΔA272, of 0.73 (sample with higher chlorine
concentration), it was detected formation of ~12.0 μg.L-1 of chloroform. In samples with chlorine dioxide, it was formed approximately 0.20 μg.L-1 of chloroform (sample with larger chlorine dioxide concentration), with a differential absorbance at 272 nm, of 0.06. In case of the samples with chlorine dioxide, the differential absorbance at 272 nm (-ΔA272), it
tends to stabilize itself, with the increase of the concentration of the oxidant, in contrast with samples in presence of chlorine. However, in both cases, there was an increase of the content
of formed chloroform, with the increase of the concentration of the oxidants, being that for the sample with chlorine, this increase it was of 100% and for samples with dioxide chlorine of the ~33%, observing a reduction in the chloroform formation. Similar behavior was observed for the differential absorbance at -ΔA254.
Figure 3 - Chloform content formed and absorbance at 272 nm, in different concentrations of the oxidants. In (a) samples with chlorine and (b) samples with chlorine dioxide. Aquatic fulvic acids at 4 mg L-1, solutions at pH
7.0.
Table 3 – Differential absorbance -ΔA254 e -ΔA272, obtained for samples of the fulvic acids, in presence of chlorine and
chlorine dioxide, reaction time 24 hours.
Oxidant Dose (mg L-1) -A 254 -A 272 Cl2 ClO2 Cl2 ClO2 0.0 - - - - 2.5 0.20 0.05 0.18 0.04 5.0 0.23 0.06 0.24 0.05 10.0 0.30 0.06 0.36 0.06 20.0 0.32 0.07 0.73 0.06
37
The most important property of the differential absorbance with respect to its use as a tool for monitoring DBP formation is that the differential absorbance at 272 nm (-ΔA272) is
extremely well correlated with the concentration of byproducts formed in that water.
This correlation is remarkable for its linearity (with R2 of 0.99 in many cases what also it was observed at -ΔA254) and, its applicability to
unrelated water sources over a wide variety of halogenation conditions. This linearity was observed for both oxidants.
CONCLUSIONS
This correlation is remarkable for its linearity (with R2 of 0.99 in many cases what also it was
observed at -ΔA254) and, its applicability to
unrelated water sources over a wide variety of halogenation conditions. This linearity was observed for both oxidants.
In this paper we explore the formation of by-product and relationships with ab-sorbance at 254 nm and 272 nm, in samples of tropical aquatic fulvic acids in presence of chlorine and chlorine dioxide, as alternate disinfectant and demonstrate the applicability of differential absorbance spectroscopy for studies of the by-product formation, as the chloroform. Both disinfectants produce a decrease in absorbance at 254 nm and 272 nm, with the increase of the concentration. The concentration of CHCl3
formed was extremely well correlated, with the decrease of the absorbances, with values for R2
of 0.99, showing up strongly correlated with the magnitude of the differential absorbance at 272 nm and at 254 nm.
The results are possibly associated with the fact that chlorine dioxide only breaks large molecules structures in lesser, in contrast with the chlorine, which reacts with organic compounds by one or more of three basic mechanisms, as addition, oxidation and substitution. Possibly, this explains the changes observed in the spectra of absorbance when using different oxidants and the less concentration of the chlorofom formed in samples with chlorine dioxide.
Differential absorbance spectroscopy proved to be a powerful tool in monitoring
transformations in the chemical state of humic species (HS) such as the aquatic fulvic acids. The shape of the spectra provides information about the chemical nature of the reactive chromophores, when different oxidants as chlorine and chlorine dioxide are used.
ACKNOWLEDGEMENTS
The authors are grateful to FAPESP (fellowships to E.R.C., project 99/10565-6), CNPq (projects 620324/98-8 and 302756/2009-4) and Embrapa for the financial support.
REFERÊNCIAS
AIKEN, G. R. In Humic Substances in Soil, Sediment and Water: Geochemistry, Isolation and Characterization; Aiken, G.R.; MacKnight, D.M.; Wershaw, R.L.; MacCar-thy, P., eds.; JohnWiley & Sons: New York, p. 363, 1985. APHA (American Public Health Asociation), AWWA (American Water Works Association), and WPCF (Water Pollution Control Federation). Standart methods for the examination of water and wastewater, 18th ed. Wasshington, DC, 1995.
BOYCE, S. D.and HORNING, J. F. Reaction Pathways of Trihalomethane Formation from the Halogenation of Dihydroxy-Aromatic Model Compounds for Humic Acid, Environmental Science & Technology, vol. 17(4), p. 202-211, 1983.
CARVALHO, E. R. Estudos da formação de trihalometanos a partir de substâncias húmicas aquáticas tratadas com cloro e dióxido de cloro, (Tese de Dou-torado), Universidade de São Paulo-São Carlos, 2003.
CHEN-YU, Chang; YUNG-HSU, Hsieh; YU-MIN, Lin; POYU, H.; CHIN-CHUAN, L.; KUO-HUA, W. The organic precursors affecting the formation of disinfection by-products with chlorine dioxide, Chemosphere, vol. 44(5), p. 1153-1158, 2001.
EPA, New Orleans Area Water Supply Study, Lower Mississippi River Facility, Slidell, LA. U.S. EPA, Dallas, p. 1-30, 1974.
GAUTHIER, T. D.; SEITZ, W. R.; GRANT, C. L. Effects of structural and compositional variations of dissolved humic materials on
38
pyrene KOC values. Environmental Science & Technology, vol. 21, p. 243-248, 1987.
JAFFE, H. H.; ORCHIN, M. Theory and Applications of Ultraviolet Spectroscopy. John Wiley & Sons, New York, p. 431, 1962.
KARANFIL, T.; KITIS, M.; KILDUFF, J. E.; WIGTON, A. The use of granular actived carbon adsorption for natural organic atter control and its reactivity to disinfection by-products formation. In: Barrett, S. E., Krasner, S. W., Amy, G. L. (Eds): Natural Organic Matter and Disinfection By-products. American Chemical Society, Washington, DC, p.190-205, 2000.
KORSHIN, G. V.; CHI-WANG, L.; BENJAMIN, M. M. Use of UV spectroscopy to study chlorination of natural organic matter. Water Disinfection and Natural Organic Matter. Chapter 12. R. A. Minear and G. Amy, Eds. ACS Symposium Series n649, American Chemical Society, p.182-195, 1996.
KORSHIN, G. V.; LI, C. W.; BENJAMIN, M. M. The decrease of UV absorbance as an indicator of TOX formation. Water Research, vol. 31(4), p. 946-949, 1997.
KORSHIN, G. V.; LI, C. W.; BENJAMIN, M. M. J. Am. Monitoring DBP formation with differential UV spectroscopy. Water Works Assoc., vol. 90 (8), p. 88-100, 1998.
KORSHIN, G. V.; LI, C. W.; BENJAMIN, M. M. Use of differential spectroscopy to evaluate the structure and reactivity of humics. Water Science and Technology, vol. 40 (9), p. 9-16, 1999.
KORSHIN, G. V.; BENJAMIN, M. M.; XIAO, H. B. Interactions of chlorine with natural organic matter and formation of intermediates: Evidence by differential spectroscopy. Acta Hydrochim. Hydrobiologia, vol. 28, p. 378-384, 2000.
KOCH, B.; KRASNER, S. W. Occurrence of distribution by-products in a distribution system. IN: Proceedings of the Annual Conference sponsored by American Water Works Association, p. 1203-1230, 1989
KRAMER, M. D.; LYNCH, C. F.; ISACSON, P.; HANSON, J. W. The association of waterborne chloroform with intrauterine growth
retardation. Epidemiology, vol. 3, p. 407-413, 1992.
KULOVAARA, M.; CORIN, N.;
BACKLUND, P.; TERVO, J. Impact of UV254- radiation on aquatic humic substances. Chemosphere, vol. 33, p. 783-790, 1996. LI, C. W.; KORSHIN, G. V.; BENJAMIN, M. M. Monitoring DBP formation with differential UV spectroscopy. Journal American Water Works Association, vol. 90, p. 88-100, 1998. LI C, BENJAMIN MM, KORSHIN GV. The relationship between TOX formation and spectral changes accompanying chlorination of pre-concentrated or fractionated NOM. Water Research. 2002; vol. 36(13):3265–3272.
MALCOLM, R. L. Humic Substances II, Search of Structure, New York, Wiley, p. 339-372, 1989.
MASSIMILIANO, F.; KORSHIN, G. V. Formation of disinfection by-products and applicability of differential absorbance spectroscopy to monitor halogenation in chlorinated coastal and deep ocean seawater. Desalination, vol. 176, p. 57-69, 2005.
MONSALLIER, J. M.; SCHERBAUM, F.; BUCKAU, G.; KIM, J. Photodegradation of humic acid. IN: International Meeting of the International Humic Substances Society 10th, Toulouse-França, Proceedings Toulouse, p.149, 2000.
MORRIS, J. C.; BAUM, B. Water chlorination: enviromental impact and health ef-fects, (Jolley RL, Gorchev H, Hamilton DH, eds). Ann Arbor, Michigan: Ann Arbor Science Publishers, p. 29-48, 1978.
NAITHANI, R.; PANDE, I.P., Physicochemical assessment of water quality with respect to Remote sensing and GIS techniques. Advances in Pure and Applied Chemistry, vol. 1, p. 1-6, 2012.
NORWOOD, D. L.; JOHNSON, J. D.; CHRISTMAN, R. F.; HASS, J. R.; BOBENRI-ETH, M. J. Reactions of chlorine with selected aromatic models of aquatic humic material. Environmental Science & Technology ,vol. 14, p. 187-190, 1980.
ÖZDEMIR, K.; TORÖZ, E.; UYAK, V. Assessment of Trihalomethane Formation in
39
Chlorinated Raw Waters with Differential UV Spectroscopy Approach. The Scientific World
Journal. Disponível em <
http://www.ncbi.nlm.nih.gov/pmc/articles/PM C3865629/>. Acesso em: 22 april 2014
PETERS, R. J. B.; LEER, E. W. B.; GALAN, L. Dihaloacetonitriles in Dutch drinking water. Water Research, vol. 24 (6) p. 797-800, 1990. PRAKASH, D. Reduction of Toxicity by using Chlorine dioxide in Paper Making. Journal of Science, vol. 1, p. 30-35, 2012.
RECKHOW, D. A.; SINGER, P. C.; MALCOLM, R. L. Chlorination of Humic Materials: Byproduct Formation and Chemical Interpretations. Environmental Science & Technology,vol. 24, p. 1655-1664, 1990. RECKHOW, D. A.; SINGER, P. C. In Water Chlorination: Chemistry Environmental Impact and Health Effects: Jolley, R. L., et al., Eds., Lewis Publishers Inc.: Chelsea MI, p. 1229-1257, 1995.
ROOK, J. J. Formation of haloforms during chlorination of natural waters. Water Treatment Examination, vol. 23, p. 234-243, 1974.
ROOK, J. J. Chlorination reactions of the fulvic acids in natural waters. Environmental Science & Technology, vol. 11, p. 478-482, 1977. ROSA, A. H.; ROCHA, J. C.; Rocha, P. Burba, Extraction and exchange behavior of metal species in therapeutically applied peat. Talanta, vol. 58, p.969-978, 2002.
SCHULTEN, H. R.; GUDRUN, A. B.; FRIMMEL, F. H. Time-Resolved Pyrolysis Field-Ionization Mass-Spectrometry of Humic Material Isolated from Fresh-Water. Environmental Science & Technology, vo. 21, p. 349-357, 1987.
SCOTT, A. I. Ultraviolet Spectra of Natural Products, Pergamon, Oxford, p. 141, 1964. YANG, X.; GUO W, LEE W. Formation of disinfection byproducts upon chlorine dioxide preoxidation followed by chlorination or chloramination of natural organic matter. Chemosphere, vol. 91(11), p.1477-85, 2013. WU, W.; CHADIK, P. A.; DAVIS, W. M.; DELFINO, J. J.; POWELL, D. H. The effect of structural characteristics on disinfection
by-products formation in chlorination. In: Barrettt, S. E., Lrasner, S. W., Amy, G. L. (Eds): Natural Organic Matter and Disinfection By-products. American Chemical Society, Washington, DC, p.109-122, 2000.
WANGERSKY, P. J. Dissolved organic carbon methods: a critical review. Marine Chemistry, vol. 41, p. 61-74, 1993.