A Work Project, presented as part of the requirements for the Award of a Masters Degree in Economics from the NOVA – School of Business and Economics.
PROTECTIONISM AND THE PRODUCTIVITY OF THE AUTOMOTIVE INDUSTRY IN BRAZIL
CAMILA FERRAZ PEIXOTO CAVALCANTE MST14000439
Under the supervision of: Professor André C. Silva
PROTECTIONISM AND THE PRODUCTIVITY OF THE AUTOMOTIVE INDUSTRY IN BRAZIL
ABSTRACT
This work project provides evidence on the positive effect of trade liberalization on productivity growth in the Brazilian automotive industry. I use data before and after trade liberalization. The positive effect of trade liberalization found here supports the idea that the adoption of higher tariffs on imports in this sector is not justified. This idea is also supported by the fact that production increased since trade liberalization. Higher tariffs on imports of vehicles are one of the measures of the recently announced plan Brasil Maior. According to the results found here, the effect of this new protectionist measure might be the loss of productivity and efficiency of the industry in the long run and the supply of expensive products in the domestic market.
1. INTRODUCTION
This work provides evidence on the positive effect of trade liberalization on productivity growth in the Brazilian automotive industry. I use industrial data before and after liberalization to measure the productivity gain.
The Brazilian economy had been one of the most closed economies in the world until 1990. For instance, one year before liberalization the ratio of imports to production was only 0,4%, while five years after the liberalization process was fully completed this ratio was almost 15%. The trade policies to protect the national industry were based on “substitution of imports” either through quantitative controls, high tariffs on imports or even prohibitions. In the beginning of the 90s, a trade liberalization process began and established the abolishment of all quantitative controls and a progressive reduction of tariffs. Since then an undoubtful increase in productivity in the overall industry has been observed. Despite of this, in the recent years the Brazilian government has been re-adopting some protectionist measures that might overcome the positive effects of the liberalization in the long-term.
The recently announced economic plan ‘Brasil Maior’ aims to protect the domestic industry from the international competition, mainly from the aggressive rivalry of the Chinese industry, in a context of an overvalued exchange rate. In this present study, the analysis is focused on the automotive industry due to its increasing relative importance1 and because it is one of the industries that will be more affected by one of the new protectionist measures of the economic plan. It is expected an increase of 30% p.p. in the Tax on Industrialized Products (IPI) to imported vehicles
1 In 1990, the participation of automotive industry in industrial GDP was 7,7%. This share has
from non-Mercosur countries or with low national content – the vehicles with minimum of 65% of national production are exempt from the tax increase.
The main proposal of this study is to analyze whether the domestic automotive industry really needs a higher level of protectionism and try to predict what would be the impacts of this new policy on the productivity of the industry. The remaining of the work is organized as follows. Section 2 presents a review on the existing literature about trade liberalization and productivity gains in Brazil and in the rest of the world. Section 3 provides an empirical analysis of the domestic automotive industry, while section 4 presents the econometric estimation of the impacts of trade liberalization on productivity. Section 5 then accomplishes the conclusion of the work.
2. LITERATURE REVIEW
The debate about the degree of openness of an economy and its impacts on the evolution of productivity has been playing an important role in the economic agenda in a globalized world. It is now accepted in the existing literature that liberal outward-oriented trade policies are better than inward-looking development strategies, however there is still no consensus whether trade liberalization promotes productivity gains in industry.
On one hand, advocates of liberalization argue that in markets characterized by international entry barriers, domestic firms have some monopoly power and excess profits that reduce the incentives to invest in new technologies and the efforts to reduce costs and become more efficient. The elimination of trade barriers would then provide access to better inputs and technologies, and the increased competition would force the industry to improve its methods of production and outputs. Furthermore, as
domestic firms become more competitive and productive, they could benefit from economies of scale due to external demand expansion.
In line with this argument, Cole et alli (2004) argued that the key determinant of Latin America’s relative income stagnation in the process of catching up to the United States is due to the stagnant relative total factor productivity (TFP). And the authors say that the main determinant of this Latin America’s TFP gap is not the human capital difference, but the barriers to competition. This argument is supported by their findings that government policies that aim to reduce competition have significantly reduced TFP in some of these countries.
Topalova and Khandelwal (2010) exploit the liberalization episode in the Indian industry, one of the most restrictive trade regimes in Asia until 1991 based on high nominal tariffs and import restrictions, and show evidences on increased firm-level productivity not only due to the increase in competition but mainly because of the access to better inputs in production. Moreover, Tybout, Melo and Corbo (1991) find evidences that the liberalization experience in Chile in the middle of the 70s forced suboptimal small producers toward minimally efficient scale and increased production levels. Pavcnik (2002) shows that there was a reshuffling of resources from less to more productive firms in this country, especially in the export-oriented and import-competing sectors. In the case of Korean industry the impact of liberalization on productivity growth was quite low, but Kim (2000) argued that it might have happened due to an insufficiently substantial openness of the economy.
On the other hand, it is said that the relationship between liberalization and productivity is at least ambiguous. For instance, Rodrik (1988) defends exactly the opposite: “for an individual firm, the larger market share provided by trade restrictions increases at the margin the benefits of cost improvements, and is likely to
spur, not retard, technological effort” (p. 5). Also, he stresses “all significant cases of export boom in manufactures – Korea and Taiwan in the l960s, Brazil in late l960s and 1970s, Turkey in the l980s – took place well before any significant trade liberalization had been attempted” (p. 9). Then, he ends up saying that the observed benefits from liberalization are predominantly from the contraction of industries with no comparative advantage, and not because of an overall gain in industry productivity. The critics of liberalism also warn that the benefits from it would not be realized in the case where domestic firms face credit constraints that prevent the absorption of new technologies and the expansion of efficient firms.
In the Brazilian case, there are several empirical results that reinforce the argument that trade liberalization promotes productivity gains. Salm, Saboia and Carvalho (1997) point out that the utilization of new methods of management and production were one of the reasons of the productivity increase in the 90s. Bonelli and Fonseca (1998) show that there were both efficiency and productivity gains in the economy, which resulted on a positive impact on the competitiveness of tradables. Also, Ferreira and Rossi (2003) confirm that the impact of trade liberalization on productivity was substantial and furthermore that there was widespread productivity improvement across industries.
3. BRAZILIAN AUTOMOTIVE INDUSTRY – AN EMPIRICAL ANALYSIS
Until the end of the decade of 1980, the trade policy in Brazil was based on a process called “substitution of imports”, which aimed to restrict the access to imports in the country through high nominal tariffs, quantitative quotas and even prohibitions. The imports until then were restricted to goods that did not have a similar in national
production. This policy allowed the construction of a huge and diversified domestic industry, however, at the same time, overprotected and less competitive and productive. In this section, it will be analyzed some important data on the automotive industry in order to provide an overall perspective on this sector.
3.1. Nominal and Effective Tariffs on Imports
Aiming to be inserted in the globalized international order, the domestic economy experienced a liberalization process in 1988 that extinguished the non-quantitative barriers and gradually reduced the nominal tariffs. Basically, the new import policy order to liberalize the economy, in the specific case of the automotive industry, can be separated in three phases: in the first three years, it only consisted in eliminate redundant tariffs and had no significant impact on imports; then, in the period of 1991-1993, it eliminated the non-quantitative tariffs and gradually reduced the nominal tariffs; and in 1994, the new government intensified the liberalization process and reduced more aggressively the tariffs. The period of 1995-1998 was characterized by a deceleration of the liberalization process and an increase in tariffs again. It resulted from the concerns of insolvency of the current account due to the occurrence of a trade deficit in the end of 1994 – the first one since 1987 – and the intense capital flight associated with the Mexican crisis. Finally, the nominal level of protection had decreased again with the adoption of the Mercosur’s Common External Tariffs2 (CET) for the automotive sector since 2001.
2 In order to former a customs union, the countries of Mercosur – Brazil, Argentina, Venezuela,
Paraguay and Uruguay – have adopted the same tariffs on imports to all goods entering the area, regardless of which country within the area they are entering.
Table 1 shows the evolution of the nominal tariffs (weighted by the value added of free trade3) in the automotive sector and in the overall industry. It is showed that the automotive industry has been one of the most protected sectors in domestic industry, and after the implementation of the CET the nominal tariffs on this sector were on average almost 80% lower than 1987. However, even with the implementation of the CET, the nominal tariff of the automotive sector is still the highest one in industry. Besides their reduction, it can be verified that nominal tariffs have become more uniform among all sectors.
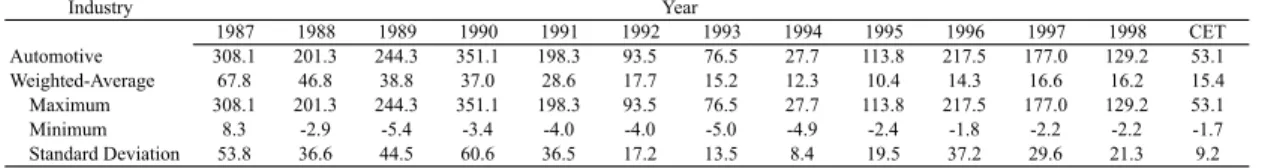
Table 2 presents the effective tariffs, which consider not only the tariffs over the goods but also the tariffs over their inputs.
By this perspective, it can be verified that, despite the reduction of more than 80% until the implementation of the CET, the effective rate of protection on the automotive industry continued to be extremely high and the largest one among all sectors. Once again, it is observed the increase of uniformity of tariffs in the domestic industry.
3 According to Kume (2003a), the average tariff weighted by the value added of free trade reflects
better the protection level of industrial sectors.
Table 1: Weighted-Average Nominal Tariffs by the Value Added of Free Trade Industry 1987 1988 1989 1990 1991 1992 1993 1994 1995 1996 1997 1998 CET Automotive 92.6 65.0 65.0 78.7 58.7 39.0 34.0 19.9 41.0 52.4 47.1 38.1 19.6 Weighted-Average 54.9 37.7 29.4 27.2 20.9 14.1 12.5 10.2 10.8 10.8 13.4 13.4 10.6 Maximum 102.7 76.0 75.0 78.7 58.7 39.0 34.0 23.5 41.0 52.4 47.1 38.1 19.6 Minimum 15.6 5.6 1.9 3.3 1.7 0.6 0.0 0.0 0.0 0.0 0.0 0.0 0 Standard Deviation 21.3 14.6 15.8 14.9 12.7 8.2 6.7 5.9 7.4 8.7 7.6 6.6 4.6
Source: Kume (2003a, 2003b)
Year
Table 2: Weighted-Average Effective Tariffs by the Value Added of Free Trade Industry 1987 1988 1989 1990 1991 1992 1993 1994 1995 1996 1997 1998 CET Automotive 308.1 201.3 244.3 351.1 198.3 93.5 76.5 27.7 113.8 217.5 177.0 129.2 53.1 Weighted-Average 67.8 46.8 38.8 37.0 28.6 17.7 15.2 12.3 10.4 14.3 16.6 16.2 15.4 Maximum 308.1 201.3 244.3 351.1 198.3 93.5 76.5 27.7 113.8 217.5 177.0 129.2 53.1 Minimum 8.3 -2.9 -5.4 -3.4 -4.0 -4.0 -5.0 -4.9 -2.4 -1.8 -2.2 -2.2 -1.7 Standard Deviation 53.8 36.6 44.5 60.6 36.5 17.2 13.5 8.4 19.5 37.2 29.6 21.3 9.2 Source: Kume (2003a, 2003b)
3.2. Trade Balance
Graph 1 shows the evolution of the trade balance and the exchange rate in the automotive industry during the last 30 years.
Since liberalization process started, the value of exports have been increasing substantially – during the period of 1980-1990 it increased more than 70% whilst throughout the role period of analysis it resulted on an increase of almost 900%. As expected, it is observed a huge difference in the growth rate of value of imports between the period of 1990, when it was not significant, and the period of 1980-2010, when it has grown 30 times. The instantaneous increase in imports have led to a decrease in the trade balance surplus in the first 4 years after liberalization, and to a period of deficit that lasted until 2001. Then, after a period of increased surplus, the trade balance has become negative again in 2008 until 2010 – the latest available data. Nevertheless, it is important to stress that the trade balance deficit was consequence of the stagnation of exports’ growth while imports remained growing at substantial rates. Further, the non-growth of exports might have been caused by the
Graph 1: Trade Balance (US$ mi) and Exchange Rate (R$/US$)
Sources: ANFAVEA and IPEA
0,00# 0,50# 1,00# 1,50# 2,00# 2,50# 3,00# 3,50# 4,00# 4,50# 5,00# )10.000# )5.000# 0# 5.000# 10.000# 15.000# 20.000# 1980# 1982# 1984# 1986# 1988# 1990# 1992# 1994# 1996# 1998# 2000# 2002# 2004# 2006# 2008# 2010#
decline in foreign demand for domestic vehicles after the international crisis associated with the overvaluation of the exchange rate, as showed above.
Another fact about the domestic automotive industry is that it has been losing market share to imported vehicles, as showed in graph 2, which again might be due to the recently overvalued exchange rate.
The recently observed deficits in trade balance of the automotive sector, the loss of market share and the constant pressure of the domestic producers for protection have motivated the announcement of the new protectionism measure that increases the tax on imports.
3.3. Productivity
In this study it will be analyzed two concepts of productivity: labor productivity and total factor productivity. The evolution of the labor productivity is quite correspondent with the evolution of the income per capita and it is a good measure of economic welfare. On the other hand, as total factor productivity measures
Graph 2: Automotive Industry Market Share
Source: ABEIVA 0%# 20%# 40%# 60%# 80%# 100%# 1991*98# 1999# #200 0# #2 00 1# #2 00 2# 2003# 2004# 2005# 2006# 2007# 2008# 2009# 2010# Imported#Vehicles# Domes>c#Vehicles#
the labor force and the physical stock of capital, it can reflect the evolution of the economic efficiency.
3.3.1. Labor Productivity
The labor productivity is calculated by dividing the production of vehicles by the labor force employed in production. According to Feijó and Carvalho (1994), the use of the number of employees in production avoids the overestimation of productivity due to the outsourcing process.
Graph 3 shows the evolution of employment, production and labor productivity in the automotive industry since 1980 until 2010. During the period of 1980 to 1987, the previous year of trade liberalization, the labor productivity growth rate remained almost unchanged – actually, it was negative (-7%). The decade of 1980 in Brazil is a period of crisis, known as “lost decade”, with negative output growth and high inflation rate (“stagflation”). In the specific case of the automotive industry, since both production and employment rate have lowed compared to the previous decade there is no significant impact on productivity.
Then, in 1998, ten years later the openness of the economy, the productivity rate has more than duplicated compared to 1987, with a proportional increase in production. This increase in productivity, as previously discussed, might be due to the access to new technologies and inputs and new management methods, boosted by the increased competition. Finally, since the beginning of the trade liberalization process until 2010 the productivity rate has reached almost a 300% increase. This result is due mainly to the increase in production, and partially, also a consequence of the decrease in employment, which has been increasing again in the last years. It is important to
underline that, despite the recent deficits in trade account and losses on market share, the production of the automotive industry have been reaching the highest levels ever.
3.3.2. Total Factor Productivity
The total factor productivity (TFP) was measured by the so-called ‘growth accounting method’, introduced by Solow (1957): it calculates the weight of different factors to economic growth and then calculates the weight of technological progress, measured as a residual. Consider a neoclassical production function:
Y = F(K, L;t) (1)
where Yrepresents production, K denotes physical capital and L denotes labor. The variable t for time denotes the technical change, or any kind of shift in the production function.
Graph 3: Labor Productivity (1980-2010, Index=1987)
Source: ANFAVEA 0,00# 0,50# 1,00# 1,50# 2,00# 2,50# 3,00# 3,50# 4,00# 4,50# 1980## 1982## 1984## 1986## 1988## 1990## 1992## 1994## 1996## 1998## 2000## 2002## 2004## 2006## 2008## 2010##
Considering the case of neutral technical change4, the production function takes the form:
Y = A(t) f (K, L) (2)
Differentiating (2) with respect to time, dividing by Y and rearranging the terms, it is obtained:
𝑌/𝑌 = 𝐴/A +A !"
!" 𝐾/Y +A !"
!" 𝐿/Y (3)
The relative shares of capital and labor in total product are, respectively: Wk =
!"
!" K/Y and WL = !"
!" L/Y. In practice, it is assumed that the factors are paid their
marginal products, so that the marginal product of capital is the real interest rate (r) and the marginal product of labor is the real wage (w). Then: WK = rK/Y and WL =
wL/Y, and WK + WL =15.
After recursively substitution6, equation (3) can be rewritten as:
𝑌/𝑌 = 𝐴/A +WK (𝐾/K) +WL ( 𝐿/L) (4)
Finally, the rate of technological change (TFP) can be calculated as a residual from (4):
g = 𝑌/𝑌 – WK (𝐾/K) – WL (𝐿/L) (5)
The labor variable is the number of employees in production of the automotive sector and the production variable is the number of total production of vehicles. Data
4 Neutral technical changes do not change marginal rates of substitution but simply changes the output
attainable from given inputs.
5 The condition W
K + WL =1 or Y = rK + wL must hold if all the product Y is associated to either capital
or labor.
6 Note that 𝑑𝑌 𝑑𝐾 = A (𝑑𝑓
𝑑𝐾 ) and 𝑑𝑌 𝑑𝐿 = A (𝑑𝑓 𝑑𝐿 ). Then Wk = A (𝑑𝑓 𝑑𝐾)(𝐾 𝑌) and
on physical capital are not published and this requires it to be calculated using investment data by the so-called ‘perpetual inventory method’7.
Table 3 shows the evolution of the TFP. The average productivity growth during the period of 1981-87 – before trade liberalization – was negative, and it became positive afterwards. It can be seen that this average growth have become positive in the beginning of the elimination of trade barriers in the period of 1988 to 1991 and have been reaching higher levels since then.
4. PRODUCTIVITY AND TRADE LIBERALIZATION
4.1. Labor productivity
The following model was used to estimate econometrically the relationship between trade liberalization and productivity:
protvt = α + β.ntt +Φ.(m/y)t + δ.(x/y)t + Ω + εt , t = 1985m1, … , 1994m12 (6)
where protvt is the labor productivity, ntt is the nominal tariff on imports, (m/y)t is the
proportion of imports on production, (x/y)t is the proportion of exports on production,
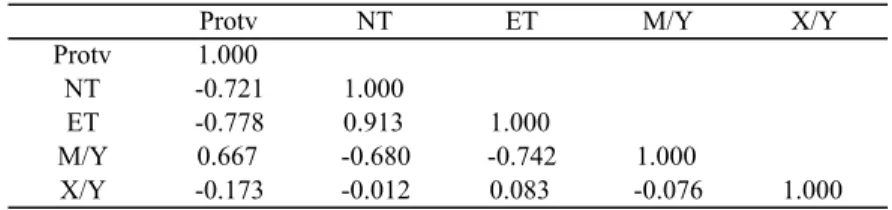
and is a vector of dummies to deal with seasonality on the data. Table 4 shows the correlations between all variables:
7 See appendix to more details about the data. Table 3: Total Factor Productivity Growth
1981-1987 1988-2009 1988-1991 1992-1999 2000-2009 Automotive Industry -2.8% 5.3% 0.7% 3.4% 5.5%
As expected, the barriers for trade – nominal and effective tariffs – have a negative correlation with the labor productivity and with the ratio of imports. Note that, as nominal and effective tariffs are highly correlated, effective tariffs were dropped from the model. Moreover, the labor productivity is positively related with the ratio of imports and negatively related with the ratio of exports.
There are 120 observations from January of 1985 to December of 1994. This period was chosen in order to provide a ‘natural experiment’: it captures the effects of the liberalization process in the automotive industry three years before, during the implementation and three years after – remember that this process started in 1988 and lasted four years to be completely implemented. Until 1987, the Brazilian economy was very close, with high nominal tariffs on imports, quantitative controls and prohibitions on imports; in this year the import ratio was 0,5%, while in 1994 it was almost 12%.
One problem that might arise when working with this model is the endogeneity problem. First, tariffs might be set in order to favor less productive sectors. Second, the ratio of imports might be endogenous since less productive sectors are more attractive to foreign firms, causing more imports. Here, it will be assumed that endogeneity is not a problem based on the findings of Ferreira and Rossi (2003). Aware of this problem, the authors have estimated a similar model by fixed effects method and using instrumental variables to test the effects on productivity
Table 4: Correlations
Protv NT ET M/Y X/Y
Protv 1.000
NT -0.721 1.000
ET -0.778 0.913 1.000
M/Y 0.667 -0.680 -0.742 1.000
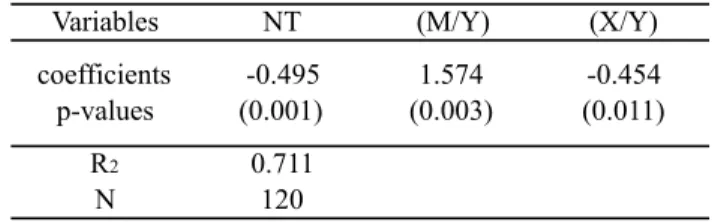
growth for the whole domestic industry in Brazil and its sectors. The Hausman Test did not reject the consistence of the fixed effects for all specifications, which excluded the presence of endogeneity in the model. I assumed this result as valid for the automotive industry as well and then equation 6 was estimated by the OLS method. Table 5 presents the regression results:
These results confirm the negative relationship between labor productivity and trade barriers: according to my estimation, ceteris paribus, the decrease in nominal tariffs observed in the period implies an increase of 36 p.p. on labor productivity. The observed increase in the ratio of imports to production leads to an increase of 42 p.p. on productivity, while the observed increase in the exports ratio leads to a decrease of 1 p.p. on productivity.
4.2. Total Factor Productivity
Now to estimate econometrically the relationship between trade liberalization and total factor productivity, I used the following model:
TFPt = α + β.ntt +Φ.(m/y)t + δ.(x/y)t + inft + Ω + εt , t = 1985m1, … , 1994m12 (7)
Table 5: Labor Productivity Regression
Variables NT (M/Y) (X/Y)
coefficients -0.495 1.574 -0.454 p-values (0.001) (0.003) (0.011)
R2 0.711
N 120
Note: Estimation using robust standard errors (White heteroskedasticity consistent).
where TFPt is the growth rate of TFP and inft stands for the nominal inflation rate.
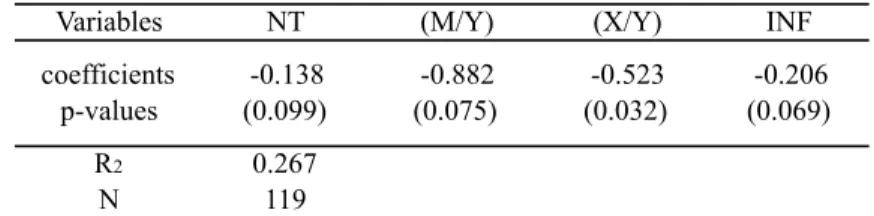
This variable was included in this model because it is well known that inflation might have a negative impact on growth. Table 6 presents the results for the estimation:
As before, according to my estimation, the nominal tariffs have a negative relationship with the growth rate of the TFP: ceteris paribus, the decrease in nominal tariffs observed in the period implies an increase of 10 p.p. on TFP growth. The observed increase in the ratio of exports to production and the observed decrease in the inflation rate during this period have a small impact on the TFP growth: they lead, respectively, to a decrease of 1 p.p. and to an increase of 2 p.p.. However, using this regression, the increase in the observed share of imports to production during this period impacts negatively on the growth rate of TFP by 24 p.p..
5. CONCLUDING REMARKS
This work presents evidence that trade barriers such as nominal tariffs on imports result on a negative impact on the productivity – either labor productivity or total factor productivity growth – of the automotive industry in Brazil. Actually, it was showed that the continuously reduction in tariffs after trade liberalization have led to a positive growth on productivity.
Table 6: TFP Regression
Variables NT (M/Y) (X/Y) INF
coefficients -0.138 -0.882 -0.523 -0.206 p-values (0.099) (0.075) (0.032) (0.069)
R2 0.267
N 119
Despite of this, the recent announced economic plan ‘Brasil Maior’ aim to increase the efficiency of the domestic industry by, among other measures, increasing the tariffs on imports. The domestic automotive industry will be largely affected by a new protectionism measure that will increase the Tax on Industrialized Products (IPI) to imported vehicles in 30% p.p..
This plan assumes a partially false diagnostic and proposes measures that, besides not solving the problems, will probably affect negatively the productivity and the efficiency of the economy. This erroneous diagnostic is based on the idea that the domestic industry is dramatically affected by the international exposure – especially by the predatory competition of Chinese imports – in a context of overvalued exchange rate. This is explicitly written in the ‘Open Letter’ of the plan as its main goal.
There are two misleading concepts in this idea in the specific case of the automotive industry. First, as previously showed, the production of this industry has been reaching increasing levels along years, even with the overvaluation of the exchange rate and the crescent share of imports on domestic market. The second mistake is to identify the overvalued exchange rate as the cause of the problem. There are some others facts, such as the extremely high taxes on production and the precarious structure of transports, which are responsible for the high costs of production and the decrease on competitiveness of the domestic industry. Furthermore, it is important to stress that the recent overvaluation of the exchange rate is partially due to the high level of the interest rate fixed to control inflation, which in turn, is also due to the excessive government spending and credit expansion. The critique presented in this study is that the adoption of new protectionism tariffs in the automotive industry is not justified; it basically will benefit the interests
of the domestic producers rather than the interests of the consumers. The results of this will be the loss of productivity and efficiency of the industry in the long run, and the continuously supply of expensive products in the domestic market.
REFERENCES
Barro, R. J.. 1999. "Notes on Growth Accounting." Journal of Economic Growth.
Bonelli, R. and Fonseca, R.. 1998. “Ganhos de Produtividade e de Eficiência: Novos Resultados Para a Economia Brasileira.” IPEA, texto para discussão 557.
Brazilian Automotive Industry Association. 2011. Brazilian Automotive Industry Yearbook. São Paulo.
Carvalho, P. G. M. and Feijó, C. A.. 1994. “Produtividade Industrial no Brasil: o Debate Recente.” Indicadores Econômicos FEE, 28, p. 631-646.
Cole, H. L., Ohanian, L. E., Riascos A. and Schmitz Jr., J. A.. 2004. “Latin America in the Rearview Mirror”. National Bureau of Economic Research, WP 11008.
Edwards, S.. 1993. “Openness, Trade Liberalization, and Growth in Developing Countries.” Journal of Economic Literature, 31, n. 3, p. 1358-1393.
Ferreira, P. C. and Rossi, J. L.. 2003. “New Evidence on Trade Liberalization and
Productivity Growth.” International Economic Review, 44, p. 1383-1407.
Ferreira, P. and Fragelli, R.. 2011. “Brasil Maior e Mais Ineficiente. ”In: Valor Econômico, August 24.
Kim, E.. 2000. “Trade Liberalization and Productivity Growth in Korean Manufacturing Industries: Price Protection, Market Power, and Scale Efficiency.” Journal of Development Economics, 62, p. 55-83.
Kume, H., Piani, G. and Souza, C. F.. 2003a. “A Política Brasileira de Importação
no Período 1987-1998: Descrição e Avaliação.” In: A Abertura Comercial Brasileira
nos Anos 1990. IPEA.
Kume, H. and Piani G.. 2003b. “Comércio e Tarifa Externa Comum no Mercosul: Uma Perspectiva Brasileira.” In: Corseuil, C. H. Kume, H.: A Abertura Comercial Brasileira nos Anos 1990:Impactos Sobre Emprego e Salário. IPEA.
Pavcnik, N.. 2002 “Trade Liberalization, Exit and Productivity Improvements: Evidence From Chilean Plants.” Review of Economic Studies, 69, p. 245-276.
Rodrik, D.. 1988. “The Limits of Trade Policy Reforms in Developing Countries.” Journal of Economic Perspectives, 6, p. 87-105.
Salm, C., Saboia, J. and Carvalho, P. G. M.. 1997. “Produtividade na Indústria Brasileira: Questões Metodológicas e Novas Evidências Empíricas.” Pesquisa e Planejamento Econômico, 27, p. 377- 396.
Solow, R. M.. 1957. “Technical Change and the Aggregate Production Function.” Review of Economics and Statistics, 393, p. 12-20.
Topalova, P. and Khandelwal, A.. 2010. “Trade Liberalization and Firm Productivity: The Case of India.” Review of Economics and Statistics, 93, p. 995-1009.
Tybout, J., de Melo, J. and Corbo, V.. 1991. “The Effects of Trade Reforms on Scale and Technical Efficiency: New Evidence From Chile.” Journal of International Economics, 31, p. 231-250.
APPENDIX
DATA
• Labor and production: both data were taken from the Yearbook of the ‘Brazilian Automotive Industry Association’ (ANFAVEA). Labor productivity series was constructed by dividing the number of produced vehicles by the number of employees in production.
• Physical capital: the capital series was constructed from investment data obtained in the Yearbook of the ‘Brazilian Automotive Industry Association’ (ANFAVEA) by using the so-called ‘perpetual inventory method’:
Kt = It + (1-δ) Kt-1
The initial capital stock was calculated using the formula: K0 = I0/ δ
• Depreciation rate: it was considered that the rate of depreciation of capital is δ = 0.05. This value is largely used in literature and it means that capital is fully depreciated in 20 years.
• Real interest rate and real wage: real interest rate was calculated by deflating the nominal interest rate (Selic) by the consumer price index (IPCA). The data were taken from IBGE, the public statistics bureau of Brazil.
• Relative shares of capital and labor in total product: it was calculated the average weight of capital and labor in production. The numbers Wk=0.3 and WL=0.7 are
near to what is assumed as acceptable in literature, with the labor share close to 2/3 and the capital share close to 1/3.
• Import and Export ratios: total imports and exports of vehicles were taken from the Yearbook of the ‘Brazilian Automotive Industry Association’ (ANFAVEA). The ratios were calculated by dividing them by total production.