❊♥s❛✐♦s ❊❝♦♥ô♠✐❝♦s
❊s❝♦❧❛ ❞❡
Pós✲●r❛❞✉❛çã♦
❡♠ ❊❝♦♥♦♠✐❛
❞❛ ❋✉♥❞❛çã♦
●❡t✉❧✐♦ ❱❛r❣❛s
◆◦ ✹✸✸ ■❙❙◆ ✵✶✵✹✲✽✾✶✵
◆❡✇ ❊✈✐❞❡♥❝❡ ♦♥ ❚r❛❞❡ ▲✐❜❡r❛❧✐③❛t✐♦♥ ❛♥❞
Pr♦❞✉❝t✐✈✐t② ●r♦✇t❤
P❡❞r♦ ❈❛✈❛❧❝❛♥t✐ ●♦♠❡s ❋❡rr❡✐r❛✱ ❏♦sé ▲✉✐③ ❘♦ss✐ ❏✉♥✐♦r
❖s ❛rt✐❣♦s ♣✉❜❧✐❝❛❞♦s sã♦ ❞❡ ✐♥t❡✐r❛ r❡s♣♦♥s❛❜✐❧✐❞❛❞❡ ❞❡ s❡✉s ❛✉t♦r❡s✳ ❆s
♦♣✐♥✐õ❡s ♥❡❧❡s ❡♠✐t✐❞❛s ♥ã♦ ❡①♣r✐♠❡♠✱ ♥❡❝❡ss❛r✐❛♠❡♥t❡✱ ♦ ♣♦♥t♦ ❞❡ ✈✐st❛ ❞❛
❋✉♥❞❛çã♦ ●❡t✉❧✐♦ ❱❛r❣❛s✳
❊❙❈❖▲❆ ❉❊ PÓ❙✲●❘❆❉❯❆➬➹❖ ❊▼ ❊❈❖◆❖▼■❆ ❉✐r❡t♦r ●❡r❛❧✿ ❘❡♥❛t♦ ❋r❛❣❡❧❧✐ ❈❛r❞♦s♦
❉✐r❡t♦r ❞❡ ❊♥s✐♥♦✿ ▲✉✐s ❍❡♥r✐q✉❡ ❇❡rt♦❧✐♥♦ ❇r❛✐❞♦ ❉✐r❡t♦r ❞❡ P❡sq✉✐s❛✿ ❏♦ã♦ ❱✐❝t♦r ■ss❧❡r
❉✐r❡t♦r ❞❡ P✉❜❧✐❝❛çõ❡s ❈✐❡♥tí✜❝❛s✿ ❘✐❝❛r❞♦ ❞❡ ❖❧✐✈❡✐r❛ ❈❛✈❛❧❝❛♥t✐
❈❛✈❛❧❝❛♥t✐ ●♦♠❡s ❋❡rr❡✐r❛✱ P❡❞r♦
◆❡✇ ❊✈✐❞❡♥❝❡ ♦♥ ❚r❛❞❡ ▲✐❜❡r❛❧✐③❛t✐♦♥ ❛♥❞ Pr♦❞✉❝t✐✈✐t② ●r♦✇t❤✴ P❡❞r♦ ❈❛✈❛❧❝❛♥t✐ ●♦♠❡s ❋❡rr❡✐r❛✱ ❏♦sé ▲✉✐③ ❘♦ss✐ ❏✉♥✐♦r ✕ ❘✐♦ ❞❡ ❏❛♥❡✐r♦ ✿ ❋●❱✱❊P●❊✱ ✷✵✶✵
✭❊♥s❛✐♦s ❊❝♦♥ô♠✐❝♦s❀ ✹✸✸✮
■♥❝❧✉✐ ❜✐❜❧✐♦❣r❛❢✐❛✳
New Evidence on Trade Liberalization and
Productivity Growth
∗
Pedro Cavalcanti Ferreira
†Fundação Getulio Vargas
José Luis Rossi
‡IPEA and Yale University
A bst r act
Although the subject of a large number of studies, the debate on the links between trade reform and productivity growth is still un-resolved and most studies at the micro level have not been able to establish a relationship between the two phenomena. Brazil provides a natural experiment to study this issue that is seldom available: it was one of the closest economies in the world until 1988, when trade re-form was launched, and intra-industry data are available on an annual basis before, during and after liberalization. Using a panel of indus-try sectors this paper tests and measures the impact of trade reform on productivity growth. Results conÞrm the association between the former and the latter and show that the magnitude of the impact of tariffreduction on the growth rates of TFP and output per worker was substantial. Our data reveal large and widespread productivity im-provement, so that the estimations in this paper are an indication that liberalization had an important effect on industrial performance in the country. Cross-sectional differences in protection are also investigated.
∗We gratefully acknowledge the comments of Ed Prescott, João Issler, Ajax Moreira
Samuel Pessôa and Eustáquio Reis. Thanks also to Honório Kume for some of the data used, and CNPq and PRONEX forÞnancial support.
†
Corresponding author. Graduate School of Economics, Fundação Getulio Vargas, Praia de Botafogo, 190, Rio de Janeiro, RJ, Brazil, 22253-900. Tel: 55-21-5595840; fax: 55-21-5538821; email: ferreira@fgv.br.
‡
1
I nt r oduct ion
Economists continue to puzzle over the elusive nature of the relationship be-tween productivity and trade reform. Results are at best ambiguous and, if any, only modest gains are predicted. For instance, in surveying the applied general equilibrium literature Kehoe and Kehoe(1994) write that the esti-mated effect of NAFTA is negligible for the US and Canada, and only worth 2.2 percent of GDP for Mexico. Tybout, de Melo and Corbo(1991) found no evidence of overall productivity improvement in the Chilean manufacturing sector after trade liberalization. Results in Tybout and Westbrook(1995) for the Mexican manufacturing sector are similar but the evidence is even weaker for trade liberalization affecting productivity. In a similar tone, Pack(1988) states that
Comparisons of total factor productivity growth among coun-tries pursuing different international trade orientations do not reveal systematic differences in productivity growth in manufac-turing nor do the time-series studies of individual countries that have experienced alternating trade regimes allow strong conclu-sions in this dimension.
In fact, very few studies at the micro level have been able to present some evidence linking trade reform and increased productivity growth (two exceptions are Harrison(1994), that works with plant level data from Cote D’Ivoire, and Lee(1996) dealing with Korean industrial data at the 4-digit level). On the other hand, the evidence that trade protection mechanisms, such as tariffs and import restrictions, decrease growth rates of labor pro-ductivity (and some cases total factor propro-ductivity), obtained from stud-ies that rely on cross-country regressions (e.g., Edwards(1993) and Ben-David[1993]) has been attacked recently by Rodríguez and Rodrik(1999) and Rodrik(1999). Their criticism is centered on methodological issues but could be interpreted as a rejection of the recent policy consensus on the beneÞcial impacts of openness.
In 1988, Brazil started a drastic process of trade liberalization that lasted until the early nineties. Monthly industrial surveys collected data before, during and after this process, providing a natural experiment. Data are available not only for the entire period but also for different industries of the manufacturing sector, also allowing the study of intra-industry effects of the reforms. The objective of this paper is to investigate the evidence that has emerged regarding the relationship of trade policy reform and productivity growth.
The case in point is especially interesting for the study of the links be-tween trade and growth because Brazil was, until the nineties, one of the closest economies in the world1, so that the gains from liberalization are potentially large if they exist. Moreover, unlike most studies such as those surveyed in Pack(1988), Harrison(1995) and Lee(1996) this paper works with “before and after ” data. Hence, we have an experiment in which institu-tional and country factors are controlled, the data span stretches fromÞve years before the policy change to some years later and the manufacturing industries included in the exercises comprise more than 90% of the total sector production.
Unlike most of the previous literature, we found strong evidence link-ing trade liberalization and productivity growth. Our data shows that after declining over the 1980s, both output per worker and total factor produc-tivity (TFP) increased after trade liberalization. For example, TFP for 16 industries at two-digit level declined at an average annual rate of 1.01 percent from 1985 to 1989, but from 1994 to 1997 increased at an average annual rate of four percent. The Þgures for output per worker are similar, while 10 of those 16 industries had negative growth from 1985 to 1990 all but one grew at annual rates above 5% from 1991 to 1997. In the same period, average nominal tariffs for the manufacturing sector dropped from more than 100% to less than 15%, while the effective rate of protection declined to less than oneÞfth of its original level. The relationship between these phenomena is investigated econometrically in the paper, using panel techniques. Results conÞrm the linkages between trade reform and produc-tivity growth and show that the magnitude of the impact of tariffreduction on the growth rates of TFP and output per worker was substantial.
This article relates to the literature of political and institutional barriers to growth (e.g., Holmes and Schmitz(1995), Parente and Prescott(2000)). In these studies, sectors with some degree of monopoly power over the supply
1In fact, it had in the seventies the
of speciÞc factors can impose prices and block adoption of new technology. In Parente and Prescott (1999), for instance, a coalition of factor suppliers that is the monopoly seller of its input services can dictate work practices and member’s wages. The monopoly right is protected by law, which makes it costly to enter the market with more productive technology. A corollary is that barriers to trade such as tariffs, quotas or any non-tariffbarriers im-posed by those interest groups affect the country’s total factor productivity (TFP) level and growth prospects. If these barriers are destroyed the re-sistance to new technologies or new work practices is reduced, accelerating productivity growth. That is exactly what is shown in this paper, as bar-riers to trade were drastically reduced, industrial productivity soared while employment and hours experienced a substantial reduction.
The paper is organized in 4 sections, in addition to this introduction. The next section presents trade reform stylized facts while Section 3 discusses the evolution of labor productivity and TFP in the manufacturing sector in the period. Section 4 tests the link between productivity and trade restrictions while at the same time estimating productivity elasticity with respect to measures of trade protection. Section 5 concludes.
2
Tr ade Policy
Import substitution and protection of infant industries were the foundation of industrial policy and development strategy in Brazil ( and Latin America as a whole) until the end of the eighties. Up to 1979, quantitative controls, reserved market shares and outright import bans were the dominant policy instruments. The so-called ”lei do similar nacional” ( ”law of similar domes-tic production”) banned the importation of or imposed prohibitive tariffs on any industrial product competing with domestic production. After 1979, tariffs were re-established as the main instrument of trade policy and quan-titative controls were mostly abandoned gradually. However, to compensate for the decrease in industrial protection, nominal tariffs were raised to levels well above international standards. In 1988, a trade liberalization process began. This was rather timid, with the elimination of redundant tariffs, but after 1990 the pace of reform accelerated. All quantitative controls were deÞnitively eliminated and a timetable was established for tariffreduction.
Table 1 displays the average nominal tarifffor the 16 industries between 1987 and 19972.
2The nominal tariffand effective rate of protection data are from Pinheiro and
Table 1: Average Nominal Tariffs
Industry year
1987 1990 1997
Nonmetal mineral products 98.7 24.5 7.30
Metalworking 72.8 23.7 12.80
Machinery 62.1 39.5 13.90
Electronic and communication equipment 100.4 39.6 14.55 Transportation and motor vehicles 115.9 55.9 16.70 Paper and paper products 82.2 23.1 11.90
Rubber products 101.7 49.6 12.80
Chemicals 34.2 13.4 8.23
Pharmaceuticals 42.2 26 10.00
Perfumes, soap and candles 184.4 59.2 10.00
Plastic products 164.3 40 16.50
Textiles 161.6 38.8 15.80
Clothing, fabric products and footwear 192.2 50 19.60
Food 84.2 27.4 12.15
Beverages 183.3 75.1 14.50
Tobacco 204.7 79.6 9.00
average 117.81 41.59 12.86
Standard Deviation 56.01 19.02 3.40
max/min 5.99 5.94 2.68
On average, pre-reform tariffs were almost ten times larger than in 1997. The highest tariffs were observed in consumption industries such as tobacco, beverages and textiles. The lowest tariffs were those on intermediate indus-tries such as chemical and machinery. Three years after the beginning of liberalization, tariffs were already only one-third of 1987Þgures and disper-sion (e.g., as measured by the ratio of standard deviation to average tariff) was also signiÞcantly reduced. This process went on until 1996, when dis-persion was further reduced and the highest average tariff, on the clothing industry, was only 19%.
It is interesting to note that although the fall in nominal tariffs after trade liberalization is widespread across sectors, the ordering is more or less the same as before, and consumption industries still have more protection than intermediate and capital-goods industries. Another point worth mentioning is that, due to exceptions in the Mercosul agreement, protection of some speciÞc sub-sector, as for instance the automobile, computers and freezers,
is still relatively high (e.g., more than 40% in the case of most automobiles) and in certain cases well aboveÞgures in Table 1.
The study of effective rates of protection behavior rather than nominal tariff behavior is certainly more important to understand the impact of trade policy on productivity growth. This is so because that measure takes into account not only the price of Þnal products but also that of the inputs used in their production, and in principle it includes the effect of all of the factors that drive a wedge between world and domestic prices. Table 2 displays industry averages of the effective rate of protection3 for the
1985-1997 period.
Table 2: Effective Rates of Protection
Industry Year
1987 1990 1997
Nonmetal mineral products 31,5 42,2 14,5
Metalworking 59,8 34,5 17,5
Machinery 18,5 41,2 14,3
Electronic and communication equipment 108,2 53,3 16,7 Transportation and motor vehicles 43,5 178,2 33,8 Paper and paper products 31,0 22,8 12,6
Rubber products 125,0 67,1 14,7
Chemicals 64,9 21,5 10,3
Pharmaceuticals 52,3 36,3 9,9
Perfumes, soap and candles 96,1 76,0 26,1
Plastic products 427,7 54,2 22,3
Textiles 53,1 50,1 21,5
Clothing, fabric products and footwear 240,7 65,4 22,6
Food 32,7 33,5 15,7
Beverages -7,6 93,0 19,9
Tobacco -4,6 3,1 10,8
average 85,8 54,5 17,7
D.P. 105,6 38,5 6,2
max-min 435,3 175,1 23,9
Effective rate of protection felt in all industries but beverage and tobacco. On average, today’s values are one-fourth of those of 1987. The decrease, however, is not uniform, and at least in the transportation industry the effective protection rate is still high. The largest reductions were observed
3
in the plastic products industry and in the clothing, fabric products and footwear industry. In the Þrst case, the current rate is less then 6% of its 85-89 average. Note also that there is a large decrease in the tariffdispersion: the standard error to average ratio fell from 1.23 to 0.35 in the period.
3
Pr oduct ivit y gr owt h
3.1
L ab or pr oduct ivit y
We had a complete data set for 16 of the 21 sectors of the Brazilian man-ufacturing industry and our time span goes from 1985 to 1997 (annual ob-servations). The output of these 16 sectors takes in something around 92% of the total output of the manufacturing industry of the country during this period. We constructed two measures of productivity: one used ”total work hours employed in production” and the other ”total labor force employed in production.” There is no information on value-added by industry, so that we used output as a proxy4. Figure 1 below presents the evolution of average
productivity, average hours, average employment and average output of the 16 sectors for the entire period:
0 20 40 60 80 100 120 140 160 180
1985 1986 1987 1988 1989 1990 1991 1992 1993 1994 1995 1996 1997
h n y y/h y/n
Labor Productivity (Industry Average, 1985-1997)
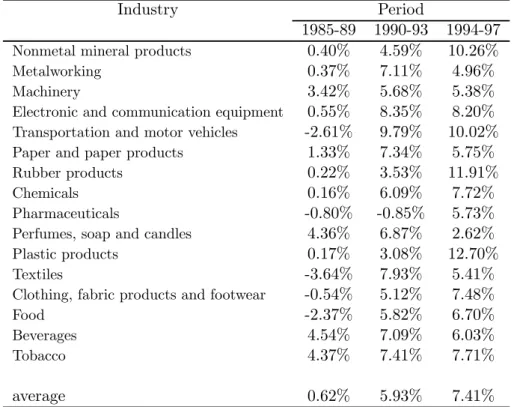
In the graph above,hstands for hours,nfor labor force andyfor output. These 13 years can be divided into 3 sub-periods: 1985-1989, 1990-1993 and 1994-1997. In theÞrst one, labor productivity grew very little or declined in most sectors. On average, the annual rate for the entire manufacturing sector was 0.6% in the output/labor concept or 0.9% in the output/hours concept. In this period output and employment increased, but the latter more than the former. Between 1990 and 1993, coinciding with the beginning of trade liberalization, average productivity increased at an annual rate of 5.94% (when using hours) or 5.93% (when using the employment concept). In this period the country was experiencing a recession but output reduction was more then offset by employment reduction. Finally, the 1994-1997 period is one of even faster productivity growth (above 7.4% in both concepts). Employment continued its downward trend but in this case output increased in all industries. All in all, the two productivity measures have the same trend for the entire period. Behavior by industry is similar, as can be seen from Table 3 below:
Table 3: Productivity Growth Rates
Industry Period
1985-89 1990-93 1994-97 Nonmetal mineral products 0.40% 4.59% 10.26%
Metalworking 0.37% 7.11% 4.96%
Machinery 3.42% 5.68% 5.38%
Electronic and communication equipment 0.55% 8.35% 8.20% Transportation and motor vehicles -2.61% 9.79% 10.02% Paper and paper products 1.33% 7.34% 5.75%
Rubber products 0.22% 3.53% 11.91%
Chemicals 0.16% 6.09% 7.72%
Pharmaceuticals -0.80% -0.85% 5.73%
Perfumes, soap and candles 4.36% 6.87% 2.62%
Plastic products 0.17% 3.08% 12.70%
Textiles -3.64% 7.93% 5.41%
Clothing, fabric products and footwear -0.54% 5.12% 7.48%
Food -2.37% 5.82% 6.70%
Beverages 4.54% 7.09% 6.03%
Tobacco 4.37% 7.41% 7.71%
average 0.62% 5.93% 7.41%
growth, with the ”plastic material” (12.7% annual growth rate ) and ”rub-ber products” (11.91% annual growth rate) industries leading. On the other hand, in the Þrst sub-period all but 5 industries experienced annual pro-ductivity growth rates below 1% and 5 of them experienced negative growth, textiles having the worst record (-3.64% annual growth). If a different ini-tial sub-period had been taken, 1985-1990 instead of 1985-1989, we would observe that 10 industries had negative productivity growth.
It is important to note also that the relatively good performance in the second sub-period (only one industry experienced negative productivity growth) is mostly due to the growth acceleration between 1992 and 1993. Average productivity in 1992 is only 3.5% higher than in 1990, but when comparing 1990 to 1993 the difference jumps to 14%.
Is important to notice that this choice of years is somewhat arbitrary. If we compare the 85-90 period to the 91-97 period, the difference is even larger: average productivity across sectors decreased at an annual rate of -0.45% in theÞrst period and grew at 7.1% in the second. InÞve of the 16 sectors output per worker grew at an annual rate above 8.3% and in only one at less thanÞve per cent.
3.2
Tot al Fact or P r oduct ivit y
Total factor productivity is measured in the standard way. Assume a Cobb-Douglas production function:
Yit= Ait.Kitα.H
β
it.L
γ
it, i= 1, ..., N; t= 1, ..., T, (1)
where Yit denotes output of sector i at time t,and K, H and L stand for
physical capital, human capital and raw labor, respectively. Hence, in this formulation the residualA is equivalent to the TFP. Taking logarithms and differentiating with respect to time we obtain:
•
Yit
Yit =
•
T F Pit
T F Pit + α.
•
Kit
Kit + β.
•
Hit
Hit + γ.
•
Lit
Lit
(2)
the TFP, one without human capital:
•
Yit
Yit =
•
T F Pit
T F Pit + α.
•
Kit
Kit + γ.
•
Lit
Lit
(3)
and the other with human capital stock, so that we obtain exactly equation (2).
Our data consist of a panel of 16 industries for 13 years (from 1985 to 1997). There are basically two main techniques for panel estimation. One is theÞxed-effects method, which is essentially an OLS regression with cross-section dummies. The other is the random-effects method in which the intercept is considered a random variable and the generalized least square method is used. According to Hsiao (1986) the former is the proper proce-dure when estimating regressions with a speciÞc number of sectors ofÞrms and the inference is restricted to the behavior of this set. On the other hand, if the study is concerned with a large number of individuals orÞrms, so that they could be viewed as a random sample of a larger population, the latter method is recommended. We ran the Hausmann speciÞcation test in order to decide between the two methods and the result favored the Þxed-effects method, which we therefore used in all regressions5.
After testing for endogeneity of output growth rates, and rejecting the consistency of the OLS, we estimated factor shares using instrumental meth-ods. In the present case the method chosen was the Weighted 2 Stages Least Squares, which also corrects for cross-section heteroskedasticity. In this case, lagged variables were used as instruments. Moreover, constant returns of scale were imposed. Estimated factor shares, from regressions of equation (3), were slightly sensitive to the labor series employed. When we used hours the estimated labor share was 0.64, 0.10 points higher than when labor force was used. In any case, the values found are not far from interna-tional evidence and nainterna-tional accounting estimates. For our purposes these small differences are not important, as they did not change the behavior of the estimated TFP series, which is ourÞnal objective here.
In both cases, TFP growth rate has the following behavior: between 1985 and 1989 it declined in almost all industries, in certain cases at annual rates above 3%. From 1990 to 1993 this trend reverted, as we observe positive but small growth in all but one industry. The average growth rate jumps from minus 1% in the previous period to 2%. In the Þnal period, again all but one industry ( perfumes, soap and candles) had positive TFP annual
5Hence, we are implicitly associating TFP growth to be the industry-speci
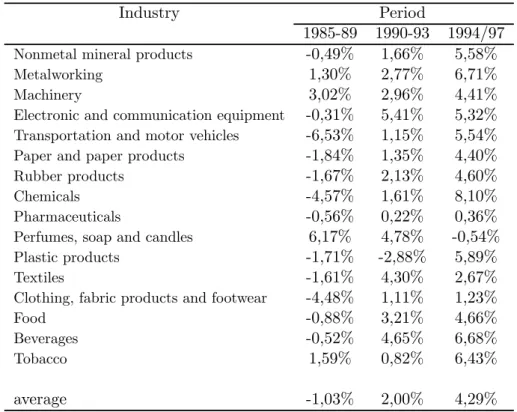
growth, but the rates now are considerably higher as the average growth has more than doubled. In exactly half the sectors, annual growth rates are above 5%, an impressive performance. Note also that the evolution of labor productivity in the period is very similar, although magnitudes vary. Table 4 below displays TFP annual growth rates by industry in the 3 sub-periods for the case where hours were used as the labor variable.
Table 4: TFP Annual Growth Rates
Industry Period
1985-89 1990-93 1994/97 Nonmetal mineral products -0,49% 1,66% 5,58%
Metalworking 1,30% 2,77% 6,71%
Machinery 3,02% 2,96% 4,41%
Electronic and communication equipment -0,31% 5,41% 5,32% Transportation and motor vehicles -6,53% 1,15% 5,54% Paper and paper products -1,84% 1,35% 4,40%
Rubber products -1,67% 2,13% 4,60%
Chemicals -4,57% 1,61% 8,10%
Pharmaceuticals -0,56% 0,22% 0,36%
Perfumes, soap and candles 6,17% 4,78% -0,54%
Plastic products -1,71% -2,88% 5,89%
Textiles -1,61% 4,30% 2,67%
Clothing, fabric products and footwear -4,48% 1,11% 1,23%
Food -0,88% 3,21% 4,66%
Beverages -0,52% 4,65% 6,68%
Tobacco 1,59% 0,82% 6,43%
average -1,03% 2,00% 4,29%
note: TFP estimated by W2SLS.
4
Pr oduct ivit y Change and Tr ade L iber alizat ion
Following the same procedure as is Section 3.2, we performed Hauss-man speciÞcation tests and the results once again favored the Þxed-effects method, which we therefore used in all regressions. We also ran the same diagnosis test to check for the endogeneity of trade variables. It could be the case that lower productivity sectors, being less able to compete with imports, received higher protection. We found, for all combinations of trade and labor variables, that the OLS test is consistent, so we did not use any instrumental method to test for the links between productivity growth and trade policy. We started regressing either nominal tariffs (NT) or effective protection rates (EPR) on labor productivity or TFP growth rates. We then included other variables that previous empirical or theoretical studies found relevant to explain productivity growth. In addition to testing their signiÞcance for the present case, this also served to test the robustness of our results. If the inclusion or exclusion of variables dramatically changed the magnitude, sign or signiÞcance of NT or EPR estimates, the results would be considered fragile and we would reject the link between them and productivity growth
We basically tested 3 additional variables: import ratio, export ratio and inßation. The trade ratio variables are industry-speciÞc indices. They may be considered direct measures of openness but also, especially in the case of imports, indirect measures of technological adoption (see, for instance, Coe, Helpman and Hoffmaister(1995) and Holmes and Schmitz (1995)). Another channel of imports affecting growth would be increasing returns — as in Grossman and Helpman (1991). The negative impact of inßation on growth is well documented (e.g., Fischer(1993)). One possible channel would be the increase in uncertainty brought about by higher price volatility (Ramey and Ramey (1996)). For our regressions, 16 industry sector inßation rates were constructed from industry price indices. Export ratios may also be used to test export led growth arguments.
In what follows we present three sets of regressions, with different in-dependent variables: labor productivity, TFP constructed without human capital and TFP with human capital. We used the following equation in all estimations:
·
Yit= βi+ φ.Zit+ εit, i= 1, ...,16, t= 1985, ...,1997 (4)
where Y·it is the growth rate of productivity (either labor productivity or
TFP),Zit is a vector of independent variables that always contains one of
4.1
L ab or pr oduct ivit y
Given the high correlation ( 0.95) between the two labor productivity mea-sures constructed, we opted to present only the results of the estimations that used ”labor force used in production” as the labor variable. Regression results with hours were very similar, as expected. Table 5 presents these results.
Table 5: Labor Productivity Growth Regressions Model Independent Variable
N T ERP M
1 −0.041
(−7.96)
2 −0.048
(−7.18)
3 −0.045
(−7.35)
0.001 (1.29)
4 −0.037
(−5.42)
0.033 (3.17)
Note: t-statistic in parentheses;N T: log of nominal tariffs; ERP: log of effective protection rate;M: log of industry-import ratio. 192 observations. Method: WLS
The results reported in Table 5 conÞrm the negative relationship be-tween labor productivity and trade barriers. They are also robust to changes in the set of control variables. In models 2 and 4 one can see that a 30% reduction in the effective protection rate implies an increase between 1.5% and 1.2% in the growth rate of labor productivity. The inclusion of im-port ratio, inßation and/or export ratio (not reported here) did not change the results, although the estimated coefficients were smaller in general. Re-member that in certain cases (see Table 3) effective protection dropped from more than 200% to less than 25% and that, on the average, it fell from 75% to 20%. Hence, the present results would imply, for instance, that the 70% mean reduction in effective protection rate could explain an increase of 3 to 4 points in the labor productivity growth rate. Remember also that prior to trade liberalization labor productivity was falling at an annual rate of 1% and that in the last 4 years, it increased 8% per year on average.
elasticities are the same order of magnitude as in Models 2 and 4. A 20% reduction in the average nominal tariff for any industry would induce increases around 1% of its productivity growth rate. We have seen that the average tariff reduction in the period was around 85%, so that, according to the estimations above, this brought a 6% increase in the productivity growth rate.
With respect to the other control variables, the impact of the inßation rate was either estimated as negligible or non-signiÞcant. This result holds also for TFP regressions. Uncertainty or own price increases do not seem to be an issue for industry productivity determination. The estimated co-efficient of import ratio had the expected sign and was signiÞcant in some cases. Higher sector imports seem to be mildly correlated to increases in labor productivity. On the other hand, export ratios were not robust and not signiÞcant in almost all regressions6.
4.2
Tot al Fact or P r oduct ivit y
Table 6 presents the results of the estimations of equation (4) with TFP growth rate as the dependent variable.
Table 6: TFP Growth Regressions(w/o Human Capital) Model Independent Variable
N T ERP M
1 −0.031
(−6.23)
2 −0.040
(−6.10)
3 −0.030
(−5.55)
2,30 (0.66)
4 −0.038
(−5.41)
1.75 (0.44)
note: t-stat. in parentheses, method:WLS
Results are similar to those obtained with labor productivity. Whether trade barriers are measured by the effective rate of protection or nominal tariffs, the estimated effect on total factor productivity growth is negative, robust to control variables and always signiÞcant. The estimated coeffi -cients are slightly smaller, but of relevant magnitude in any event: −0.03
6
in the regressions with nominal tariffs, and −0.04 in the regressions with effective rate of protection. This is somewhat to be expected, as now we are subtracting the effect of capital stock; moreover, TFP growth rates are on average considerably smaller than labor productivity growth rates. Still, trade liberalization in the country can explain a large part of TFP growth: the decrease in the effective rate of protection observed in the period implies, according to our estimations, an increase of 3% in the TFP growth rate. If we use nominal tariffs, the estimated impact is even larger, as tariff reduc-tion is more dramatic than the drop in the effective rate of protection and the estimated elasticity is also higher in absolute value. Results for import ratio, export ratio and inßation follow exactly those of the labor productiv-ity case. For instance, the estimate effect of inßation is not signiÞcant at the usual conÞdence interval.
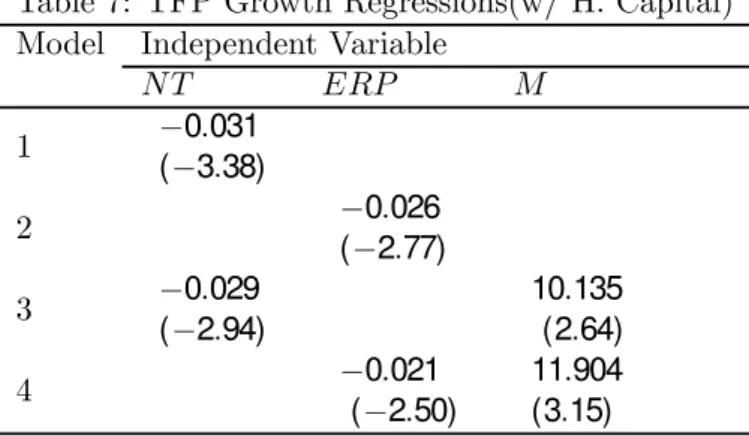
Table 7 presents regression results of the case where TFP was constructed considering human capital.
Table 7: TFP Growth Regressions(w/ H. Capital) Model Independent Variable
N T ERP M
1 −0.031
(−3.38)
2 −0.026
(−2.77)
3 −0.029
(−2.94)
10.135 (2.64)
4 −0.021
(−2.50)
11.904 (3.15)
Note: t-stat. in parentheses. Method: WLS
4.3
Out put G r owt h R egr essions
A potential restriction to the previous regressions is that when weÞrst es-timate the TFP and then the effect of trade barriers on it, the errors of the two sets of regressions might compound on each other. The Þnal es-timated elasticity, hence, might be eses-timated less precisely than if we just estimate a production function directly, substituting it in the trade variable. In other words, we have been assuming the following relationship between productivity growth and, for instance, nominal tariffs:
•
T F Pit
T F Pit
= βi+ φN Ti+ εit
whereβi is the country-speciÞcÞxed effect andεit is the disturbance term.
So we could plug the above expression in (3) and obtain:
•
Yit
Yit
= βi+ φN Ti+ α. •
Kit
Kit + γ.
•
Lit
Lit
+ εit (5)
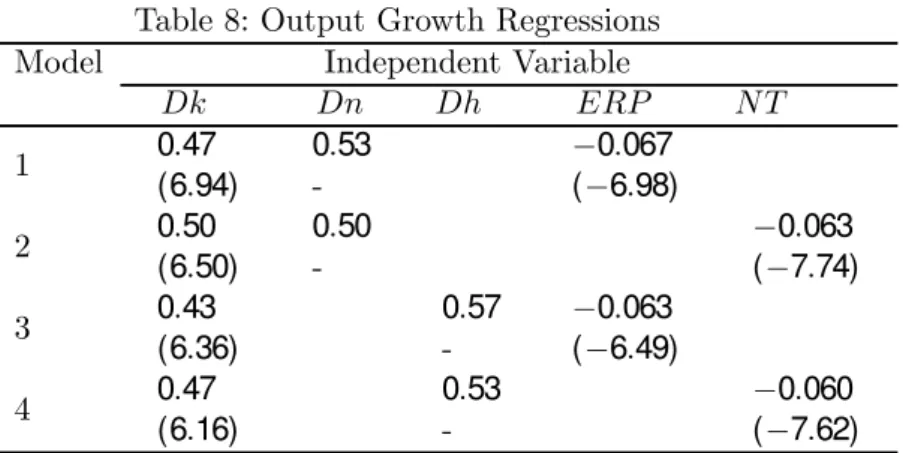
This type of model was used, for instance, in Harrison(1995) for panel data of developing countries. In this case, the effect of trade barriers on out-put growth when directly controlling for factor growth is estimated. Table 8 below presents the results of the estimation of equation (5) using our panel of Brazilian industries:
Table 8: Output Growth Regressions Model Independent Variable
Dk Dn Dh ERP N T
1 0.47
(6.94)
0.53
-−0.067 (−6.98)
2 0.50
(6.50)
0.50
-−0.063 (−7.74)
3 0.43
(6.36)
0.57
-−0.063 (−6.49)
4 0.47
(6.16)
0.53
-−0.060 (−7.62)
Note: t-statistic in parentheses. Dk, DnandDh: growth rate of physical capital, labor force and hours, respectively.
4.4
A lt er nat ive Fr am ewor ks
One potential caveat to our results is that output is used as a proxy for value-added in the regressions that construct the industry speciÞc TFP growth. Similarly, labor productivity measure does not control for the change in intermediate input. So, given that the value of nominal tariffs and effective protection rates are negatively correlated to imports, the estimated trade reform effect on productivity may have captured the effect of trade reform on the increasing imported materials into the production of the industries.
There are no value-added data collected in any survey, but there is a (poor) proxy,value of industrial transformation (VIT), obtained in the An-nual Industry Survey ( “Pesquisa Industrial AAn-nual”) of the IBGE ( ”Brazil-ian Bureau of Geography and Statistics”). It subtracts from gross output the value of most materials and services used. There are some serious method-ological problems with this series and, in general, data obtained from the annual survey is not as trustworthy as the monthly survey data used in this paper. Nonetheless, we could gain some insights from the study of the behavior of the VIT series.
and effective protection rate7. In the model that used nominal tariff the estimated coefficient was only signiÞcant at 9%, but in the case of effective protection rate results were very similar to those in the previous sections, the estimated coefficient signiÞcant at the usual levels and close to−0.10. Hence, we have indications that the estimated trade reform effect on productivity stands for changes in the value-added proxy and the use of output does not seem to be a problem.
Finally, one may also object to the assumptions of constant returns to scale technology and perfectly competitive goods and input markets used in the construction of TFP. Moreover, trade reform is likely to alter the competitive environment, but we assumed perfect competition before and after liberalization. We follow Harrison(1994) in using a procedure based on Hall(1988) and tested, jointly, perfect competition and market structure stability, as measured by changes in (estimated) price-cost margins. How-ever, results are slightly sensitive to the factor shares used in the test and if conveniently picked one could impose any result8. We could not use the shares estimated in Section 3.2 as they were obtained under the hypothe-sis of perfect competition, so in order to avoid arbitrary choices we tested different values.
For the case where labor share was assumed to be 0.65, we could not reject the null of perfect competition in a majority of industries (11 out of 16). Moreover, there was no evidence, for any industry, of ( statistically signiÞcant) changes in mark-ups after liberalization. For theÞve industries where perfect competition was rejected, labor to capital ratio increased or had no trend before trade liberalization and then decreased after it. Ac-cording to Harrison´s (1994) Figure 1, this fact combined with price to cost margins greater than one implies in under-estimation of productivity gains after trade reform. Hence, the perfect competition assumption in theseÞve cases, if anything, is hurting the case of trade liberalization affecting pro-ductivity growth9.
7
TheÞxed-effect method was used after testing. The data set consists of 45 industries and 7 time-series observations. We did not include human capital for lack of data.
8
This was not a problem in Harrison´s paper because it had information of the value of the observed share for each plant in every year of the study.
9
5
Concluding R em ar ks
All the estimated measures of productivity growth for the industries studied in this article display a common pattern of behavior in the years between 1985 and 1997: they fall or stagnate until 1990 and then increase remarkably after that. In the same period, the country moved to liberalize its interna-tional trade, reducing tariffs, eliminating import quotas and reserved market shares and consequently decreasing the protection of domestic production.
Results in this article allow us to conclude that there is a signiÞcant and robust relation between these two facts, so that trade reform had an im-portant impact on industrial performance. In the cross-sectional dimension, the estimations imply that the higher the protection the lower the growth rate of TFP and labor productivity of a given industry. These results are robust to changes in the data used, in the controls and in the methodology and do not depend on any restrictive assumption.
R efer ences
[1] Ben-David, D. (1993) ”Equalizing Exchange: Trade Liberalization and Income Convergence,” Quarterly Journal of Economics, 108(3),
[2] Coe, D.T., E. Helpman, A.Hoffmaister(1995) “North-South R&D Spillovers,” NBER Working Paper 5048.
[3] Edwards,S.(1993) ”Openness, Trade Liberalization and Growth in De-veloping Countries,” Journal of Economic Literature, 31, 3. pp. 1358-1393.
[4] Fisher, S.(1993) “The Role of Macroeconomic Factors in Growth,” Jour-nal of Monetary Economics, 32, pp.485-512.
[5] Grossman, G. and E. Helpman(1991) “Small Open Economy,” in Inno-vation and Growth in the Global Economy, pp. 144-176, MIT Press.
[6] Hall, R. (1988) ”The Relation Between Price and Marginal Cost in the U.S. Industry,” Journal of Political Economy, 96, 5, pp. 921-947.
[7] Hall,R. and C. Jones(1996) “The Productivity of Nations, ” NBER working paper 5549.
[8] Harrison, A. (1994) “Productivity, Imperfect Competition and Trade Reform, Theory and Evidence,” Journal of International Economics, 36, pp. 53-73.
[9] Harrison, A. (1995) “Openness and Growth: a Time-Series, Cross-Country Analysis for Developing Countries,” NBER Working Paper 5221.
[10] Holmes, T., and J. Schmitz Jr.(1995) “Resistance to New Technology and Trade Between Areas,” FRB of Minneapolis Quarterly Review, Winter, pp. 2-18.
[11] Hsiao, C. (1986) “Analysis of Panel Data,” Cambridge University Press, New York, NY.
[12] Kehoe, P. J. and T. J. Kehoe. (1994) “Capturing NAFTA’s Impact With Applied General Equilibrium Models,” FRB Minneapolis - Quar-terly Review, v18(2), 17-34.
[14] Lee, J.W. (1996) “Government Interventions and Productivity Growth,” Journal of Economic Growth, pp. 391-414.
[15] Pack, H. (1988) “Industrialization and Trade,” in Chenery, H. and T. N. Srinivasan (org.) ”Handbook of Development Economics,” North Holland, NY, NY.
[16] Parente, S. and E.C. Prescott(1999) “Monopoly Rights: A Barrier to Riches,” American Economic Review, vol. 89(5), pp. 1216-1233.
[17] Parente, S. and E.C. Prescott(2000). “Barriers to Riches,” Mimeo, Uni-versity of Minnesota.
[18] Pinheiro. A. C. and G. B. Almeida(1994) “Padrões Setoriais da Pro-teção na Economia Brasileira,” discussion paper 365, Ipea.
[19] Ramey, G. and V. Ramey(1995), “Cross-Country Evidence on the Links Between Volatility and Growth,”American Economic Review, 85(5), pp. 1002-1037.
[20] Rodríguez, F. and D. Rodrik, (1999) “Trade Policy and Economic Growth: a Skeptic ‘ Guide to the Cross-National Evidence,” NBER working paper 7081.
[21] Rodrik, D. (1999) “Making Openness Work: The New Global Economy and the Developing Countries,” The Overseas Development Council, Washington, D.C.
[22] Srinivasan and Bhagwati (1999), “Outward-orientation and Develop-ment: Are Revisionists Right?,” mimeo, Yale University.
[23] Tybout, J., J. De Melo and V. Corbo. (1991) “The Effects of Trade Re-forms On Scale And Technical Efficiency: New Evidence From Chile,” Journal of International Economics, v31(3/4), pp. 231-250.
A
D at a
• Labor and Output: Labor productivity and output series were con-structed using information obtained in the ”Pesquisas Industrial Men-sal - Produção Física” ( Monthly Industry Survey - Physical Produc-tion) and ”Pesquisas Industrial Mensal-Dados Gerais” (Monthly In-dustry Survey - General Data ), both from IBGE, the public statistics bureau of Brazil. We constructed two measures of productivity: one used ”total work hours employed in production” and the other ”total labor force employed in production.”. These series do not include ad-ministrative workers and services such as security or cleaning, so that the corresponding productivity measure is not affected by the observed trend of sub-contracting some of these services.
• Physical Capital: The capital series was constructed from investment data obtained in the ”Pesquisa Industrial Anual ( ”Annual Industry Survey”) of the IBGE. We used the perpetual inventory method, as-suming a constant annual depreciation rate of 5% per year, and in-vestment values were deßated by the gross capital deßator calculated in the national account. In order to remove possible effects of business cycleßuctuations on TFP, the stock of capital obtained was multiplied by the rate of utilization of sector capacity to obtain the fraction of physical capital effectively used in production.
• Human Capital: As for human capital, there is no detailed information at the industry level, only aggregated information of average schooling years of the labor force for the two main groups, ”modern” and ”tra-ditional” industries, surveyed by the IBGE. The Þrst group includes the following sectors: transportation equipment, electronic and com-munication equipment, mechanical machinery, plastic products and metalworking, the remaining sectors being classiÞed as traditional. Consequently, most of the variation is in the time-series dimension, given that for each year there are only two observations of the human capital stock.
• Effective Protection Rate: this variable was constructed using the fol-lowing formula:
gj = (tj− alcij.ti)/(1− alcij)
wherealc
ij = adij.(1 + tj)/(1 + ti) is the free trade technical coefficient,
at international prices); ad
ij is the distortionary technical coefficient,
measuring inputiparticipation inÞnal price of industryj,at domestic prices;tj is the nominal tariffin industryj andti is the nominal tariff