COHESIVE MIXED MODE DAMAGE MODEL APPLIED TO THE
SIMULATION OF THE MECHANICAL BEHAVIOUR OF A REPAIRED
SANDWICH BEAM
Dimitra A. Ramantani, Raul D.S.G. Campilho, Marcelo F.S.F. de Moura, Antonio T. Marques
Department of Mechanical Engineering and Industrial Management (DEMEGI), Faculty of Engineering of Porto University (FEUP),
Rua Dr. Robeto Frias s/n, 4200-465 Porto, Portugal [email protected]
ABSTRACT
The behaviour of a repaired sandwich beam loaded under four point bending is simulated using the ABAQUS® software. Both overlap and scarf repair, suitable for sandwich structures, were simulated considering two dimensional nonlinear material and geometrical analysis. Special developed interface finite elements including a trapezoidal cohesive mixed-mode damage model appropriate for ductile adhesives were used in order to simulate the adhesive layer. The proposed model is intended to replace the continuum finite elements traditionally used to simulate the adhesive layer, thus reducing the computational effort necessary to obtain results. Double Cantilever Beam (DCB) and End Notched Flexure (ENF) tests were used to obtain the cohesive laws of the adhesive in pure modes I and II, respectively. The fracture energies (JIc and JIIc) are obtained using a new data reduction scheme based on
crack equivalent concept allowing overcoming crack monitoring difficulties during propagation in these fracture characterization tests. The remaining cohesive parameters (δ1,I, δ1,II, δ2,I, δ2,II) are obtained using
an inverse method, which is based on the fitting of the numerical and experimental P-δ curves by a fine tuning process. This procedure allows fixing the referred cohesive parameters to be used in the stress analyses and strength predictions of repaired sandwiches. The numerical model allowed the simulation of damage initiation and growth. Geometric changes, such as patch overlap length and scarf angle were considered in the analysis in order to assess their influence on the repair efficiency. Conclusions were drawn about design guidelines of sandwich composite material repair.
1. INTRODUCTION
The sandwich structure is a special form of laminated composite where a relatively thick lightweight and compliant core separates two thin, stiff and strong faces. This specific configuration and combination of materials offers to the sandwich structure characteristics essential for the transportation industry such as high flexural resistance and stiffness, high impact strength, high corrosion resistance and low thermal and acoustics conductivity. Sandwich composite materials find application nowadays in satellites, large aircrafts, high speed trains, metro trains, bushes and navy’s ship hulls [1]. A significant drawback though of sandwiches is their inability to withstand structural loading after damage caused by low velocity impact. Low velocity impact, caused for example by an accidental fall of a tool or a bird strike, can lead to delamination within the outer skin or at the interface between the skin and the core. In skin/core debond the face sheet looses its lateral support and the integrity of sandwich construction is lost. Under special in-plane loading conditions (a well-known example is the in-plane compression), a debonded skin may buckle and debond further even under very low stress levels [2, 3]. Considering the high cost associated to the replacement of a composite structure along with current ecological requirements, repair becomes a fundamental tool towards enhancement of composite’s product life.
A repair of a composite structure can be executed with an application of a patch attached either by mechanical fastening or by adhesive bonding. Adhesive bonding can offer substantial benefits relatively to the mechanical fastening method, including no considerable weight increasing, more uniform stress distributions, better fatigue behaviour, minimal shape change and reduction of the maintenance costs. There are two repair configurations suitable for sandwich structures suffering delamination where replacement of the core does not take place, namely overlap and scarf joining (Figure 6). In recent years the research on composites repair has been increased. Numerical models for the prediction of the mechanical behaviour of repaired composite structures offer a beneficial alternative to costly and time consuming experimental tests. In this context the applicability of cohesive damage models has become a popular instrument. Cohesive damage models combine aspects of stress based analysis to model damage initiation and fracture mechanics to deal with damage propagation. One of the most important advantages is related to its capacity to simulate onset and non-self-similar growth of damage overcoming the difficulties inherent to stress and fracture based criteria. No initial crack is needed and damage propagation takes place without user intervention.
In this paper a trapezoidal cohesive mixed mode damage model adequate for ductile adhesives is presented. DCB and ENF tests are used to obtain the cohesive laws of the adhesive in pure modes I and II, respectively. Jic (i=I, II) are obtained using a new data
reduction scheme based on the crack equivalent concept allowing to overcome difficulties inherent to crack monitoring during propagation. The remaining cohesive parameters (δ1,I, δ1,II, δ2,I, δ2,II) are obtained with an inverse method, fitting the
numerical P-δ curves with the experimental ones and allowing complete fracture characterization of the adhesive in pure modes I and II. This model is applied to the simulation of the mechanical behaviour of a repaired sandwich beam subjected to four point bending using the ABAQUS® software. The model is incorporated in the numerical software via interface elements replacing the solid finite elements traditionally used to simulate the adhesive layer, thus reducing the computational effort. Overlap and scarf repair configurations are considered in the analysis. The objective is to obtain stress distributions at critical regions and to evaluate the residual strength of the repaired sandwich beams. Some of the parameters concerning the good performance of the repair such as the overlap length and the scarf angle are studied in order to asses their influence on the repair efficiency
3. TRAPEZOIDAL COHESIVE DAMAGE MODEL
The stress and fracture mechanics based criteria are commonly used to predict failure in composite materials. Stress based methods behave well at predicting damage onset and fracture mechanics have already demonstrated accuracy in crack propagation modelling. Both of the aforementioned methods present drawbacks. Specifically, the stress based methods present mesh dependency during numerical analysis when stress singularities are present while fracture mechanics approach relies on the definition of an initial flaw or crack length. In order to overcome the referred drawbacks and exploit the usefulness of the described advantages, cohesive damage models emerge as suitable options [4]. Cohesive damage models combine aspects of stress based analysis to model damage initiation and fracture mechanics to deal with damage propagation. Thus, it is not necessary to take into consideration an initial defect and mesh dependency problems are overcome.
A cohesive mixed-mode (I+II) damage model based on interface finite elements was developed to simulate damage onset and growth. The adhesive is simulated by these
elements, which have zero thickness. To simulate the behaviour of ductile adhesives, a trapezoidal softening law between stresses (σ) and relative displacements (δr) between
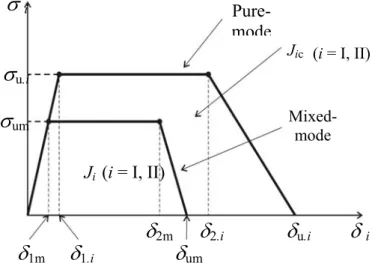
homologous points of the interface elements was employed (Figure1). The constitutive relationship before damage onset is
(1)
= r
σ Eδ
where E is a stiffness diagonal matrix containing the stiffness parameters ei (i=I, II)
defined as the ratio between the Young’s (mode I) or shear modulus (mode II), and the adhesive thickness. The effect of adhesive thickness is included this way and it could be neglected in the finite element mesh. In the pure-mode damage model, damage initiates when the relative displacement exceeds δ1,i. From this point up to final failure (δu,i) a
progressive softening is simulated in order to account for the different failure processes occurring in the vicinity of the crack tip. In this region, known as the Fracture Process Zone (FPZ), several damage processes, like plasticity and micro-cracking occur, which is simulated by this softening law. Damage evolution is implemented through a damage parameter ranging between zero (undamaged) and one (complete failure). The softening relationship can be written as
(
)
= - r
σ I D Eδ (2) where I is the identity matrix and D is a diagonal matrix containing, on the position
corresponding to mode i (i=I, II) the damage parameter. In general, bonded joints or repairs are subjected to mixed-mode loading. Therefore, a formulation for interface finite elements should include a mixed-mode damage model (Figure 1). Damage onset is predicted using a quadratic stress criterion
2 2 I II I u,I u,II II u,II I 1 if 0 if 0 σ σ σ σ σ σ σ σ ⎛ ⎞ ⎛ ⎞ + = > ⎜ ⎟ ⎜ ⎟ ⎜ ⎟ ⎜ ⎟ ⎝ ⎠ ⎝ ⎠ = ≤ (3)
where σi, (i=I, II) represent the stresses in each mode. It is assumed that normal
compressive stresses do not induce damage. Considering equation(1), the equation (3) can be rewritten as a function of the relative displacements
2 2 1m,I 1m,II 1,I 1,II 1 δ δ δ δ ⎛ ⎞ ⎛ ⎞ + = ⎜ ⎟ ⎜ ⎟ ⎜ ⎟ ⎜ ⎟ ⎝ ⎠ ⎝ ⎠ (4)
where δ1m,i (i=I, II) are the relative displacements in each mode corresponding to
damage initiation. Stress softening onset (δ2,i) was predicted using a quadratic relative
displacements criterion similar to (4), leading to
2 2 2m,I 2m,II 2,I 2,II 1 δ δ δ δ ⎛ ⎞ ⎛ ⎞ + = ⎜ ⎟ ⎜ ⎟ ⎜ ⎟ ⎜ ⎟ ⎝ ⎠ ⎝ ⎠ (5)
where δ2m,i (i=I, II) are the relative displacements in each mode corresponding to stress
softening onset. Crack growth was simulated by the linear fracture energetic criterion. I II
Ic IIc 1
J J
J +J = (6)
When equation (6) is satisfied damage growth occurs and stresses are completely released, with the exception of normal compressive ones. Using the proposed criteria (equations (4), (5) and (6)), it is possible to define δ1m, δ2m and δum and establishing the
1,m m m 1 d δ δ = − (7)
and in the stress softening part of the cohesive law
(
)
(
)
1,m u,m m m m u,m 2,m 1 d δ δ δ δ δ δ − = − − (8)A detailed description of the model is presented in the work of Campilho et al. [5].
Figure 1: The trapezoidal softening law for pure-mode and mixed-mode. 2. DETERMINATION OF THE TRAPEZOIDAL LAWS
In order to define accurately the cohesive parameters of the trapezoidal law for pure mode I and II, Double Cantilever Beam (DCB) and End-Notched Flexure (ENF) (Figure 2) fracture characterization tests are performed respectively. It is well known that the properties measured from bulk tests are not representative because the adhesive as a thin layer behaves differently than the adhesive in bulk form [6]. In DCB and ENF specimens the thickness of the adhesive is similar to the one used in the bonded joints. The classical methods, Compliance Calibration Method (CCM) and the Corrected Beam Theory (CBT), frequently used in order to measure the fracture energies [7] depend on accurate crack length measurement during propagation. This task is quite difficult due to the development of a fracture process zone ahead of the crack tip in consequence of the nucleation of multiple micro-cracks through the adhesive thickness and plastification. To overcome these difficulties a new data reduction scheme based on the crack equivalent concept, and depending only on the specimen compliance, is presented for the two fracture characterization tests. A detailed description is presented in the work of de Moura et al. [8].
DCB specimen
The specimen compliance can be calculated from the beam theory accounting for shear effects. 3 3 1 1 8 12 5 a a C E Bh BhG = + 3 (9) However, some issues like stress concentrations at the crack tip, influencing the P-δ
curve, are not accounted for in the beam theory. To overcome these discrepancies, a
σ
u,iσ
umσ
i Pure-mode Mixed-mode Jic Jiδ
δ
δ
δ
δ
1mδ
1,iδ
um u,i i 2,i 2m (i = I, II) (i = I, II)corrected flexural modulus can be used instead of E1. The flexural modulus of the
specimen can be obtained from equation (9) using the measured initial compliance (C0)
(
)
1(
)
3 0 0 f 0 3 13 12 8 5 a a E C BhG Bh − ⎛ + Δ ⎞ + =⎜⎜ − ⎟⎟ ⎝ ⎠ Δ (10) where Δ is the root rotation correction for the initial crack length, obtained from thelinear regression of C1/3=f(a0).On the other hand, an equivalent crack length (aeq) must
be considered during propagation to account for the FPZ effects at the crack tip. The equivalent crack can be calculated from equation (9) as a function of the specimen compliance registered during the test and considering aeq = + Δ + Δa aFPZ instead of a.
JIc can now be obtained using the Irwin-Kies equation, which leads to
2 2 eq Ic 2 2 f 13 2 6 1 5 a P J B h h E G ⎛ ⎞ = ⎜⎜ + ⎝ ⎠⎟⎟ (11) ENF specimen
Using the beam theory, the compliance equation for the ENF specimen is
3 3 1 1 3 2 3 12 10 a L L C E I G Bh + = + 3 (12) The flexural modulus in this case can be obtained using the initial compliance C0 and
the initial crack length a0
1 3 3 0 f 0 13 3 2 3 12 10 a L L E C I G Bh − ⎛ ⎞ + = ⎜ − ⎝ ⎠⎟ (13)
The effect of the FPZ can be included considering the compliance and the equivalent crack concept during propagation. Combining equations (12) and (13) it can be written
1 3 3 corr corr eq FPZ 0 0corr 0corr 2 Δ 1 3 C C a a a a L C C 3 ⎡ ⎛ ⎞ ⎤ = + =⎢ + ⎜ − ⎟ ⎥ ⎝ ⎠ ⎣ ⎦ (14)
where Ccorr is given by
corr 13 3 10 L C C G Bh = − (15)
JIIc can now be obtained using the Irwin-Kies equation
2 2 eq IIc 2 f 9 16 P a J 3 B E h = (16)
The presented methodology allows obtaining Jic (i=I, II) using only the P-δ curve. For
this reason it is named Compliance-Based Beam Method. Using this method it is not necessary to measure the crack length during propagation because the calculated equivalent crack length is used instead of the real one. Another advantage is related to the fact that aeq includes the effect of the FPZ, not taken into account when the real
h 1 3 t h 2 L P,δ L 0 a
Figure 2: Geometry of the DCB (a) and ENF (b) specimens.
In order to define completely the cohesive damage model it is necessary to determine the critical displacements corresponding to the inflexion points (δ1,i, δ2,i). The first one
is associated to the adhesive local strength (σu,i) and the second one defines the extent
of the plateau region (Figure 1). These parameters were obtained by an inverse method. This method consists on inputting each Jic obtained by DCB and ENF experimental
tests in the respective DCB or ENF numerical model including the trapezoidal mixed-mode cohesive damage mixed-model simulating the adhesive layer. Afterwards, a fitting iterative procedure of the numerical and experimental P-δ curves takes place allowing to define the remaining cohesive parameters σu,I (or δ1,I) and δ2,I.
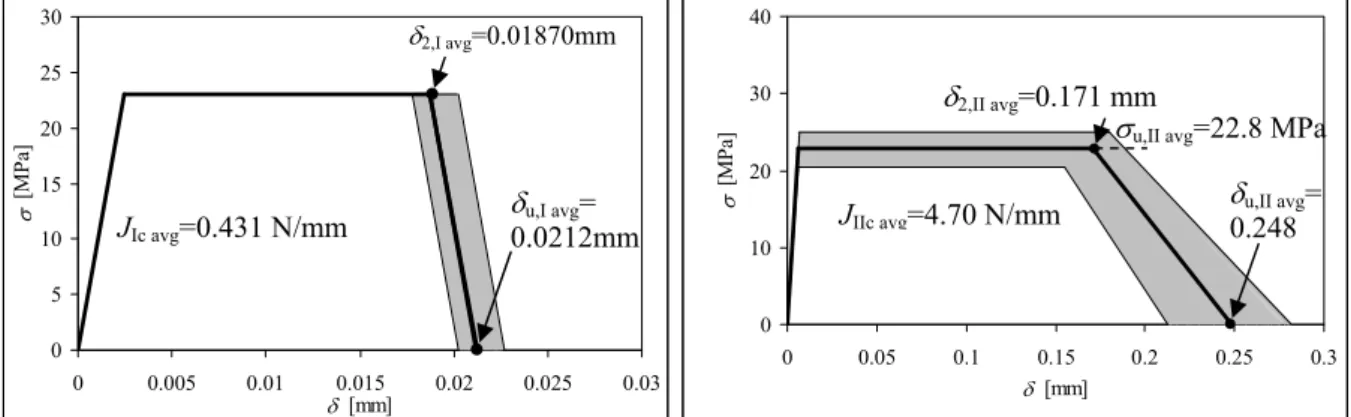
Unidirectional 0º lay-ups of carbon/epoxy prepreg (TEXIPREG HS 160 RM) adherends with 0.15 mm ply thickness were used for the experiments. Their mechanical properties are presented in Table 1 [5]. A ductile epoxy adhesive Araldite® 2015 was used, whose elastic properties were measured experimentally in bulk tests (E=1850 MPa, ν=0.3). The experimental load-displacement curve was used to obtain the respective R-curve using the CBBM. The fracture energy corresponds to the plateau value of the R-curve. Figure 3 show the trapezoidal cohesive laws range in pure modes I and II, respectively, and the average values of Jic, δ2,i and δu,i (i=I, II).
0 10 20 30 40 0 0.05 0.1 0.15 0.2 0.25 0.3 δ [mm] σ [M P a] δu,II avg= 0.248 δ2,II avg=0.171 mm
σu,II avg=22.8 MPa
0 5 10 15 20 25 30 0 0.005 0.01 0.015 0.02 0.025 0.03 δ [mm] σ [M P a] δ2,I avg=0.01870mm δu,I avg= 0.0212mm JIIc avg=4.70 N/mm JIc avg=0.431 N/mm
Figure 3: Trapezoidal cohesive laws range in pure mode I of the DCB tests and in pure mode II of the ENF tests.
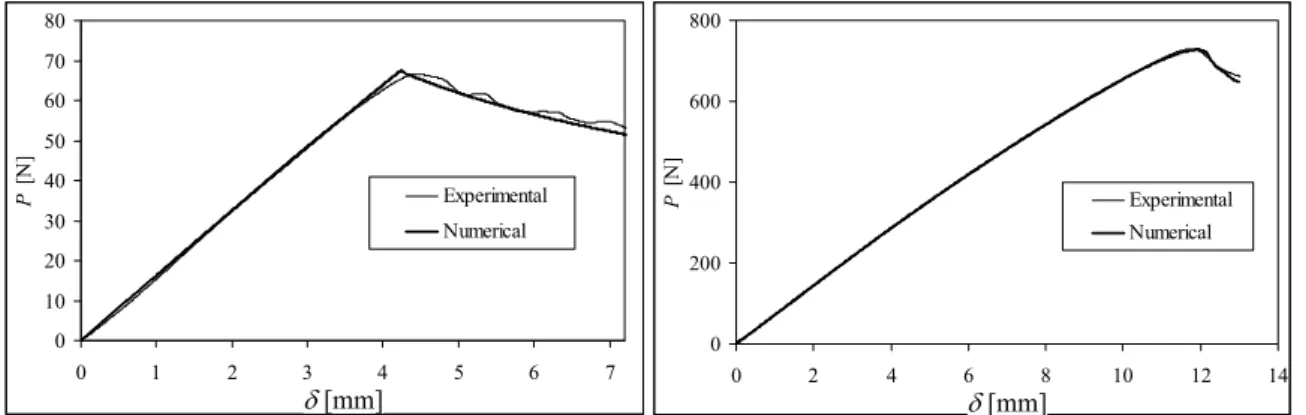
In order to check the validly of the numerical model, the cohesive laws given above were inputted in numerical DCB and ENF models simulating the adhesive layer and the
P-δ curves obtained were compared with the experimental ones. Figure 4 present for one DCB and ENF specimen a comparison between the experimental and numerical
P-δ curves. Excellent agreement was observed in both cases. A comparison between the
numerical and experimental R-curves for both, DCB and ENF tests, was performed as well with the objective to prove the adequacy of the CBBM method to measure the Jic.
0 10 20 30 40 50 60 70 80 0 1 2 3 4 5 6 7 δ [mm] P [N ] Experimental Numerical 0 200 400 600 800 0 2 4 6 8 10 12 14 P [N ] Experimental Numerical δ [mm] δ [mm] δ[mm]
Figure 4: Numerical and experimental P-δ curves for one DCB and for one ENF
specimen, respectively. 0.1 0.2 0.3 0.4 J Ic [N /mm] 0.5 0.6 60 65 70 75 80 aeq [mm] Experimental Numerical 0 1 2 J IIc [N /m m] 3 4 5 6 70 75 80 85 90 aeq [mm] Experimental Numerical JIIC [N/m m] JIC [N/m m] αeq [mm] αeq [mm]
Figure 5: Numerical and experimental R-curves on one DCB and for ENF specimen, respectively.
3. ANALYSIS
The trapezoidal cohesive mixed-mode damage model is applied on the simulation of the mechanical behaviour of a repaired sandwich beam subjected to four point bending. A two-dimensional non-liner material and geometrical numerical analysis was performed, using plane strain rectangular 8-node and triangular 6-node solid finite elements available in the ABAQUS® library. Overlap and scarf repairs, were simulated. The cohesive mixed-mode model is incorporated into the ABAQUS® software via interface elements with zero thickness placed along all the adhesive bond lines. The materials used in the analysis were unidirectional carbon-epoxy laminates with 0º orientation for the faces and the patches, a thermoplastic foam for the core and a high resistant resin that undergoes large plastic strain prior to failure for the adhesive. The mechanical properties of the materials as well as the cohesive properties of the adhesive are given in Tables 1 and 2 [5, 9].
Skins and patches
(carbon-epoxy) (Divinicell H100, PVC foam) Core (AralditeAdhesive ® 2015)
E1=1.09E+05 MPa ν12=0.342 G12=4315 MPa
E2=8819 MPa ν13=0.342 G13=4315 MPa E=111 MPa E=1850 MPa
E3=8819 MPa ν23=0.380 G23=3200 MPa ν=0.1 ν=0.3
Adhesive (Araldite® 2015) JIc [N/mm] JIIc [N/mm] σ[MPa] u,I σu,II [MPa] δ2,I [mm] δ2,II [mm] E [MPa] ν h [mm] 0.431 4.7 23.2 22.8 0.0187 0.171 1850 0.3 0.2
Table 2. Cohesive properties used to simulate the adhesive.
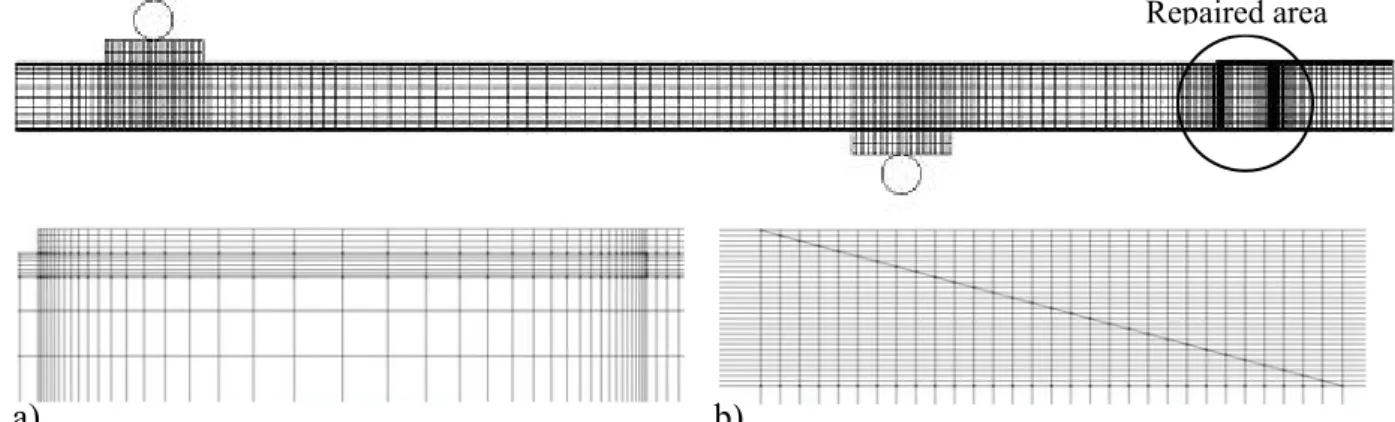
Geometrical details for both repair configurations are given in Figure 6. Symmetry conditions were used at the middle of the repaired specimen in order to save on computer resources (symmetry line A-A in Figure 6). Figure 7 shows details of the used mesh at the overlap and scarf region. Stress analysis and strength predictions were performed for both repair configurations and for various overlap lengths and scarf angles. The main objective is to minimise the stress concentrations at critical points therefore increasing the repair efficiency.
a)
B Filler plies
b)
tA tA
Figure 6: a) Overlap and b) scarf repair geometry.
th(thickness of the beam)=17.2mm; ts(thickness of the skins)=0.6mm; tA(thickness of the
adhesive)=0.2mm; tp(thickness of the patch)=0.3-1.2mm, L(length of the sandwich beam =700mm;
LR(length of damage)=60mm; Lp(overlap length)=5-30mm, Lt(bond length along the scarf tangential
direction); α(scarf angle)=30-450; t
c1= 35mm; tc2= 225mm;
A–A(symmetry line); δ(applied displacement); B(vertical adhesive bondline connecting the upper skin and the filler plies); t–n(local coordinate system).
* Le(ply thickness)=0.15mm, w(width)=25mm.
Repaired area
a) b)
Figure 7. Finite element model of the repaired sandwich beam and details of the mesh for a) an overlap and b) a scarf repair.
3.1. Overlap repair
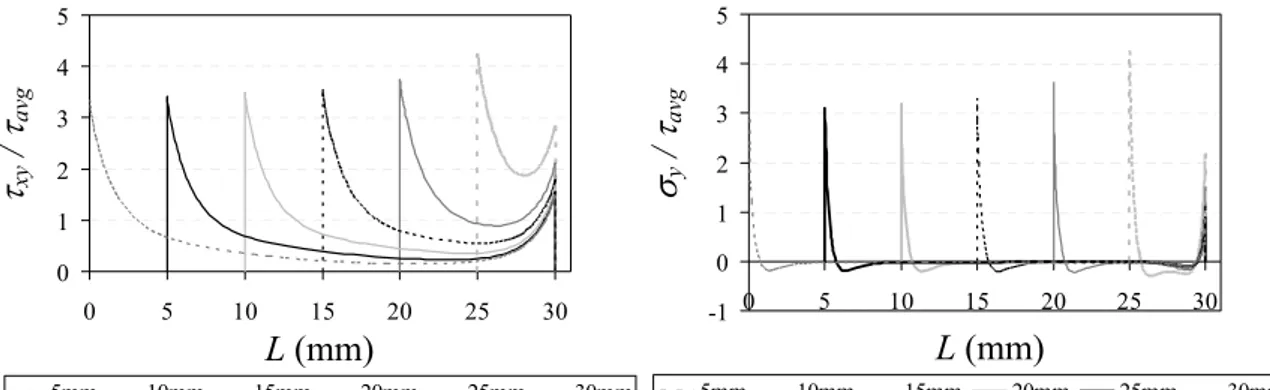
A stress analysis was performed for six different overlap lengths: 5, 10, 15, 20, 25 and 30mm. A 0.6 mm (4 plies) thick patch was used, equal to the thickness of the skins of the sandwich beam. The observed shear- and peel-stress distribution profiles along the overlap bond line LP (Figure 6) normalized by τavg, the average shear stress along the
15mm overlap, are presented in Figure 8. The stresses correspond to the typical ones obtained for these kinds of joints [10, 11]. Shear-stresses present two peaks at the overlap ends while peel stresses present a compressive behaviour at the inner region near the overlap ends and two tensile peaks at the edges. Shear and peel stress peaks are higher at the beginning of the overlap.
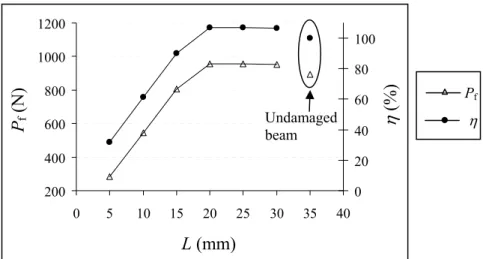
In Figure 9 the failure load (Pf) and the efficiency of the repair (η) as a function of the
overlap length are presented. Pf represents the load leading to the debonding onset at
the critical regions of the repair while η is considered to be the ratio between Pf of the
repaired specimen and the failure load of an equivalent undamaged one. It was observed an increase on the repair efficiency with the increase of the overlap length, an expected outcome since the bonding area becomes bigger. However, after a certain overlap length, 20mm, no further increase on the repair efficiency was observed. This fact is strictly connected to the shear stress distribution profiles at the inner region of the overlap. As shown in Figure 8, the shear stresses in the middle of the overlap become almost zero which means that no load transfer mechanism exists in this area (peel stresses are zero as well, Figure 8). Subsequently, further increase on the patch length has on advantage. The strength of the undamaged beam seems to be reached with an overlap repair of 18mm.
Damage growth
The damage onset was identified by simply observing the occurrence of softening onset at the nodes of the interface elements located at the singularity regions of the repair joint. In the overlap repair, it was observed that failure initiates in the vertical adhesive bonding region connecting the skin with the filler plies (region B, Figure 6) due to high pronounced normal stresses developed along the thickness of the adhesive. Once the vertical adhesive region fails, a new crack starts at the left bond edge of the overlap and grows along the overlap bond line while the crack in the B region continues propagating at the interface between the skin and the core and between the skin and the patch. This kind of failure was observed for all the overlap repairs studied. It should be noted that in real case the crack, after the failure of the B region, would probably continue propagating into the core. Indication of this are the extensively distorted elements of the core in the basis of the B region observed in the numerical analysis.
0 1 2 3 4 5 0 5 10 15 20 25 30 5mm 10mm 15mm 20mm 25mm 30mm -1 0 1 2 3 4 5 0 5 10 15 20 25 30 5mm 10mm 15mm 20mm 25mm 30mm τxy / τavg σy / τavg L (mm) L (mm)
Figure 8: Normalized a) shear and b) peel stress distributions in the adhesive along the overlap for different values of overlap length.
200 400 600 800 1000 1200 0 5 10 15 20 25 30 35 40 0 20 40 60 80 100 Pf (N) L (mm) η (%) Undamaged beam Pf η
Figure 9: Failure load, Pf, and repair efficiency, η, for different values of overlap length
3.2. Scarf repair
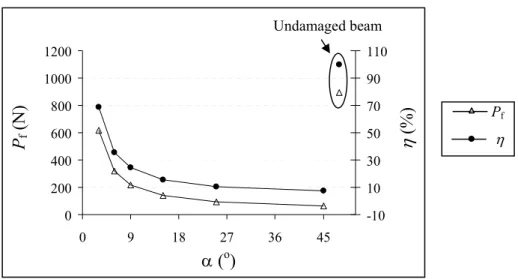
The normalized shear- and peel-stress profiles along the scarf length for scarf angles of 3, 6, 9, 15, 25 and 45º are presented in Figure 10. In general, both stresses are positive and nearly constant between the bond edges. No stress concentrations are observed at the ends of the bond line. For small scarf angles peel-stresses are negligible compared to shear indicating that shear is the main failure mechanism. As the scarf angle increases the peel stresses increase as well. For a scarf angle of 45o both shear and peel stress components present approximately the same magnitude. These results are in agreement with the analytical results presented by Objois et al. [12]. It should be noted that shear and peel stress profiles are not markedly influenced by the scarf angle. The failure load (Pf) and the efficiency of the repair (η) as functions of the scarf angle
are given in Figure 11. Small scarf angles lead to larger bond lengths and respective higher repair efficiency. From 45 to 15º scarf angle no substantial increase on the repair efficiency is observed but as the scarf angle is being reduced this parameter increases exponentially. This fact is closely related to the increase of the bond length and reduction of peel-stresses (Figure 10b), as the scarf angle is reduced. The trend observed in Figure 11 agrees with the ones found in Refs [13, 14] where experimental, numerical or both results are presented for scarf repaired laminates.
0.75 0.8 0.85 0.9 0.95 1 1.05 0 0.2 0.4 0.6 0.8 1 3 6 9 15 25 45 0 0.2 0.4 0.6 0.8 1 1.2 0 0.2 0.4 0.6 0.8 1 3 6 9 15 25 45 τtn / τavg σn / τavg t /Lt t /Lt
Figure 10: Normalized a) shear- and b) peel- stress distributions for different scarf angles along the normalized scarf length.
0 200 400 600 800 1000 1200 0 9 18 27 36 45 -10 10 30 50 70 90 110 Pf (N) α (o) η (%) Undamaged beam Pf η
Figure 11: Failure load, Pf, and efficiency, η, for the different scarf angles considered. Damage growth
In scarf repairs the type of failure showed dependence on the scarf angle. For low scarf angles damage initiates at the upper edge of the scarf and grows along the adhesive due to high shear-stresses. When the crack reaches the lower scarf edge it starts propagating along the interface between the skin and the core and between the patch and the core. For scarf angles higher than 15o the repair in the scarf region fails abruptly due to pronounced peel-stresses as indicated previously. Following, a crack propagates from the lower edge of the scarf to the interfaces between the skin and the foam. Again it should be noted that in real case the crack would probably continue propagating inside the foam core and near the interface between composite and foam.
4. CONCLUSIONS
In this work a trapezoidal mixed-mode cohesive damage model was developed to simulate the behaviour of ductile adhesives. A new data reduction scheme based on the crack equivalent concept was used to obtain the critical fracture energies in pure mode I and II with the DCB and ENF experimental tests respectively. This method, CBBM, does not require crack length monitoring during propagation and accounts for FPZ effects. The cohesive parameters of the trapezoidal laws in pure mode I and II were determined using an inverse method based on the fitting of the numerical P-δ curves with the experimental ones obtained from the fracture characterization tests. The comparison between numerical and experimental results showed the adequacy of the model to simulate the behaviour of the ductile adhesive. Additionally, it was veryfied that the proposed CBBM method provides accurate results on the measurement of the critical fracture energies.
A trapezoidal cohesive mixed mode damage model was applied on the simulation of the mechanical behaviour of overlap and scarf repaired sandwich beams subjected to four point bending. Several overlap lengths and scarf angles were considered in the analysis with the objective to study their influence on the repair efficiency and on the damage mechanism. It was verified that the overlap length does not affect the strength of the joint after a certain value since the inner region of the overlap bondline becomes unloaded. Failure initiates in all cases at the vertical adhesive region B where the skin connects with the filler plies (Figure 6) and follows the same path. The strength of the undamaged beam was reached with an overlap patch of 18mm and a thickness equal to
the thickness of the skins. The scarf repair study showed that for low scarf angles damage is dominated by shear. An increase of the scarf angle is followed by an increase of the peel stresses and subsequently a decrease on the repair efficiency. The increase of the peel-stresses affects also the way the joint fails, from progressive debonding of the repair region when low scarfs are used to abrupt failure. The strength of the undamaged beam was not obtained for any scarf angle.
5. REFERENCES
1 - Zenkert D. “The Handbook of Sandwich Construction”, EMAS, 1997.
2 - Berggreen C., “Non-uniform Compressive Strength of Debonded Sandwich Panels– II. Fracture Mechanics Investigation”, J. Sand. Struct. Mater., 2005;7: 483-517.
3 - de Moura M.F.S.F., Gonçalves J.P.M., Marques A.T., de Castro P.M.S.T., “Prediction of Compressive Strength of Carbon-Epoxy Laminates Containing Delamination by Using a Mixed-Mode Damage Model”, Comp. Struct., 2000;50:151-157.
4 - Campilho R.D.S.G., de Moura M.F.S.F., Domingues J.J.M.S., Morais J.J.L., “Computational modelling of the residual strength of repaired composite laminates with different geometries using a cohesive damage model”, Accepted for publication in J.
Adhesion Sci. Tech.
5 - Campilho R.D.S.G., de Moura M.F.S.F., Domingues J.J.M.S., “Using a cohesive damage model to predict the tensile behaviour of CFRP single-strap repairs”, Int. J. Sol.
Struct., 2008;45:1497-1512.
6 - Andersson T., Stigh U. “The stress-elongation relation for an adhesive layer loaded in peel using equilibrium of energetic forces”, Int. J. Sol. Struct., 2004;41:413-434. 7 - de Moura M.F.S.F. “Numerical Simulation of the ENF Test for the Mode II Fracture Characterization of Bonded Joints” J. Adhesion Sci. Tech., 2006;20(1):37-52.
8 - de Moura M.F.S.F., Gonçalves J.P.M., Chousal J.A.G., Campilho R.D.S.G., “Cohesive and continuum mixed-mode damage models applied to the simulation of the mechanical behaviour of bonded joints”, Accepted for publication in Int. J. Adh. &
Adhesives.
9 - Shivakumar K.N., Chen H., Bargava A., “Effect of geometric constraint on fracture toughness of PVC foam core sandwich beams”, Sandwich structures 7: Advancing with
Sandwich Structures and Materials, 2006;DOI: 10.1007/1-4020-3848-8-13, 131-142.
10 - Cognard J.Y., Davies, P., Sohier L., Créac’hcadec R., “A study of the non-linear behaviour of adhesively-bonded composite assemblies”, Comp. Struct., 2006;76:34-46. 11 - Campilho R.D.S.G., de Moura M.F.S.F., Domingues J.J.M.S., “Modelling single and double-lap repairs on composite materials”, Comp. Sc. Tech., 2005;65:1948-1958. 12 - Objois A., Assih J., Troalen, J.P., “Theoretical Method to Predict the First Microcracks in a Scarf Joint”, J. Adhesion, 2005;81:893–909.
13 - Campilho R.D.S.G., de Moura M.F.S.F., Domingues J.J.M.S., “Stress and failure analyses of scarf repaired CFRP laminates using a cohesive damage model”, J.
Adhesion Sci. Tech., 2007;21:855–870.
14 - Odi R.A., Friend C.M., “An improved 2D model for bonded composite joints”, Int.