Low-Temperature Thermodynamic Study of the Metastable Empty Clathrate Hydrates Using Molecular Simulations
41
0
0
Texto
(2) Abstract. The thermodynamics of metastable empty sI-clathrate hydrates are probed over broad temperature and pressure ranges, 100 ≤ T (K) ≤ 220 and 1 ≤ p (bar) ≤ 5000, respectively, by large-scale simulations and compared with experimental data at 1 bar. The whole p – V – T surface obtained is fitted by the universal form of the Parsafar and Mason equation of state with an accuracy of 99.7–99.9 %. Framework deformation brought about by the applied temperature follows a parabolic law, and there is a critical temperature above which the isobaric thermal expansion becomes negative, ranging from 194.7 K at 1 bar to 166.2 K at 5000 bar. That response to the applied (p, T) field is analysed in terms of angle and distance descriptors of a classical tetrahedral structure and observed to occur essentially by means of angular alteration for (p, T) > (2000 bar, 200 K). The length of the hydrogen bonds responsible for framework integrity is insensitive to the thermodynamic conditions and its average value is 𝑟̅($%&) = 0.25 nm.. 2.
(3) 1. Introduction As naturally occurring host-guest inclusion compounds, clathrate hydrates can be found1-2 in the Earth permafrost regions, in deep-sea sediments, and in oil and gas pipelines where they act as clogging agents inhibiting the flow of industrially relevant fluids (oil, natural gas); furthermore, commercial interest in clathrate hydrates sparks from their ability to act as natural reservoirs for large volumes of gas, e.g., CO2 injection into deep sea at depths of 3200 m, where hydrostatic pressure can reach 325 bar.3 On the other hand, the amount of CH4 eventually trapped in natural methane clathrate hydrate deposits, essentially in seafloor sediments, is expected to be quite significant (1–5´1015 m3).4 Such inclusion compounds have also been observed in comets5 and outer planets,2 and their occurrence has been suggested, in particular, on Mars, Saturn, Uranus, and Neptune.6 The empty structure of clathrate hydrates is made up of approximately tetrahedrally arranged H2O molecules, linked amongst themselves via strong hydrogen bonds, and giving rise to an icelike crystalline solid exhibiting two or three distinct roughly symmetrical cages where guest molecules can be encapsulated. Structure I7 and structure II8 (sI, sII) both have two cavity sizes, large and small, with an overall unit-cell cubic symmetry, namely 𝑃𝑚30𝑛 (a = b = c ≈ 1.2 nm, sI) and 𝐹𝑑30𝑚 (a = b = c ≈ 1.7 nm, sII), respectively; structure H (sH) has three distinct types of cavities, exhibiting a hexagonal symmetry.9 Whilst sI is the most commonly occurring form under natural environments where CH4 is the principal species for hydrate formation,2 structures sII and sH have been reported to occur when the hydrate-forming gas mixture is composed of larger molecules. The guest size,10-11 and, to some extent, its energetic features, are decisive in determining the hydrate structure, for the guest-host interactions can play a significant role in overall symmetry and thermodynamic stability of the solid framework. The crystal phase can be. 3.
(4) rationalized as a collection of polyhedra, each formed by pentagons and hexagons whose assembly results in the formation of the so-called smaller (dodecahedral) and larger (tetracaidecahedral) cavities: the former (512) composed of 12 pentagons (20 H2O molecules), and the latter (51262) of a mixture of 12 pentagons and 2 hexagons (24 H2O molecules) (Figure 1). For type sI clathrates, the small (Dsmall) cavities are spheroidal in shape and have an average free van der Waals volume of diameter Dsmall = 4.84 Å. The large cavities have two hexagonal faces which are rotated by 60° with respect to each other; the shape of this cage is foreshortened along the polar axis and can best be described as an oblate spheroid with a free van der Waals :69;<. :69;<. volume with semi-major and semi-minor axis diameters of 𝐷56789 = 6.12 Å and 𝐷5=>89 5.07 Å, respectively. In the sII hydrates, the shape and size of the small 512 cages are somewhat distorted compared to the ideal dodecahedral shape giving the cage an ellipsoidal shape with a free van der @56:: Waals volume with semi-major and semi-minor axis diameters of 𝐷56789 = 4.79 Å and @56:: 𝐷5=>89 4.38 Å, respectively. The large 51264 cages in the sII hydrate are spheroidal with a free. van der Waals diameter of Dlarge = 6.29 Å.12. 4.
(5) Figure 1. Pictorial representation of small (512) and large (51262) cavities of a sI clathrate hydrate, containing 20 and 24 H2O molecules, respectively. The free van der Waals radii are shown on each cage. Two views of the corresponding sI unit cell are also given, showing the relationship of the cages in the unit cell. Only the oxygen atoms in the polyhedral vertices are included. Note that the cavities obey Euler's convex polyhedra theorem: Face + Vertices = Edges + 2. The figures were prepared with the VESTA molecular visualization program.13. The statistical thermodynamics theory of clathrates and their equilibrium with a fluid phase was pioneered by van der Waals and Platteeuw,11 for both water and hydroquinone clathrates. Core to the theoretical framework developed is the notion that the criterion for (solid/fluid). 5.
(6) equilibrium corresponds to the equality between chemical potentials of the hypothetical empty clathrate (𝑄B ), filled clathrate (𝑄) and an arbitrary gaseous species (𝐴), according to an equilibrium formalism of 𝑄B + 𝐴(𝑔) ⇆ 𝑄. The corresponding canonical partition function was built according to four major assumptions, the first of them being that the contribution of the framework H2O molecules to the free-energy is independent of the particular mode of cavity occupation, that is, independent of the solute (and, hence, its degree of occupancy). Obviously, molecules whose interaction can severely distort the lattice, such as hydrogen bonding guests, are excluded from the theory range of applications. More recently, Lasich14 coupled a mean-field lattice gas approach with the original statistical mechanics theory of van der Waals and Platteeuw and developed a framework to determine (single) cavity occupancy, considering that the cavity is perfectly spherical symmetric; the set of analytical equations thus developed has only two properties as input parameters, namely the potential energy minimum and a hard-sphere radius for the H2O-gas interaction. A thorough discussion on the advances and improvements of the original van der Waals-Platteeuw theory of clathrate hydrates thermodynamics is beyond the scope of this work and can be found in the literature.1, 6 Empty clathrate hydrates are thermodynamically unstable (guest molecules are of paramount importance to stabilize these structures) with respect to ice, and as such their study using experimental techniques is greatly limited to very specific formation conditions;1,. 15. however,. their mechanical stability renders theoretical16 and computer simulation methods the ideal choice to address their thermodynamical properties.17-21 Starting from very cold samples (110–145 K), Falenty et al.15 degassed Ne-sII clathrates for several hours using vacuum pumping to obtain a so-called ice XVI, whilst employing neutron diffraction to observe that: i) the empty sII hydrate structure decomposes at T ≥ 145K and, furthermore, ii) the empty hydrate shows a negative. 6.
(7) thermal expansion at T < 55 K, and it is mechanically more stable and has a larger lattice constant at low temperatures than the Ne-filled analogue. The existence of such a porous ice had been theoretically predicted before.22 From a theoretical perspective, empty hydrates can been probed using Molecular Dynamics or Monte Carlo techniques.23-25 Conde et al. used empty hydrates and a fully atomistic description of the solid lattice to estimate the phase diagram of H2O at negative pressures and T ≤ 300 K,20 and obtain the differences in chemical potentials between ice Ih and the empty hydrates, central to the van der Waals–Platteeuw theory. Jacobson et al. performed17 simulations using a monoatomic (coarse-grained) model developed for H2O that is capable of capturing the tetrahedral symmetry of hydrates. Their calculations revealed that, under 1 atm pressure, sI and sII empty hydrates are metastable regarding the ice phases up to their melting temperatures, T = 245 ± 2 K and T = 252 ± 2 K, respectively. Matsui et al. employed19 molecular dynamics to perform a thorough and systematic study of several ice polymorphs, namely space fullerene ices, zeolitic ices, and aeroices, and interpreted their relative stability in terms of geometrical considerations. Kosyakov and Polyanskaya performed calculations using the Zimmerman-Pimentel potential to establish a series of relative stability regarding 8 different H2O solid networks, including sI and sII clathrate hydrates of H2S, C2H4O and C4H8O. 26 The present work explores the p – V – T thermodynamic phase space of empty clathrate hydrates that, as far as we are aware, has been unaddressed before. Using classical molecular dynamics and employing a fully atomistic H2O model, a thermodynamic analysis is performed well below the freezing point of water (100 ≤ T (K) ≤ 220) and up to very high pressures (1 ≤ p (bar) ≤ 5000), a domain which is of particular relevance for astrophysical environments. The remainder of this paper is organised as follows: Section 2 introduces the simulation details and. 7.
(8) theoretical methodology employed, proceeding with a discussion of the main results obtained (Section 3), in terms of a thermodynamical and structural analysis of data, and concludes with a summary of the main conclusions attained (Section 4). 2. Theoretical Methodology and Simulation Details Under natural environments and when CH4 is the driving force for clathrate formation, the sI structure is the dominant polymorph; therefore, we adopt that structure to represent a prototypical empty clathrate crystal. A 3 ´ 3 ´ 3 replica of the sI cubic unit cell containing 1242 H2O molecules was built, starting from the coordinates of the oxygen atoms as determined by Xray crystallography by McMullan and Jeffrey;7 the proton atoms were assigned positions consistent with the Bernal-Fowler ice rules.27 The rigid TIP4P-Ice four-charge potential28 is employed to describe the water lattice of the empty clathrate phase. This potential was developed to reproduce the experimental melting point of ice Ih (272.2 K at 1 bar), and has been successfully employed to study the deformation,29 energetics and decomposition,30-31 and phase behaviour32-34 of several clathrate hydrates. Using a water potential (TIP4P/2005)35 from the same family as used in this work, Conde et al. verified36 that quantum effects start to become relevant only for extremely low temperatures (T < 150 K), and even then they observed only minor discrepancies in the empty hydrates density and energy when quantum effects were taken into account, namely: i) densities of the classical simulations were ~ 0.03 g/cm3 higher than their quantum counterparts, and ii) the average potential energies for the water molecules of the quantum simulations were ~ 1.5 kcal/mol higher than the ones from classical simulations.. 8.
(9) In the present work, dispersive interactions are calculated using the Lennard-Jones (12,6) potential, and electrostatics determined by Coulomb’s law (assuming the atomic point charge L LN. representation) to obtain the total potential energy, 𝑈H𝑟=7 I = ∑7 ∑= KOPQM W. R 9MN. WMN. YZ. + 4𝜀=7 UV 9 X MN. −. \. V 9 MNX ]^, where 𝑞= (𝑞7 ) is the electric charge in atom i (j), 𝑟=7 is the distance between atoms i and MN. j, si is the collision diameter, and 𝜀= is the potential well-depth. Cross parameters between unlike particles are obtained using the classical Lorentz-Berthelot combining rules:23,37 𝜎=7 = H𝜎= + 𝜎7 I⁄2 and 𝜀=7 = b𝜀= 𝜀7 . Molecular dynamics simulations are performed in the isothermal-isobaric ensemble (NpT) using the Gromacs 4.6.7 set of routines38 and the Verlet scheme to integrate Newton’s equations of motion with a 1 fs timestep. In order to enforce constant temperature and pressure upon the empty clathrates, we used a Nosé-Hoover thermostat39-40 with a relaxation constant of f = 0.2 ps and an isotropic Berendsen barostat41 with a relaxation constant of f = 0.5 ps. A potential cut-off of 1.1 nm was employed for both the van der Waals and short-range contributions to the Coulombic interactions, and the long-range electrostatics were calculated using the particle-mesh Ewald method42-43 with cubic interpolation and a maximum Fourier grid spacing of 0.12 nm. Three-dimensional periodic boundary conditions were imposed throughout the numerical experiments. Starting from an initial configuration at the lowest temperature and pressure (100 K, 1 bar), clathrates were isothermally pressurised to achieve the desired pressure (1 bar ® 100 bar ® 500 bar ® 1000 bar ® 2000 bar ® 5000 bar), and the protocol repeated for the next higher temperature (100 K ® 120 K ® 140 K ® 160 K ® 180 K ® 200 K ® 220 K) starting from the corresponding previous equal pressure run. Large time-scale calculations were run for 50 ns in order to obtain each p – V – T state point, where the first 5 ns were discarded to account. 9.
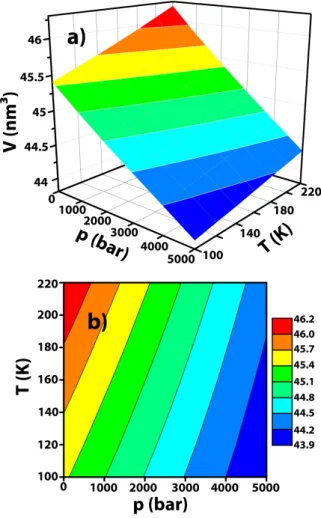
(10) for equilibration from the previous pressure/temperature run, and only the last 45 ns considered for data production. Because data collection took place every 5 ps, every p – V – T state point was obtained from time-averaging an ensemble of 9000 data points. 3. Results and Discussion Thermodynamical Analysis. The complete p – V – T phase space obtained is shown in Figure 2 (100 ≤ T (K) ≤ 220, 1 ≤ p (bar) ≤ 5000), clearly evidencing a monotonical behaviour associated with the solid compression and/or heating up, whose individual pressure and/or temperature response can be satisfactorily described by simple linear relations; we will revisit this issue further ahead by taking an in-depth look at an universal equation of state capable of capturing the whole p – V – T domain in a single mathematical expression.. 10.
(11) Figure 2. a) Thermodynamical p – V – T surface of the empty sI clathrates, 100 ≤ T (K) ≤ 220 K and 1 ≤ p (bar) ≤ 5000. b) 2D projection onto the p – T plane. Colour scale corresponds to the 3 ´ 3 ´ 3 crystal volume measured in nm3.. As a simple test of the TIP4P-Ice force field employed, a direct validation of density data against previous results can be performed, considering that the “experimental” density of the empty gas hydrate can be estimated using equation 1:. 𝜌<de = H𝑛fg h 𝑀I⁄(𝑁kl 𝑉n ). (1). 11.
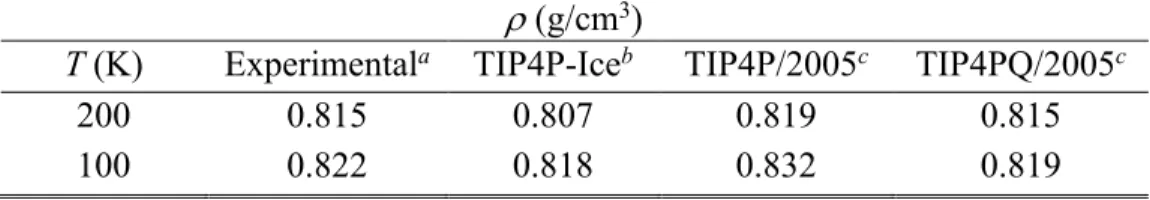
(12) where 𝑛fg h is the number of water molecules per hydrate unit cell, M is the molecular weight, NAV is Avogadro’s constant, 𝑉n = 𝑎p is the unit cell volume and a is the unit cell length. Using experimental data from the literature, a = 1.1875 nm (T = 100 K)44 and a = 1.191 nm (T = 200 K)44-47, Table 1 records the atmospheric pressure densities corresponding to two limiting temperatures; for comparison purposes, data obtained for two other H2O potentials from the same family as ours are also given.36 It is evident that the TIP4P/2005 model always overestimates the experimental density of the empty sI structure, whilst both the TIP4P-Ice and the TIP4PQ/2005 agree with the experimental results within a (± 0.003 – 0.008) g/cm3 confidence interval; although TIP4PQ/2005 (optimized for quantum effects) performs very slightly better than TIP4P-Ice (used in the present work). The recent calculations21 by Costandy et al. using the TIP4PQ/2005 force field, showed a density range of 0.83 ≤ r (g/cm3) ≤ 0.84 for empty sI clathrates within a temperature window of 100 – 130 K, that is, a density 2.5% above the results36 obtained by Conde et al. using the same force field, and ~ 2.7 % above our own results obtained with the TIP4P-Ice model. This small discrepancy in density of different H2O models can be attributed to different cut-off values used to calculate the potential energy of the systems.21 The complete set of r – T data obtained in the simulations is recorded in Supplementary Information Figure SI1.. Table 1. Experimental and calculated densities (r) at 1 bar, using different H2O models.. r (g/cm3) T (K) 200 100. Experimental 0.815 0.822. a. TIP4P-Iceb 0.807 0.818. TIP4P/2005c 0.819 0.832. TIP4PQ/2005c 0.815 0.819. 12.
(13) a. Obtained from experimental unit cell data from the literature44-47 and employing 𝜌<de = H𝑛fg h 𝑀I⁄(𝑁kl 𝑉n ) (see text for details). bThis work. cData from reference.36. The potential energy of the solid, U, increases linearly with temperature and shows little pressure dependence within the observed domain (1 – 5000 bar). The fact that the isobars 𝑈 = 𝑓(𝑇) are essentially independent of pressure indicates that the empty sI structure is energetically stable with respect to applied pressure; graphic plots of (energy vs T) can be found in Supporting Information Figure SI2. The isobaric heat capacity, one of the most relevant energetical properties associated with a solid, can be obtained from simulation data23 via the relation 𝐶e = (𝜕𝑈⁄𝜕𝑇)e , and the results thus obtained are recorded in Table 2, showing that heat capacity slightly decreases with applied pressure. This can be rationalised considering that the kinetic motion of the H2O molecules, e.g. the response to temperature and therefore kinetic energy, becomes inhibited by a decrease of available free-volume brought about by the applied pressure.. Table 2. Isobaric heat capacity, Cp.a P (bar) 1 100 500 1000 2000 –1 –1 Cp (kJ·mol ·K ) 35.95 ± 0.34 35.84 ± 0.29 35.78 ± 0.42 35.54 ± 0.31 35.15 ± 0.29 a Cp values obtained from linear interpolations of data, 𝑈 = 𝑐𝑜𝑛𝑠𝑡. +𝐶e ∙ 𝑇, with R2 > 0.999.. 5000 33.95 ± 0.14. There are no experimental data in the literature for Cp of empty hydrates, and, for that reason, we compare our results with previous atmospheric pressure (p = 1 bar) work36 employing the classical TIP4P/2005 H2O model. It was found that enthalpy, H, could be satisfactorily correlated with temperature according to a second-order polynomial expression, 𝐻 = ℎ + ℎY 𝑇 + ℎZ 𝑇 Z , which by differentiation with respect to temperature yielded the constant pressure heat. 13.
(14) capacity as 𝐶e = (𝜕𝐻 ⁄𝜕𝑇)e = ℎY + 2ℎZ 𝑇. Using the previous analysis in the range 0 – 250 K, Conde and Sesé obtained36 Cp ≈ 43 kJ×mol–1K–1 (100 K) and Cp ≈ 54 kJ×mol–1K–1 (200 K), which are larger than the experimental heat capacities obtained for ice Ih (1 bar) reported by Feistel and Wagner48 of Cp ≈ 16.20 kJ×mol–1K–1 (100 K) and Cp ≈ 28.62 kJ×mol–1K–1 (200 K). The thermodynamic analysis of Handa and Tse revealed that, under atmospheric pressure conditions and within the range 100 K – 270 K, the heat capacities of empty sI and sII structures were essentially similar to ice.49 Our own results recorded in Table 2, obtained under isobaric conditions, indicate that the heat capacity has only a small pressure dependence, exhibiting a decrease of ~ 5.6 % from the lowest (1 bar) up to the highest (5000 bar) pressure studied. The isochoric simulations of Tribello and Slater,18 conducted at 0 bar using the TIP4P/2005 potential, revealed that the constant volume heat capacity for sI and sII hydrates, 𝐶l = (𝜕𝑈⁄𝜕𝑇)l , is largely independent of temperature within a 0 – 230 K window, in disagreement with the findings of Conde and Sesé that obtained a ~ 25.6 % increase in Cp when temperature is raised from 100 K to 200 K. Using fluctuations in the potential energy to obtain CV, Tribello and Slater estimated18 a 1.5 kB contribution per molecule for the heat capacity. Lattice Constant and Isobaric Thermal Expansivity. Of regular cubic symmetry, the sI lattice is characterized by the relation 𝑉 = 𝑎p , where V is the unit cell volume and a is the unit cell lattice constant. Volumetric data in Figure 2a were normalized to obtain unit cell properties, and the corresponding lattice constants are graphically presented in Figure 3a for several pressures. Considering the lowest pressure run (1 bar), it can be observed that the lattice constant increases by 0.6 % when temperature changes from 100 K to 220 K; that increase changes to 0.5 % for the 2000 bar run, and finally decreases to 0.3 % when pressure reaches 5000 bar. These observations agree with a 1 % increase over a broader temperature range (5 – 223 K) as measured by X-ray. 14.
(15) diffraction using a single crystal sI CO2 clathrate,3 and also substantiate the preservation of the sI structure throughout the entire pressure and temperature ranges addressed in the present work. The flattening out effect observed in the a curves as temperature decreases, was previously observed21 for CH4 and CO2 sI hydrates, and related to the existence of quantum effects particularly relevant for ultra-low temperatures (T < 100 – 120 K).. 15.
(16) Figure 3. a) Unit cell length, a, isobaric profiles obtained from the simulations (symbols) and cubic correlation polynomials according to 𝑎 = 𝑎‡ + 𝑎Y 𝑇 + 𝑎Z 𝑇 Z + 𝑎p 𝑇 p (lines). b) Isobaric thermal expansivity 𝛼e = (𝜕𝑎⁄𝑎‡ ∙ 𝜕𝑇)e (solid lines), and corresponding maxima (symbols). c) Atmospheric pressure data comparison with previous experimental results obtained for guestfilled hydrates according to: black) empty sII Ne structure,15 dark blue) sII Ne structure,15 black line and spheres) simulation results for empty sI, green) sI Xe structure,50 red) sI CO2 structure,51 light blue) sI CH4 structure,52 grey) sI CH4 structure,47 purple) sI CO2 structure,53 and dark blue) sI CH4 structure.16 Symbols correspond to experimentally measured data points and lines were obtained from polynomial correlations proposed in the present work (𝑎 = 𝑎‡ + 𝑎Y 𝑇 + 𝑎Z 𝑇 Z + 𝑎p 𝑇 p + 𝑎O 𝑇 O ).. As far as we are aware, the only experimental determination of an empty clathrate lattice cell length in the literature is the work by Falenty and Kuhs, who degassed a Ne clathrate to obtain an empty metastable type sII structure,15 having studied the latter using neutron diffraction at temperatures T ≤ 140 K. For the sake of comparison, we plot the corresponding 𝑎 = 𝑓(𝑇) curve for the empty sI clathrate hydrate in Figure 3c, together with other experimental data obtained for sI clathrates whose guest molecules are CH4, CO2 or Xe.16, 47, 50-53 It is interesting to observe that the empty sI clathrate unit cell is marginally larger than the corresponding solid whose cages are occupied with guest molecules, in agreement with the observations for the Ne sII framework degassed of its gas. The reason for this behaviour is that occupied cages can be stabilized by their guests and a strong guest-host interaction may lead to a contraction of the overall cage volume with respect to the empty analogue. At atmospheric pressure (1 bar) the empty sI framework exhibits an overall ~ 0.20 – 0.36 % increase of its unit cell length as compared to equivalent. 16.
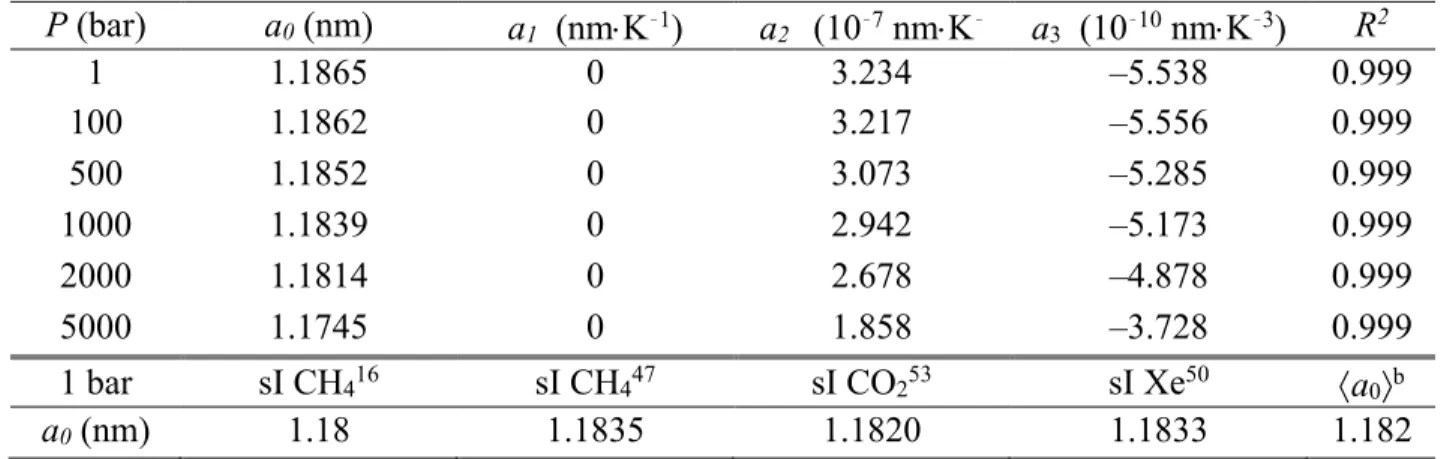
(17) hydrates whose cavities are occupied. The CH4 hydrate studied by Shpakov et al. using lattice dynamics16 seems to behave spuriously and underestimates the lattice constant when compared with similar experimental measurements. To establish a generalized isobaric behaviour, we found it satisfactory to describe the functional dependence of the unit cell length with temperature using a third-order polynomial (eqn. 2), and results thus obtained are recorded in Table 3, noting that a0 obviously corresponds to the zerotemperature property. Also given in Table 3 are the experimental a0 coefficients previously determined, using a similar functional dependence for 𝑎 = 𝑓(𝑇) (eqn. 2). Although not explicitly indicated, the Ne degassed sII framework data was fitted to a fourth-order polynomial15 and exhibits a0 = 1.7125 nm, clearly outside the range observed for sI structures.. 𝑎 = 𝑎‡ + 𝑎Y 𝑇 + 𝑎Z 𝑇 Z + 𝑎p 𝑇 p. (2). Table 3. Unit cell length of the empty sI clathrate, a, expressed in terms of a cubic polynomial (eqn. 2)a and previous experimental data for a0 obtained from sI frameworks containing CH4, CO2 or Xe. P (bar) 1 100 500 1000 2000 5000. a0 (nm) 1.1865 1.1862 1.1852 1.1839 1.1814 1.1745. a1 (nm×K–1) 0 0 0 0 0 0. a2 (10–7 nm×K– 2 ) 3.234 3.217 3.073 2.942 2.678 1.858. a3 (10–10 nm×K–3) –5.538 –5.556 –5.285 –5.173 –4.878 –3.728. R2 0.999 0.999 0.999 0.999 0.999 0.999. 1 bar sI CH416 sI CH447 sI CO253 sI Xe50 áa0ñb a0 (nm) 1.18 1.1835 1.1820 1.1833 1.182 a The coefficient a1 is set to 0 in order to address the fact the isobaric thermal expansivity needs to be 0, (1/𝑎‡ ) ∙ (𝜕𝑎 ⁄𝜕𝑇)e = 0, when temperature is 0 K. bArithmetic average obtained for the. 17.
(18) a0 coefficient, considering the four experimental measurements. R2 is the correlation coefficient obtained for each numerical fitting.. Ikeda et al. claimed that the host lattice structure of their Xe clathrate could be a very close representation of the corresponding empty hydrate, particularly because of the nearly spherical shape of the Xe molecule.50 Their claim is also consistent with weak energetic interactions between noble gases and the hydrates H2O framework, either in type sI (Xe) or type sII (Kr); therefore clathrate hydrates whose guest molecules are noble gases can be regarded as the closest to a thermodynamically “stable” equivalent of an empty hydrate. That the unit cell length’s response to temperature depends on applied pressure is clear from Figure 3a and data recorded in Table 2. An in-depth look at this phenomenon can be obtained by calculating the isobaric thermal expansivity, 𝛼e = (𝜕𝑎⁄𝑎 ∙ 𝜕𝑇)e of the empty hydrate phase where a corresponds to the atmospheric unit cell length. Differentiating equation 2 with respect to temperature one obtains the functional form for ap according to:. 𝛼e =. 6‹ ŒZ6g •Œp6Ž • g 6. (3). Figure 3b shows the parabolic curves obtained from equation 3. Extrapolated to T ® 0 obviously H𝛼e = 0I ••‡ since a1 = 0 by choice. The isobaric thermal expansion of the empty lattice decreases greatly as pressure approaches 5000 bar. At such high pressures, the clathrate framework becomes severely compressed and there is little room left to accommodate elastic deformation, thus, when exposed to a thermal stimulus the solid becomes less prone to expansion/contraction. The isobaric profiles in Figure 3b also indicate that the empty lattice. 18.
(19) thermal expansivity increases up to a certain temperature threshold, beyond which the former starts to decrease (negative thermal expansion). The maxima in the 𝛼e curves can be obtained by taking the second derivative of the unit cell length with respect to temperature, (1/𝑎) ∙ (𝜕 Z 𝑎⁄𝜕𝑇 Z )e = 0. Solving the resulting equation in order to T, gives the maximum limiting temperature, Tmax, above which 𝛼e decreases. Solving for each individual pressure profile, it is easy to obtain the maxima as (p/bar; Tmax/K) = (1; 194.7), (100; 193.0), (500; 193.8), (1000; 189.6), (2000; 183.0) and (5000; 166.2), that is, Tmax starts decreasing as hydrostatic pressure upon the solid increases. The complete set of 𝛼e maxima is recorded in Table SI1 of Supporting Information. In the range 1 – 500 bar Tmax decreases marginally, and then, after surpassing 500 bar, its decrease is more and more pronounced (Figure 3b). Using Ne-emptied sII clathrates at atmospheric pressure, Falenty et al. observed15 a negative thermal expansion, in their case located at T < 55 K, characteristic of open tetrahedrally-bonded framework structures formed by H2O, SiO2, Si and Ge.54-55 The negative thermal expansion was interpreted in terms of a shortening of the bond distances at low temperature, induced by low-energy framework phonons, just before the anharmonicity arising from the remaining higher-energy lattice modes leads to a normal thermal expansion as observed for ice Ih. Universal Equation of State (EoS). Parsafar and Mason proposed56 a isothermal equation of state (PM-EoS) by improving on the work of Vinet et al.,57 who had earlier derived a universal three-parameter equation of state to address distinct classes of solids under compression (ionic, metallic, rare gas, covalent, etc.). Considering that for highly compressed solids the repulsive part of the binding energy curve is predominant, a simple three-parameter equation (eqn. 4) was deduced56 to interpret p – V data:. 19.
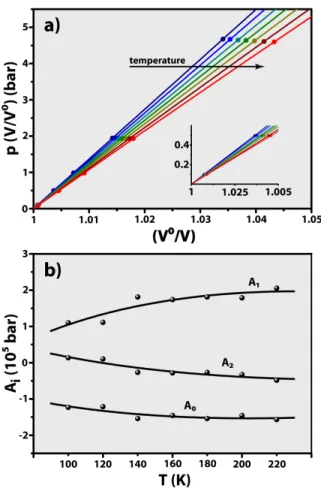
(20) l. l. l. 𝑝 ‘l ’ = 𝐴‡ + 𝐴Y ‘ lR’ + 𝐴Z ‘ lR ’ R. Z. (4). where V0 is the atmospheric pressure molar volume, and the Ai coefficients are simple functions of temperature, the three parameters of the original equation developed by Vinet et al.,57 for each individual temperature. Note that eqn. (4) leads to the correct asymptotic limit, predicting V = 0 at infinite pressure. The PM-EoS robustness has been put to the test using compressed ionic solids58-60 and molten salts61 at temperatures up to 3000 K and pressures p < 75 ´ 103 bar, always achieving precisions better than 0.07 % – 1 %, however, its accuracy has not been addressed for temperatures below the water freezing point. The PM-EoS is employed herein to correlate p – V data obtained in the calculations, and the corresponding isotherms are plotted in Figure 4a. Note that the parabolic form of eqn. 4 becomes more apparent with temperature as the A2 parameters increase in magnitude at higher temperatures. The Ai coefficients obtained by linear regression are indicated in Table 4.. 20.
(21) Figure 4. a) Correlation plots of p – V data (symbols) using the Parsafar and Mason equation of state (lines): blue) 100 K, light blue) 120 K, dark green) 140 K, green) 160 K, light green) 180 K, dark red) 200 K and light red) 220 K. b) Temperature dependence of the Ai coefficients obtained from the calculations (symbols) and using a scaling law according to 𝐴= = 𝑎= + 𝑏= 𝑇 − 𝑐= 𝑇𝑙𝑛𝑇 (lines).. Table 4. Isothermal coefficients Ai of the Parsafar and Mason EoS.a T (K) 100 120. A0 (105 bar) –1.233 –1.213. A1 (105 bar×K–1) 1.099 1.111. A2 (104 bar×K–2) 1.339 1.018. R2 0.999 0.999. 21.
(22) 140 160 180 200 220. –1.543 –1.534 –1.456 –1.456 –1.568. 1.810 1.843 1.738 1.786 2.053. –2.673 –3.094 –2.824 –3.306 –4.854. 0.999 0.999 0.999 0.999 0.999. a 2. R is the correlation coefficient obtained for each numerical fitting.. Considering the whole set of p – V – T results, the accuracy of the PM-EoS to describe the empty clathrate phase space is always better than 99.7 % – 99.9 %, regarding the molar volume of any particular (p, T) point. It should be noted that the condition A0 + A1 + A2 » 1 (imposed by p = 1 bar when V = V0) is a natural outcome of the fitting procedure. The Ai coefficients obtained in the high-pressure studies (Table 4) are functions of temperature, and, to allow comparison with the functionality derived by Parsafar and Mason we have performed linear regressions employing eqn. 5 (Figure 4b), and for each individual Ai determined a set of three values corresponding to ai, bi, and ci (Table 5). The Ai’s are reasonably well described using Eq. (5), although less so in the case of A1 at low temperatures (T £ 140 K).. 𝐴= = 𝑎= + 𝑏= 𝑇 − 𝑐= 𝑇𝑙𝑛𝑇, 𝑖 = 0,1,2. (5). Table 5. Universal coefficients of the Parsafar and Mason EoS.. A0 A1 A2. ai (104 bar) 5.269 –25.298 20.034. bi (103 bar K–1) –6.374 12.541 –6.168. ci (103 bar×K–1) –1.008 1.946 –0.938. 22.
(23) Tetrahedral Structure. The main geometric feature associated with water ices and clathrate hydrates is the local near tetrahedral symmetry of the lattice. Owing to the relative orientations of the O – H bonds and the lone pairs of electrons, the four nearest neighbours of each H2O molecule closely approximate to four vertices in a tetrahedron. Both in ice and in hydrate crystals the cosine of the angle formed by a H2O molecule with pairs of its neighbours is very close to – 0.33, although in the hydrates hexagonal faces the ideal O – O – O angle is 120º. Several tests can be conducted to probe tetrahedrality, and, in the case of molecular simulations, such tests rely heavily on collective order parameters.62-66 In fact, using such an approach to study the growth of CH4 hydrates, Tung et al. were able to pinpoint the exact location of the interfacial region separating bulk H2O from the recently formed crystal phase.65 Here we adopt the formulation by Chau and Hardwick, constructed in terms of independent angular and distance descriptors of perfect tetrahedra.63 The angular part, Sg, is built as the normalized sum of the squares of the differences between the cosines of the inter-bond angles and the cosine of what the angles would be if all the hydrogen bonds to the four nearest neighbours were tetrahedrally arranged. In a perfect tetrahedron, all the bonds and angles are the same, and thus the cosine of this angle is –1/3, therefore, Sg is defined as:. p. Y Z. 𝑆; = pZ ∑p=%Y ∑O7%=ŒY ‘𝑐𝑜𝑠Θ=,7 + p’. (6). where Θ=,7 is the angle at the central atom (of the tetrahedron) between the ith and jth bonds. The squaring ensures the contribution from each inter-bond angle is always greater than or equal to zero and the factor of 3/32 normalizes Sg to the range 0 ≤ Sg ≤ 1. By definition, Sg is the sum of the contributions from the six angles, and thus, is zero if and only if the cosines of the angles are. 23.
(24) –1/3, e.g. the bonds are all arranged in a perfectly tetrahedral fashion. Furthermore, Sg ® 1 for a severe non-tetrahedral arrangement where all the bonds are superimposed on each other. According to equation 6, the average value of <Sg> in the case of randomly arranged bonds, exhibiting uncorrelated uniform angular distributions, is 1/4.63 The distance descriptor, Sk, is defined as:. Y. 𝑆™ = p ∑O™•Y. (9š %9̅ )g. (7). O9̅ g. where rk is the distance from the (tetrahedron) central atom to the kth peripheral atom, 𝑟̅ is the arithmetic mean of the four radial distances, and 1/3 is a normalization factor. The physical meaning of Sk is just a measure of the variance of the radial distances from the central atom to the peripheral atoms. Obviously, Sk = 0 for a perfect tetrahedron, and, as configuration departs from tetrahedrality, Sk ® 1. Data collected from the simulations were used to determine the temperature and pressure dependences of both Sg and Sk, by histogram averaging over time for each particular (p, T) point in order to obtain probability distributions for the angular and distance parts of the S order œ •žŸ. M parameter. The probability distributions are normalized according to ∫œ •M 𝑝(𝑆= ) 𝑑𝑆= = 1, where M. i = g (angular, eqn. 6) or s (distance, eqn.7). The angular distributions (Figure 5) reveal that not only the empty clathrate lattice responds to an increase of temperature, from 100 K up to 220 K, by distorting its angular distributions, but also that distortion appears to be monotonic in nature. By increasing temperature, molecules acquire a progressive amount of kinetic energy that can be propagated throughout the lattice leading to enhanced vibrations of the O – H bonds and, therefore, to the formation of distorted tetrahedral units. The Sg histograms are satisfactorily. 24.
(25) described by Gaussian statistics in the whole p – T domain, however, there seems to be a threshold of ca. 200 K (dark red) above which the peaks exhibit a left-hand side tail towards lower values of Sg, suggesting that thermal expansion no longer follows a monotonical behaviour. This could indicate the onset of non-harmonic effects that would ultimately result in the collapse of the empty hydrate lattice. However, a visual inspection of the crystal after 50 ns at 5000 bar and 220 K (Figure SI3) reveals that the solid lattice maintains its structural integrity (Figure SI3). Gaussian distributions were employed to fit histogram data and the corresponding maxima are indicated in Figure 5 for three indicative temperatures. It now becomes evident that by imposing isothermal conditions whilst increasing pressure, Sg maxima are shifted towards higher values, as a result of the solid contraction and gradual loss of tetrahedral order. In a similar fashion as mentioned for temperatures above 200 K, pressure at the onset of p > 2000 bar also shows strongly increasing Sg as the characteristic tetrahedral structure starts to become distorted. The conjugation of simultaneous responses to two external fields, temperature and pressure, is particularly evident for the 200 – 220 K distributions obtained at 5000 bar, showing that both peaks deviate significantly from the Gaussian-like curves observed for all the other data. In fact, distributions in Figure 5 indicate that for (p ,T) > (2000 bar, 200 K) distortion of the solid occurs most significantly through angular alteration, for the variance of the radial distances between the central tetrahedron atom and the peripheral ones, e.g. Sk, decreases, opposite to the observed behaviour associated with Sg.. 25.
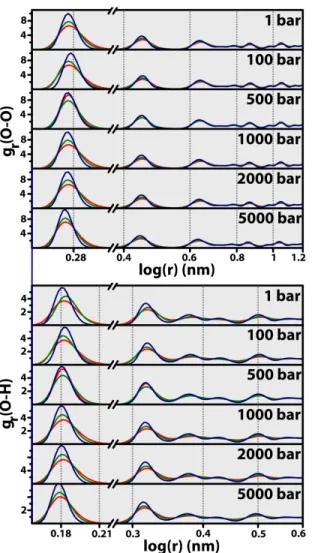
(26) Figure 5. Tetrahedral angular, Sg (top), and distance, Sk (bottom), order parameters obtained from histogram weighting of simulation data of the empty clathrate hydrates, using a bin width of 100 points: dark blue) 100 K, light blue) 120 K, dark green) 140 K, green) 160 K, light green) 180 K, dark red) 200 K and light red) 220 K. Lines correspond to Gaussian statistics.. Using the SPC/E water model for the empty ice Ih lattice at 1 bar and 200 K, the tetrahedral contributions of the angular and distance parts have been determined63 as 𝑆; = 0.0117 ± 1.53´10%O and Sk = 3.75 ´ 10–4 ± 4.46 ´ 10–6, respectively, slightly larger than our own observed values of Sg = 0.0118 and Sk = 3.30 ´ 10–4 for an empty sI hydrate. Baez and. 26.
(27) Clancy proposed62 a tetrahedral angular parameter similar in form to eqn. 6, and performed molecular dynamics simulations with the same SPC/E potential; their calculations at 40 bar and 270 K revealed that Sg is slightly smaller for a CH4 sI hydrate compared to the analogue ice Ih structure, in agreement with our own observation.. Radial Distribution Functions. The local structure associated with the solid lattice can also be probed by calculating a radial distribution function according to eqn. 8, where V is the volume of the system, Vr is the volume of a spherical shell at distance r from each particle i, Ni is the number of particles i in the system, rij is the distance between particles i and j and the triangular brackets denote an ensemble average over the entire simulation time window.37, 67. l. 𝑔9 (𝑟) = l ¤ ¤ ⟨∑= ∑7§= 𝛿H𝑟 − 𝑟=7 I⟩ £ M N. (8). This procedure was performed for two distinct rij, namely the distance between nearest neighbours O atoms and the distance between O and H atoms, using a cut-off of 1.4 nm. In order to render the analysis clearer, results thus obtained are recorded in Figure 6 for three representative temperatures, namely 100 K, 160 K and 220K. Overall, both the gr(O – O) and gr(O – H) curves exhibit two maximum intensity peaks, corresponding to the thickness of the first and second order neighbour shells, centered at r(O – O) » (0.27, 0.45) nm and r(O – H) = (0.18, 0.32) nm, and revealing that the hydrogen bonds throughout the network are of similar length regardless of the particular (p, T) conditions; this is in agreement with the Monte Carlo calculations of Conde et al., performed at 100 K and 1 bar for an empty sI framework described by the TIP4PQ/2005 force field.36 The recent neutron diffraction analysis15 of an empty sII. 27.
(28) hydrate yielded a mean time-space averaged hydrogen bond distance of 0.275 nm, which compares quantitatively with our own average value of 𝑟̅(h%f) = 0.25 nm. A pressure increase exerts minor influence upon the inter-atomic distances, the most noticeable of which occurs at 5000 bar. At that pressure, both the first and second peaks of the gr(O – O) curves are very slightly shifted towards lower values of r, but not the gr(O – H) equivalents: under high pressure conditions, the solid deforms accordingly by primarily decreasing the distance between O atoms in the first and second shell and not the individual hydrogen bond lengths. This corroborates the findings obtained with the Sk order parameter analysis that evidences a reduction in the variance of radial distances between the tetrahedron central atom and the peripheral ones (cf. Tetrahedral Structure).. 28.
(29) Figure 6. Isobaric radial distribution functions, gr(O – O)and gr(O – H): dark blue) 100 K, green) 160 K and light red) 220 K.. Results obtained for the complete rij range, 0 – 1.4 nm, are recorded in Figure 7 considering three representative pressures, 1 bar, 2000 bar and 5000 bar. Under isobaric conditions, a temperature increase induces a slight broadening effect upon the first two gr maxima: considering that the first two peaks of the gr curves (either O – O or O – H) correspond to the first and second neighbour shells around the O atoms, then we can observe that as temperature increases, and regardless of pressure, the second shell seems to be the most affected one, as. 29.
(30) clearly evidenced by a flattening out effect as temperature increases from 100 K up to 220 K. This is particularly evident for the O – H neighbourhood, as shown by the inset gr(O – H) curves in Figure 7; beyond r = 0.8 – 1 nm, there is a progressive annihilation of long-range order and the classical asymptotic limit of gr ® 1 is attained. The molecular simulations of Alavi and Ohmura,30 employing the same H2O potential as ours (TIP4P-Ice) to probe sI and sII empty hydrates at 272.2 K and 1 bar, revealed very similar gr profiles to the ones recorded in Figure 7, including the first two neighbour shells positioned at r(O – O) » (0.27, 0.45) nm and r(O – H) » (0.18, 0.32).. 30.
(31) Figure 7. Isothermal radial distribution functions, gr(O – O) and gr(O – H): dark blue) 100 K, light blue) 120 K, dark green) 140 K, green) 160 K, light green) 180 K, dark red) 200 K and light red) 220 K.. 4. Conclusions A critical comparison with previous experimental data obtained under atmospheric pressure revealed that empty sI structures exhibit a slightly larger unit cell length (0.20 – 0.36 %) than their corresponding analogues filled with guest molecules (CH4, CO2, Xe); this behaviour is consistent with previous observations using empty sII frameworks. Densities obtained by employing the TIP4P-Ice potential for H2O, r = 0.818 g/cm3 (100 K) and r = 0.807 g/cm3 (200 K), agree numerically with volumetric data obtained from the literature at p = 1 bar, r = 0.822 g/cm3 (100 K) and r = 0.815 g/cm3 (200 K). Furthermore, the whole p – V – T surface obtained herein is accurately predicted by the universal form of the Parsafar and Mason equation of state, l. l. l. Z. 𝑝 ‘l ’ = 𝐴‡ + 𝐴Y ‘ lR’ + 𝐴Z ‘ lR ’ , always with an accuracy of 99.71 % – 99.85 % in describing R. the empty sI molar volumes at any particular (p, T) point. The measurements of unit cell length, a, were employed to obtain the solid’s isobaric thermal expansivity in terms of a parabolic equation, 𝛼e = (𝜕𝑎⁄𝑎 ∙ 𝜕𝑇)e , revealing that the empty hydrate exhibits a positive thermal expansion up to a certain temperature threshold, beyond which (𝜕 Z 𝑎⁄𝑎 ∙ 𝜕𝑇 Z )e becomes negative. The particular temperature at which this phenomenon occurs decreases with applied pressure, starting at 194.7 K (1 bar) until finally reaching 166.2 K (5000 bar).. 31.
(32) The characteristic tetrahedral structure around oxygen atoms was examined using two order parameters, Sg and Sk, in order to monitor the angular and distance contributions to tetrahedral symmetry, respectively. Time-averaged distributions thus obtained reveal that the empty frameworks maintain tetrahedral integrity throughout the entire p – T domain, but respond accordingly by slightly distorting the lattice. For (p ,T) > (2000 bar, 200 K), lattice deformation occurs via a mechanism that involves a dominant contribution from angular alterations between the central tetrahedron atom and the peripheral ones. Radial distribution functions allowed the determination of the first and second neighbour shells around the O atoms and centered at r(O – O) = (0.27, 0.45) nm and r(O. – H). = (0.18, 0.32) nm, thus revealing that hydrogen bonds are of. similar length regardless of the particular (p, T) conditions. The average value 𝑟̅(h%f) = 0.25 nm compares satisfactorily with 0.275 nm obtained from experimental data for an empty sII lattice.. Supporting Information. Complete set of r – T data obtained in the simulations (Figure SI1), graphic plot of energy vs T (Figure SI2), final configuration snapshots of the (5000 bar, 220K) simulation (Figure SI3) and the complete set of ap maxima from Figure 3b (Table SI1) are given in Supporting Information.. Corresponding Author * [email protected]. Author Contributions. 32.
(33) F.J.A.L.C. designed the numerical experiments, performed the calculations and analysed data. The manuscript was written through contributions of all authors. The authors declare no competing financial interests.. ACKNOWLEDGMENT This work was supported by the Associate Laboratory for Green Chemistry LAQV which is financed by national funds from FCT/MEC (UID/QUI/50006/2013) and co-financed by the ERDF under the PT2020 Partnership Agreement (POCI-01-0145-FEDER - 007265); it also makes use of results produced with the support of the Portuguese National Grid Initiative (https://wiki.ncg.ingrid.pt). F.J.A.L.C. gratefully acknowledges financial support from FCT/MCTES (Portugal) through grants REQUIMTE/BPD/004/2016 and FCT/MCTES (UID/QUI/50006/2019).. 33.
(34) Bibliography. 1. Sloan, E. D.; Koh, C. A., Clathrate Hydrates of Natural Gases. 3rd ed.; CRC Press: Boca Raton, FL, 2007. 2. Buffett, B. A., Clathrate Hydrates. Ann. Rev. Earth Planetary Sci. 2000, 28, 477 - 507. 3. Udachin, K. A.; Ratcliffe, C. I.; Ripmeester, J. A., Structure, Composition, and Thermal Expansion of CO2 Hydrate from Single Crystal X-ray Diffraction Measurements. J. Phys. Chem. B 2001, 105, 4200-4204. 4. Fray, N.; Marboeuf, U.; Brissaud, O.; Schmitt, B., Equilibrium Data of Methane, Carbon Dioxide, and Xenon Clathrate Hydrates below the Freezing Point of Water. Applications to Astrophysical Environments. J. Chem. Eng. Data 2010, 55, 5101–5108. 5. Luspay-Kuti, A.; Mousis, O.; Hässig, M.; Fuselier, S. A.; Lunine, J. I.; Marty, B.; Mandt, K. E.; Wurz, P.; Rubin, M., The Presence of Clathrates in Comet 67P/Churyumov-Gerasimenko. Sci. Adv. 2016, 2, e1501781. 6. Koh, C. A., Towards a Fundamental Understanding of Natural Gas Hydrates. Chem. Soc. Rev. 2002, 31, 157–167. 7. McMullan, R. K.; Jeffrey, G. A., Polyhedral Clathrate Hydrates. IX. Structure of Ethylene Oxide Hydrate. J. Chem. Phys. 1965, 42, 2725 - 2732. 8. Mak, T. C. W.; McMullan, R. K., Polyhedral Clathrate Hydrates. X. Structure of the Double Hydrate of Tetrahydrofuran and Hydrogen Sulfide. J. Chem. Phys. 1965, 42, 2732 2737. 9. Ripmeester, J. A.; Tse, J. S.; Ratcliffe, C. I.; Powell, B. M., A New Clathrate Hydrate Structure. Nature 1987, 325, 135 - 136. 10. Conde, M. M.; Vega, C., Determining the Three-phase Coexistence Line in Methane Hydrates Using Computer Simulations. J. Chem. Phys. 2010, 133, 064507. 11. van der Waals, J. H.; Platteeuw, J. C., Clathrate Solutions. Adv. Chem. Phys. 1959, 2, 1 57. 12. Alavi, S.; Udachin, K.; Ratcliffe, C. I.; Ripmeester, J. A., Clathrate Hydrates in Supramolecular Chemistry. Wiley: New York, 2012. 13. Momma, K.; Izumi, F., VESTA 3 for Three-dimensional Visualization of Crystal, Volumetric, and Morphology Data. J. Appl. Cryst. 2011, 44, 1272 - 1276. 14. Lasich, M., An Improved Description of Clathrate Hydrates Using Classical Density Functional Theory Coupled with a Simple Lattice Gas and van der Waals-Platteeuw Theory. Fluid Phase Eq. 2018, 456, 131 - 139. 15. Falenty, A.; Hansen, T. C.; Kuhs, W. F., Formation and Properties of Ice XVI Obtained by Emptying a Type sII Clathrate Hydrate. Nature 2014, 516, 231 - 234. 16. Shpakov, V. P.; Tse, J. S.; Tulk, C. A.; Kvamme, B.; Belosludov, V. R., Elastic Moduli Calculation and Instability in Structure I Methane Clathrate Hydrate. Chem. Phys. Lett. 1998, 282, 107–114. 17. Jacobson, L. C.; Hujo, W.; Molinero, V., Thermodynamic Stability and Growth of GuestFree Clathrate Hydrates: A Low-Density Crystal Phase of Water. J. Phys. Chem. B 2009, 113, 10298–10307.. 34.
(35) 18. Tribello, G. A.; Slater, B., A Theoretical Examination of Known and Hypothetical Clathrate Hydrate Materials. J. Chem. Phys. 2009, 131, 024703. 19. Matsui, T.; Hirata, M.; Yagasaki, T.; Matsumoto, M.; Tanaka, H., Hypothetical Ultralowdensity Ice Polymorphs. J. Chem. Phys. 2017, 147, 091101. 20. Conde, M. M.; Vega, C.; Tribello, G. A.; Slater, B., The Phase Diagram of Water at Negative Pressures: Virtual Ices. J. Chem. Phys. 2009, 131, 034510. 21. Costandy, J.; Michalis, V. K.; Tsimpanogiannis, I. N.; Stubos, A. K.; Economou, I. G., Lattice Constants of Pure Methane and Carbon Dioxide Hydrates at Low Temperatures. Implementing Quantum Corrections to Classical Molecular Dynamics Studies. J. Chem. Phys. 2016, 144, 124512. 22. Kosyakov, V. I., Structure Formation Under Negative Pressures. J. Struct. Chem. 2009, 50, 60 - 65. 23. Allen, M. P.; Tildesley, D. J., Computer Simulation of Liquids. Clarendon Press: Oxford, 1990. 24. Frenkel, D.; Smit, B., Understanding Molecular Simulation, 2nd ed. Academic Press: San Diego, 2002. 25. Tuckerman, M. E., Statistical Mechanics: Theory and Molecular Simulation. Oxford University Press: Oxford, U.K., 2010. 26. Kosyakov, V. I.; Polyanskaya, T. M., Using Strctural Data for Estimating the Stability of Water Networks in Clathrate and Semyclathrate Hydrates. J. Struct. Chem. 1999, 40, 239 - 245. 27. Bernal, J. D.; Fowler, R. H., A Theory of Water and Ionic Solution, with Particular Reference to Hydrogen and Hydroxyl Ions. J. Chem. Phys. 1933, 1, 515 - 548. 28. Abascal, J. L. F.; Sanz, E.; Fernández, R. G.; Vega, C., A Potential Model for the Study of Ices and Amorphous Water: TIP4P/Ice. J. Chem. Phys. 2005, 122, 234511. 29. Takeya, S.; Alavi, S.; Hashimoto, S.; Yasuda, K.; Yamauchi, Y.; Ohmura, R., Distortion of the Large Cages Encapsulating Cyclic Molecules and Empty Small Cages of Structure II Clathrate Hydrates. J. Phys. Chem. C 2018, 122, 8134−18141. 30. Alavi, S.; Ohmura, R., Understanding Decomposition and Encapsulation Energies of Structure I and II Clathrate Hydrates. J. Chem. Phys. 2016, 145, 154708. 31. Bagherzadeh, S. A.; Alavi, S.; Ripmeester, J.; Englezos, P., Formation of Methane Nanobubbles During Hydrate Decomposition and Their Effect on Hydrate Growth. J. Chem. Phys. 2015, 142, 214701. 32. Tanaka, H.; Yagasaki, T.; Matsumoto, M., On the phase behaviors of hydrocarbon and noble gas clathrate hydrates: Dissociation pressures, phase diagram, occupancies, and equilibrium with aqueous solution. J. Chem. Phys. 2018, 149, 074502. 33. Jin, D.; Coasne, B., Molecular Simulation of the Phase Diagram of Methane Hydrate: Free Energy Calculations, Direct Coexistence Method, and Hyperparallel Tempering. Langmuir 2017, 33, 11217-11230. 34. Michalis, V. K.; Costandy, J.; Tsimpanogiannis, I. N.; Stubos, A. K.; Economou, I. G., Prediction of the Phase Equilibria of Methane Hydrates Using the Direct Phase Coexistence Methodology. J. Chem. Phys. 2015, 142, 044501. 35. Abascal, J. L. F.; Vega, C., A General Purpose Model for the Condensed Phases of Water: TIP4P/2005. J. Chem. Phys. 2005, 123, 234505. 36. Conde, M. M.; Vega, C.; McBride, C.; Noya, E. G.; Ramírez, R.; Sesé, L. M., Can Gas Hydrate Structures be Described Using Classical Simulations? J. Chem. Phys. 2010, 132, 114503.. 35.
(36) 37. Rowlinson, J. S.; Swinton, F. L., Liquids and Liquid Mixtures. Butterworths: London, 1982. 38. Hess, B.; Kutzner, C.; Spoel, D. v. d.; Lindahl, E., GROMACS 4: Algorithms for Highly Efficient, Load-Balanced, and Scalable Molecular Simulation. J. Chem. Theory Comp. 2008, 4, 435–447. 39. Nosé, S., A Unified Formulation of the Constant Temperature Molecular Dynamics Methods. J. Chem. Phys. 1984, 81, 511-519. 40. Hoover, W. G., Canonical Dynamics: Equilibrium Phase-space Distributions. Phys. Rev. A 1985, 31, 1695-1697. 41. Berendsen, H. J. C.; Postma, J. P. M.; DiNola, A.; Haak, J. R., Molecular Dynamics With Coupling to an External Bath. J. Chem. Phys. 1984, 81, 3684 – 3690. 42. Darden, T.; York, D.; Pedersen, L., Particle Mesh Ewald: An Nlog(N) Method for Ewald Sums in Large Systems. J. Chem. Phys. 1993, 98, 10089-10092. 43. Essmann, U.; Perera, L.; Berkowitz, M. L.; Darden, T.; Lee, H.; Pedersen, L. G., A Smooth Particle Mesh Ewald Potential. J. Chem. Phys. 1995, 103, 8577-8592. 44. Bourry, C.; Charlou, J.-L.; Donval, J.-P.; Brunelli, M.; Focsa, C.; Chazallon, B., X-ray Synchrotron Diffraction Study of Natural Gas Hydrates from African Margin. Geophysical Research Letters 2007, 34, L22303. 45. Minami, H.; Shoji, H.; Takeya, S.; Obzhirov, A.; Hachikubo, A.; Wallmann, K.; Salomatin, A.; Kida, M.; Takahashi, N.; Biebow, N.; Sakagami, H.; Soloviev, V.; Poort, J., Structure and Thermal Expansion of Natural Gas Clathrate Hydrates. Chem. Eng. Sci. 2006, 61, 2670 - 2674. 46. Rodger, P. M., Stability of Gas Hydrates. J. Phys. Chem. 1990, 94, 6080 - 6089. 47. Ogienko, A. G.; Kurnosov, A. V.; Manakov, A. Y.; Larionov, E. G.; Ancharov, A. I.; Sheromov, M. A.; Nesterov, A. N., Gas Hydrates of Argon and Methane Synthesized at High Pressures: Composition, Thermal Expansion, and Self-Preservation. J. Phys. Chem. B 2006, 110, 2840-2846. 48. Feistel, R.; Wagner, W., A New Equation of State for H2O Ice Ih. J. Phys. Chem. Ref. Data 2006, 35, 1021-1047. 49. Handa, Y. P.; Tse, J. S., Thermodynamic Properties of Empty Lattices of Structure I and Structure II Clathrate Hydrates. J. Phys. Chem. 1986, 90, 5917-5921. 50. Ikeda, T.; Mae, S.; Yamamuro, O.; Matsuo, T.; Ikeda, S.; Ibberson, R. M., Distortion of Host Lattice in Clathrate Hydrate as a Function of Guest Molecule and Temperature. J. Phys. Chem. A 2000, 104, 10623-10630. 51. Hester, K. C.; Huo, Z.; Ballard, A. L.; Koh, C. A.; Miller, K. T.; Sloan, E. D., Thermal Expansivity for sI and sII Clathrate Hydrates. J. Phys. Chem. B 2007, 111, 8830-8835. 52. Gutt, C.; Asmussen, B.; Press, W.; Johnson, M. R.; Handa, Y. P.; Tse, J. S., The Structure of Deuterated Methane–Hydrate. J. Chem. Phys. 2000, 113, 4713 - 4721. 53. Hansen, T. C.; Falenty, A.; Kuhs, W. F., Lattice Constants and Expansivities of Gas Hydrates from 10 K up to the Stability Limit. J. Chem. Phys. 2016, 144, 054301. 54. Evans, J. S. O., Negative Thermal Expansion Materials. J. Chem. Soc. Dalton Trans. 1999, 3317–3326. 55. Tang, X. L.; al., e., Theoretical and Experimental Study of the Type-II Clathrate Polymorph of Si. Phys. Rev. B 2006, 74, 014109. 56. Parsafar, G.; Mason, E. A., Universal Equation of State for Compressed Solids. Phys. Rev. B 1994, 49, 3049-3060.. 36.
(37) 57. P. Vinet; Ferrante, J.; Smith, J. R.; Rose, J. H., A Universal Equation of State for Solids. J. Physics C 1986, 19, L467–L473. 58. Cruz, F. J. A. L.; Lopes, J. N. C.; Calado, J. C. G., Molecular Dynamics Simulations of Monoclinic Calcium Apatites: A Universal Equation of State. Fluid Phase Eq. 2007, 253, 142– 146. 59. Cruz, F. J. A. L.; Lopes, J. N. C.; Piedade, M. E. M. d.; Calado, J. C. G., A Molecular Dynamics Study of the Thermodynamic Properties of Calcium Apatites. 1.Hexagonal Phases. J. Phys. Chem. B 2005, 109, 24473-24479. 60. Cruz, F. J. A. L.; Lopes, J. N. C.; Calado, J. C. G., Molecular Dynamics Study of the Thermodynamic Properties of Calcium Apatites. 2. Monoclinic Phases. J. Phys. Chem. B 2006, 110, 4387-4392. 61. Cruz, F. J. A. L.; Lopes, J. N. C.; Calado, J. C. G., Molecular Dynamics Simulations of Molten Calcium Hydroxyapatite. Fluid Phase Eq. 2006, 241, 51-58. 62. Báez, L. A.; Clancy, P., Computer Simulation of the Crystal Growth and Dissolution of Natural Gas Hydrates. Ann. New York Acad. Sci. 1994, 177 - 186. 63. Chau, P.-L.; Hardwick, A. J., A New Order Parameter for Tetrahedral Configurations. Mol. Phys. 1998, 93, 511-518. 64. Lauricella, M.; Meloni, S.; English, N. J.; Peters, B.; Ciccotti, G., Methane Clathrate Hydrate Nucleation Mechanism by Advanced Molecular Simulations. J. Phys. Chem. C 2014, 118, 22847−22857. 65. Tung, Y.-T.; Chen, L.-J.; Chen, Y.-P.; Li, S.-T., The Growth of Structure I Methane Hydrate from Molecular Dynamics Simulations. J. Phys. Chem. B 2010, 114, 10804–10813. 66. Rodger, P. M.; Forester, T. R.; Smith, W., Simulations of the Methane Hydrate / Methane Gas Interface Near Hydrate Forming Conditions. Fluid Phase Eq. 1996, 116, 326-332. 67. Haile, J. M., Molecular Dynamics Simulation: Elementary Methods. Wiley: New York, 1992.. 37.
(38) For TOC Only. 38.
(39) Low-temperature Thermodynamic Study of the Metastable Empty Clathrate Hydrates using Molecular Simulations Fernando J.A.L. Cruz1,*, Saman Alavi2 and José P.B. Mota1 1. LAQV-REQUIMTE, Department of Chemistry, Faculdade de Ciências e Tecnologia,. Universidade NOVA de Lisboa, 2829-516 Caparica, Portugal. 2National Research Council of Canada, Ottawa, Ontario, K1A 0R6, Canada. 3Department of Chemistry and Biomolecular Sciences, University of Ottawa, Ottawa, Ontario, K1N 6N5, Canada. *[email protected]. Supporting Information. S1.
(40) Figure SI1. Isobaric r – T data obtained in the calculations for the empty sI clathrate hydrate phase.. Figure SI2. Potential energy obtained from the calculations (symbols) and corresponding linear correlations (lines): ) 1 bar, ) 100 bar, ▲) 500 bar, ▼) 1000 bar, ■) 2000 bar and ●) 5000 bar for the empty sI clathrate hydrate phase.. Supporting Information. S2.
(41) Table SI1. Isobaric thermal expansivity maxima, ap, for the curves in Figure 3b. P (bar) Tmax (K) ap (10–5K–1). 1 194.7 5.306. 100 193.0 5.235. 500 193.8 5.025. 1000 189.6 4.710. 2000 183.0 4.148. 5000 166.2 2.630. Figure SI3. Snapshots of two different views of the final configuration of the (5000 bar, 220 K) simulation after 50 ns reveal clathrate integrity. top) volumetric representation of the atomic clouds (not to scale) and bottom) ball and stick model for water (O – red, H – white).. Supporting Information. S3.
(42)
Imagem

+7


Documentos relacionados
i) A condutividade da matriz vítrea diminui com o aumento do tempo de tratamento térmico (Fig.. 241 pequena quantidade de cristais existentes na amostra já provoca um efeito
Ousasse apontar algumas hipóteses para a solução desse problema público a partir do exposto dos autores usados como base para fundamentação teórica, da análise dos dados
A infestação da praga foi medida mediante a contagem de castanhas com orificio de saída do adulto, aberto pela larva no final do seu desenvolvimento, na parte distal da castanha,
didático e resolva as listas de exercícios (disponíveis no Classroom) referentes às obras de Carlos Drummond de Andrade, João Guimarães Rosa, Machado de Assis,
Veremos, pois, .a seguir, quais são as estruturas do imaginário que podem se encontrar no Recife, o tipo de angústia que a( se desenvolve, as armas utiliza- das para combater
não existe emissão esp Dntânea. De acordo com essa teoria, átomos excita- dos no vácuo não irradiam. Isso nos leva à idéia de que emissão espontânea está ligada à
Subprocessos Análise dos Requisitos do Sistema Projeto da Arquitetura do Sistema Integração do Sistema Teste do Sistema Instalação do software Projeto Sistema Elicitação de
Esse trabalho busca contribuir com os docentes da rede regular de ensino de educação infantil para a compreensão da origem da indisciplina e se a mesma esta relacionada a
