ELSEVIER
Analytica Chimica Acta 308 (1995) 122-128CHIMICA
ACTA
Construction and use of a tubular picrate ion-selective electrode
for reducing sugar determination in Port wine by flow-injection
analysis
Teresa I.M.S. Lopes a, Antho
O.S.S. Range1 a, * , Jo& L.F.C. Lima b,
M. ConceiQio B.S.M. Montenegro b
a Escola Superior de Biotecnologia, Uniuersidade Cat6lica Portuguesa, Rua Dr. Ant&Go Bernardino de Almeida, 4200 Porte, Portugal b CE QUP/Departamento de Quimica-Fisica, Faculdade de Farmcicia, Universidade do Porto, Rua Anibal Cunha 164, 4050 Porto,
Portugal
Received 6 May 1994
Abstract
A picrate ion-selective electrode without inner reference solution and based on bis(triphenylphosphoranylidene)am- monium picrate dissolved in 2-nitrophenyloctyl ether was constructed and its characteristics assessed. With respect to reducing sugar determination in Port wine, a tubular electrode based on the same sensor system was developed and incorporated into a flow-injection manifold devised for this determination. The methodology involves a reaction between the reducing sugar and picric acid, the decrease in the picrate concentration being monitored with the tubular electrode. A linear dependence between peak width, at a fixed potential and the logarithm of sugar concentration in the range 25-200 g 1~ ’ was obtained. The proposed system allows wine samples to be injected with no previous treatment and allows a sample throughput of 50 determinations per hour, a relative standard deviation less than 4%, and the results are comparable to the reference procedures.
Keywords: Flow injection; Ion selective electrodes; Picrate; Sugar; Wine
1. Introduction
Reducing sugar determination is usually required in wine production [l] for routine quality control, assessment of the extension of the fermentation pro- cess, and also to check on the conformity to the requirements of a certain wine type, such as Port. This determination is usually accomplished by a
* Corresponding author.
redox titration (reference procedure) [2], or by resort- ing to automatic equipment based on segmented flow analysis (SFA) or liquid chromatography (LC) [l]. As these last two methods involve too expensive equipment for most routine control laboratories, flow-injection analysis (FIA) systems might become an attractive alternative for automating this determi- nation, because of their relatively low cost, simplic- ity and high sampling rates achieved.
Some FIA systems for the reducing sugar deter- mination in wines with calorimetric detection based on different reactions have already been described
0003.2670/9.5/$09.50 0 1995 Elsevier Science B.V. All rights reserved
T.I.M.S. Lopes et al. /Analytica Chimica Acta 308 (1995) 122-128 123
[3,4]. In these methodologies, samples with a high sugar content have to be previously diluted to adjust the analyte concentration to the linear working range of the method. Additionally, in some cases it is necessary to remove coloured compounds from wines before measurement, either by previous filtration with charcoal, or by incorporating a dialysis unit into the flow system. The use of potentiometry as the detection system for this determination could be an advantageous alternative due to the broad response range of ion-selective electrodes (ISE) and of their lack of sensitivity to the samples colour or turbidity, thus allowing to avoid sample pretreatments inherent to calorimetric detection.
One of the described methodologies for the flow- injection reducing sugar determination involves the picric acid reaction with reducing sugar [3]. The decrease of the picrate concentration during the reac- tion could be monitored with a picrate ion-selective electrode. However, most of the references to picrate electrodes [5-91 present some deficiencies that could limit their application, namely regarding mechanical instability, high response times and mainly a short lifetime. These problems could be attributed to the use of the ionic sensor in the liquid form [5,6,8] or immobilized in PVC with inner reference solution [9]. Additionally, the utilization of mediator solvents with deficient plasticising characteristics may con- tribute to an increase of the membrane solubility, namely in non-polar solvents like ethanol. This could be a limitation to their application in matrices that present a high alcohol content, such as wines. In order to obtain a picrate electrode with better func- tioning characteristics, that could be constructed with a tubular shape to be used in a flow-injection system for the reducing sugar determination in Port wine, units without inner reference solution and PVC membranes prepared with a mediator with good plas- ticising characteristics (2-nitrophenyloctyl ether), were constructed.
The option for the use of tubular electrodes, in- stead of other described configurations, was due to the problems that arise when electrodes with a con- ventional configuration are incorporated in a flow system [lo]. The main problem is the electric noise produced by the mechanical instability caused by the difficulty to attach the electrodes to the manifold in a robust way.
Once the picrate tubular detector based on bisctri- phenylphosphoranylidene)ammonium picrate dis- solved in 2-nitrophenyloctyl ether was constructed, a flow-injection system was developed for the reduc- ing sugar determination in Port wine over a large concentration range between peak width and loga- rithm of concentration. The results obtained by FIA for some Port wines were compared with those furnished by the reference procedures.
2. Experimental
2.1. Reagents and solutions
All chemicals used were of analytical-reagent grade with no further purification, and deionized water with a specific conductance less than 0.1 &S cm-’ was used throughout.
The picrate stock solutions (about 6 X 10e2 M) were prepared from picric acid that was titrated with a standard sodium hydroxide solution, followed by addition of NaOH 0.2 M so that a final pH of 6 was obtained.
The sodium picrate standards used in the assess- ment of the conventional and tubular electrode char- acteristics were prepared by rigorous dilution of the stock solution. Sodium sulfate was added to every standard, so that a final concentration of 0.033 M was obtained, in order to adjust the ionic strength to 0.1 M.
The sugar standards used for establishing the calibration curves consisted of a mixture of fructose (60%) and glucose (40%), and were prepared in 20% ethanol.
The solutions that circulated in the flow-injection manifold were previously degassed in an ultrasonic bath.
2.2. Instrumentation and electrodes
A Crison 2002 digital voltmeter (_t 0.1 mV sensi- tivity) was used for the potentiometric measure- ments, which was coupled to a Kipp and Zonen BD 111 chart recorder for the FIA determinations. As reference electrode, a double junction Russel Model 90-0029 with 0.033 M Na,SO, in the outer compart- ment was used.
In the flow-injection manifolds, Ismatec Mini- S/840 peristaltic pumps incorporating Gilson tubes were used to propel the solutions. The injection of standards and samples in the carrier stream was performed with a Rheodyne Type 5020 six-port ro- tary valve. Omnifit PTFE tubing (0.8 mm id.) with Gilson end-fittings and connectors were used as manifold conduits.
In the FIA system developed for the reducing sugar determination, a tubular picrate ion-selective electrode was used. The reference electrode was placed in a previously described support [ 111, and a 1 cm long (0.8 mm id.) stainless-steel tube was used as ground electrode.
The pH measurements were performed with a Ingold 102723028 glass electrode.
2.3. Electrodes construction
The ion exchanger used in the membrane prepara- tions was obtained by mixing 200 ml of a 1 X 10m3 M sodium picrate solution with the same volume of a 1 X lop3 M bis(triphenylphosphoranylidene)am- monium chloride solution. The precipitate formed, bis(triphenylphosphoranylidene)ammonium picrate, was washed with water, centrifuged and kept in a desiccator. For preparing the sensor solution, 0.0431 g of the obtained precipitate were dissolved in 0.7886 g of 2-nitrophenyloctyl ether, and the resulting solu- tion was mixed with 0.18 g of PVC previously dissolved in 6 ml of tetrahydrofuran.
The conventionally-shaped electrodes were con- structed by applying dropwise the sensor solution to the conductive surface of the electrode body [12], consisting of a mixture of Araldite epoxy resin and graphite powder [13]. Afterwards, the membranes were left to dry at room temperature for one day. The electrodes were then conditioned in a 1 X 10m2 M sodium picrate solution before use.
The tubular electrodes were prepared using the same sensor solution as the conventional units, fol- lowing a previously described procedure [14]. The membranes of the tubular electrodes were dried overnight at room temperature and then inserted in a module to allow its incorporation in a flow injection manifold. In this way, a flow channel of approxi- mately 0.8 mm i.d. and 1 cm long was created, the
Table 1
Some functioning characteristics of conventionally-shaped and tubular picrate ion-selective electrodes
ISE parameter Conventional Tubular LLLR (M) d 8X 10-h 5X1O-h PDL (M) a 3x10-h _ Slope (mV decade- ’ ) b - 57.6 -57.x Lifetime (months) >5 >5 Response time (s) 5 _ pH operational range ’ 3-11 3-11 Sampling-rate (h-r ) _ 240
a Average values for two units obtained in a solution with the ionic strength adjusted to 0.1 M; LLLR, lower limit of linear response; PDL, practical detection limit.
’ Average values for two electrodes tested for 5 months. ’ Obtained for 10-a and 10-I M picrate concentrations.
membrane surface being left in contact with a 1 X
lop2 M sodium picrate solution before use. 2.4. Reference method
In order to assess the quality of the results ob- tained in the reducing sugar determination in Port wines by FIA, they were compared with those ob- tained by a reference procedure [2]. The wines were previously treated with either lead acetate and cal- cium carbonate (red wines) or with potassium hexa- cyanoferrate(I1) and zinc sulfate (white wines) and filtered. A cupric-alkaline solution was added to the filtrate, and refluxed for 10 min. After cooling, an excess of potassium iodide was added and the solu- tion titrated in acidic medium with sodium thiosul- phate, using starch for indicating the titration end- point.
3. Results and discussion
The picrate ion-selective electrodes with a con- ventional and a tubular shape were constructed and their characteristics assessed. A manifold incorporat- ing the tubular electrode was assembled for carrying out the reducing sugar determination in Port wine. 3.1. Behauiour of the picrate ion-selectice electrodes
The conventionally shaped-electrodes were evalu- ated following recommended procedures [lS] in solu-
T.I.M.S. Lopes et al. /Analytica Chimica Acta 308 (1995) 122-128 125
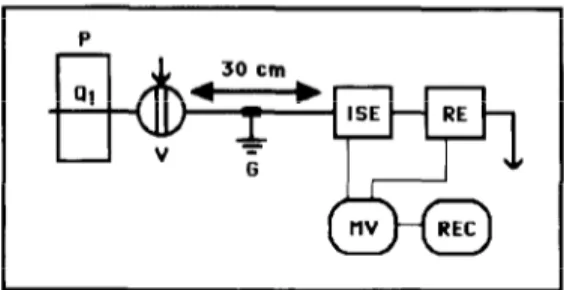
Fig. 1. Low dispersion flow-injection manifold used for the assessment of the picrate tubular electrode characteristics: P = peristaltic pump; Q, = flow-rate (6.0 ml min-I); V = injection valve (200 ~1); G = ground electrode; ISE = tubular ion-selective electrode; RE = reference electrode; MV = pH meter; REC = recorder.
with the exception of the evaluation of the lower limit of linear response, in which a 5 X lo-’ M sodium picrate in 0.033 M Na,SO, solution was used. The use of a low picrate concentration in the carrier stream enabled a constant conditioning of the electrode surface to be achieved, thus contributing to baseline stabilization. Sodium sulfate was used to adjust the ionic strength and increase the solution conductivity. The picrate standards used for estab- lishing the calibration curves also presented the ionic strength adjusted to 0.1 M with Na,SO,.
tions with the ionic strength adjusted with 0.033 M Na,SO,. The characteristics measured are presented in Table 1. The interference of some inorganic an- ions was evaluated by the separate solution method, the results obtained being presented in Table 2.
Comparing the characteristics of the developed units with other electrodes reported [5-91, an im- provement of some characteristics like the linear working range, response time and especially the lifetime, was registered. Some of these aspects are important for its subsequent application in flow sys- tems.
Some preliminary experiments were carried out to establish the manifold parameters for performing the electrode evaluation. The injection volume was set at 200 ~1, which provided a signal corresponding to about 98% of the stationary response. Larger values did not significantly increase the signal and caused an unwanted longer time to return to baseline. As would be expected in a potentiometric measurement, the influence of the flow-rate was quite small in the range 4.0-8.4 ml min-‘. A flow-rate of 6 ml min-’ was used for the subsequent electrode characteristics assessment, as a compromise between sampling-rate and carrier solution consumption.
The assessment of the intrinsic characteristics of the tubular electrodes was carried out in a low dispersion single-channel flow injection manifold (Fig. l), thus allowing to compare the obtained values with those furnished by the conventionally- shaped units.
Using the abovementioned manifold parameters, tubular electrode assessment was carried out for evaluating calibration parameters, reproducibility and the influence of other ions on the electrode potential.
As a carrier stream, a 1 X 10m6 M sodium picrate and 0.033 M Na,SO, solution was used in every test
For assessing the lower limit of linear response (LLLR), calibration curves for two electrode units, in the picrate concentration range from 8.1 X lo-’ M to 5.3 X lop2 M, were established. An LLLR aver- age value of 5 X 1O-6 M and a slope of -57.8 mV per decade were obtained. The electrode repro- ducibility during a working day was evaluated by
Table 2
Potentiometric selectivity coefficients (log K ‘” ’ ) for the conventionally-shaped and tubular picrate ion-selective electrodes, corresponding to three different concentration (picrate and intcrferent) levels (10m4, 10W3 and lo- * M)
Interfering Conventional Tubular species
1O-4 M lo-” M lo-* M 1O-4 M lo-” M lo-* M Sulphatc -3.64 -4.41 -5.25 _ _ _ Chloride -1.95 - 2.36 - 3.40 - 1.64 - 2.71 -3.73 Bromide -1.46 ~ 2.43 - 3.49 - 1.45 - 2.46 -3.35 Iodide -1.39 -2.10 - 2.54 - 0.91 - 1.65 - 2.35 Fluoride - 1.28 - 2.22 - 3.28 - 1.63 - 2.71 - 3.64 Nitrate - 1.40 - 2.14 - 2.85 - 1.62 - 2.57 -3.03 Perchlorate - 0.98 - 1.31 -1.78 - 0.48 ~ 0.96 - 1.40
making successive calibrations with picrate standards between 5 X 10e5 and 1.5 X lo-’ M. The slope did not change more than 1 mV per decade per day.
With the preset manifold parameters, the tubular electrodes presented a fast response, allowing to obtain a sampling-rate of about 240 determinations per hour.
To study the influence of pH on the electrode potential, the same manifold with small alterations [16] was used. An operational pH interval of 3-11 for picrate concentrations of lo-” M and lo-’ M was obtained.
A summary of the characteristics of the tubular electrode is presented in Table 1. The potentiometric selectivity coefficients for some anions evaluated by the separate solution method are indicated in Table 2.
From the assessed parameters, it should be noted that the tubular electrode characteristics were very similar to those of the conventional electrodes. The lower limit of linear response, as well as the extent of interferences, was lower for the tubular electrode. The high response speed and the fast return to the baseline after peak maximum presented by the tubu- lar electrodes are important characteristics for its use in flow injection manifolds, so that a high sampling rate (240 per hour) could be achieved.
3.2. Development of a flow injection manifold for
reducing sugar determination
The FIA system was based on the reducing sugar reaction with picrate in alkaline media, the conse- quent decrease of picrate concentration being moni- tored by the tubular electrode. The measurement was based on the peak width (time interval) at some fixed value of the analytical signal. Calibration curves were established between peak width and the loga- rithm of reducing sugar concentration.
The manifold configuration (Fig. 2) was essen- tially conditioned by pH reaction conditions and also pH operational range of the tubular detector. The sample was injected into the picric acid carrier solu- tion and then NaOH was added at confluence X to obtain a high pH for the reaction to occur to an appreciable extent. Subsequently the reaction be- tween picrate and reducing sugars proceeds in the coiled tube L, which was immersed in a ther-
WASTE
Fig. 2. Flow-injection system for the reducing sugar determination in Port wine: P = peristaltic pump; V = injection valve (150 ~1); R, = reagents (R,, picric acid 0.045 M; R,, NaOH 1.8 M; R,, HZSO, 1.0 M); Qi = flow-rates (Q, = 0.70 ml min-‘; Qz = Q3 = 0.20 ml min-‘1; Li = tube length (cm); G = ground electrode; ISE = tubular ion-selective electrode; RE = reference electrode; MV = pH meter; REC = recorder; X, Y = confluences. The mani- fold components within dashed lines were kept immersed in a thermostated water bath (58°C).
mostated bath (58°C) for increasing the reaction rate. Due to the high pH of the flowing solution at this point, picrate measurement at the tubular electrode could not be achieved, as the hydroxide concentra- tion had a pronounced effect on the electrode poten- tial for pH values > 11. Thus a solution of H, SO, was added at confluence Y for adjusting the solution pH to ca. 7 before the measurement.
The manifold parameters were then optimized in order to allow direct injection of wine samples with no previous treatment. The sugar standards were composed of a mixture of fructose (60%) and glu- cose (40%), corresponding to the usual relative sugar percentages in Port wine. In fact, calibration curves for fructose and glucose had different sensitivities, evidencing that the reaction of fructose with picrate is faster than with glucose. Additionally, the peak shape was also influenced by the alcohol content. In this way, sugar standards were prepared with an ethanol concentration of 20% by vol. (concentration usually found in Port wines).
Using the system presented in Fig. 2, optimization procedures were carried out by studying the influ- ence of each manifold parameter on the calibration curve, and maintaining the others to a preset value.
The sample volume was fixed at 150 ~1, because at larger volumes the peak became too broad thus diminishing the sampling throughput rate; for smaller volumes the sensitivity was significantly decreased. Low flow-rates were chosen in order to guarantee a sufficient sample residence time to enable the reac-
T.I.M.S. Lopes et al. / Analytica Chimica Acta 308 (199.5) 122-128 127
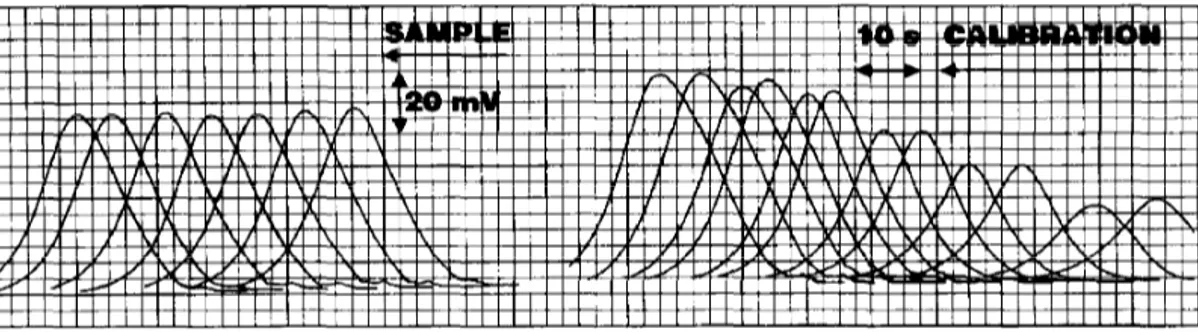
Fig. 3. FIA recorder output obtained for reducing sugar determination in Port wine, corresponding to the injection in duplicate of a set of standards in the range 25-200 g l- ’ , and a sample (seven consecutive injections).
tion to occur in a sufficient extent to perform a measurement with good sensitivity. The QZ and Q3 flow-rates used were lower than for the picric acid carrier solution (Q,) in order to minimize dilution in confluences X and Y.
The tube L, guarantees only a minimum disper- sion before confluence X. The length of tube L,, immersed in a thermostated bath at WC, has a large influence on the sensitivity of the method. In effect sensitivity increases with increasing tube length due to a larger reaction time. A tube of 250 cm was chosen as a compromise between sensitivity and sampling rate. For preserving sample integrity and in order to obtain a good sampling rate, the tube was coiled for increasing radial mixing. A length of 100 cm was chosen for L, in order to assure good mixing with H,SO,, in order to attain an homoge- neous pH for the solution flowing through the tubu- lar electrode. A ground electrode was incorporated just before measurement to eliminate background electrical noise.
The temperature of the thermostated bath was set to 58°C; at higher temperatures air bubbles were formed in the immersed L, reactor in spite of the previous degassing process carried out in an ultra- sonic bath. This problem was minimized by main- taining the picric acid solution immersed in the thermostatic bath.
The influence of the picric acid concentration on the analytical signal was studied in the range 0.025- 0.06 M and of sodium hydroxide between 1.7 and 2.6 M. Concentrations of 0.045 M for picric acid and 1.8 M for NaOH were selected. An increase in the concentrations produced greater sensitivity but a pre- cipitate was formed inside the flow tubes. The H 2 SO, concentration (1.0 M) in channel Q3 was selected to enable the pH of the solution flowing through the electrode to be adjusted to about 7.
Under the optimized conditions and by measuring the peak width at the preset potential (20 mV above the baseline), a linear plot was obtained from 25 to 200 g 1 - ’ of reducing sugar.
Table 3
Comparison between the results obtained by FIA and by the reference method (ON) and values of the relative standard deviation (R.S.D.) for each methodology and the relative deviation (R.D.) between the two methods
Sample FL4 OIV R.D. (%)
Cont. (g 1~‘) R.S.D. (%‘u) ’ Cont. (g 1-l) R.S.D. (%o) a 1 98.6 3.9 (3) 101 3.0 (6) 2 116 2.0 (7) 110 0.9 (6) 3 117 2.1 (3) 128 1.6 (5) 4 148 2.5 (3) 147 2.7 (4) 5 103 2.4 (5) 103 0.0 (5) 6 122 1.6 (3) 124 0.8 (5) 7 98.5 2.3 (3) 102 1 .O (6)
a The number of consecutive determinations used for the relative standard deviation are indicated in parentheses.
- 2.4 +5.1 -8.7 t 0.7 0.0 - 1.6 -3.4
3.3. Application to wine analysis Acknowledgements
The developed FIA methodology was applied to the determination of reducing sugars in 7 Port wines. The results (C,) were compared with those furnished by the reference method (C,) [2]. A recorder output corresponding to the injection of a set of standards and a sample is presented in Fig. 3.
The results obtained, as well as the corresponding precision (expressed as the relative standard devia- tion) are presented in Table 3.
This work was carried out under an European Union programme (AAIR3-CT94-2468) and IDARN (Project 24) of P or ugal. t One of the authors (T.I.M.S. Lopes) gratefully acknowledges financial support from JNICT (grant BD/2096/92-IF). Wine samples were kindly supplied by Cockburn Smithes (Gaia, Portugal).
By establishing a linear regression (C, = C,, + SC,) between the results furnished the two method- ologies, an intercept (C,,) of 2.4 g l-‘, a slope (S) of 0.965 and a correlation coefficient of 0.96, were obtained, pointing out that there is fairly good agree- ment between the two methods. The results obtained by FIA present good precision, with relative standard deviations < 3.9%. The sampling rate achieved is ca. 50 determinations per hour.
References 111 t21 4. Conclusions [31 [41
The constructed conventionally-shaped picrate electrodes described above have better characteristics than those described in the literature, due to the use of a plastic membrane without inner reference solu- tion and with a solvent mediator with better plasticis- ing characteristics. This enabled the preparation of tubular detectors with good characteristics for their incorporation into FIA systems in a robust way. Using these detectors it was possible to develop a flow injection manifold for reducing sugar determi- nation in Port wines with direct injection of wine samples, thus not requiring previous dilution and removal of coloured compounds.
151
M.A. Amerine and C.S. Ough, Methods for Analysis of Musts and Wines, Wiley, New York, 1980.
Office International de la Vigne et du Vin (OIV), Recueil dcs Mtthodes Internationales d’Analyse des Vins et des Moiits, OIV, 1990.
A. Maquieira, M.D. Luque de Castro and M. Valcarcel, Analyst, 112 (1987) 1569.
M. Peris-Tortajada, R. Puchades and A. Maquicira, Food Chem., 43 (1992) 65.
T.P. Hadjiioannou and E.P. Diamandis, Anal. Chim. Acta, 94 (1977) 443. 161 171 181 [91 1101
The developed FIA methodology is an advanta- geous alternative to the reference procedures as it presents comparable results with good precision and sampling rate, and using low cost equipment.
t111 [121 1131 t141 [151 [1’51
E.P. Diamandis, M.A. Koupparis and T.P. Hadjiioannou, Microchem. .I., 22 (1977) 498.
S.G. Back, Anal. Len., 4 (1971) 793. S.G. Back, Anal. Chem., 44 (19721 1696. D. Homolka, Chem. Commun., 44 (1979) 3644.
I.M.P.L.O. Ferreira and J.L.F.C. Lima, J. Flow Injection Anal., 10 (1993) 17.
S. Alegret, J. Alonso, J. Bartroli, A.A.S.C. Machado, J.L.F.C. Lima and J.M. Paulis, Quim. Anal., 6 (1987) 278. J.L.F.C. Lima and A.A.S.C. Machado, Analyst,111 (1986) 799.
R.A.S. Lapa, J.L.F.C. Lima and A.M.R. Silva, II Farmaco, 45 (1990) 901.
J. Alonso-Chamarro, J. Bartroli, S. Jun, J.L.F.C. Lima and M.C.B.M. Montenegro, Analyst, 118 (1993) 1527.
IUPAC, Pure Appl. Chem., 53 (1981) 1907.
S. Alegret, J. Alonso, J. Bartroli, J.L.F.C. Lima, A.A.S.C. Machado and J.M. Paulis, Anal. Lett., 18 (1985) 2291.