Article
J. Braz. Chem. Soc., Vol. 26, No. 10, 2063-2068, 2015. Printed in Brazil - ©2015 Sociedade Brasileira de Química 0103 - 5053 $6.00+0.00
A
*e-mail: [email protected]
Sequential Injection Analysis with Square Wave Voltammetry (SI-SWV) Detection
for Investigation of Adsorption of Picloram on a Clay Soil
Luciana B. O. dos Santos*,a and Jorge C. Masinib
aDepartamento de Exatas, Universidade Estadual de Feira de Santana,
Avenida Transnordestina, s/n, 44036-900 Feira de Santana-BA, Brazil
bInstituto de Química, Universidade de São Paulo, CP 26077, 05513-970 São Paulo-SP, Brazil
This paper describes a sequential injection analysis method, with detection by square wave voltammetry using a hanging mercury drop electrode, to determine the herbicide picloram in soil extracts (0.010 mol L-1 CaCl
2). The method was applied for determination of the Freundlich
parameters related to adsorption of picloram on a tropical soil sample. The major advantage of the proposed method over the conventional chromatographic methods is the high sampling throughput of 190 analyses per hour, with detection and quantification limits of 0.036 and 0.12 mg L-1, respectively. The K
f (0.0016 ± 0.0005 µmol
1-1/n L1/n kg-1) and 1/n (0.85 ± 0.06) obtained by the
proposed method did not differ from those determined by liquid chromatography with UV detection.
Keywords: herbicide, voltammetry, sequential injection, picloram
Introduction
Picloram (4-amino-3,5,6-trichloro-2-pyridinecarboxilic acid) is a synthetic organochlorine compound used in the salt form as a systemic herbicide for controlling annual weeds in crops, and in combination with 2,4-dichlorophenoxyacetic acid (2,4-D) or 2,4,5-trichlorophenoxyacetic acid (2,4,5-T) against perennials on non-croplands for brush control.1 Picloram is considered a persistent herbicide because it has been detected in some cultures in Canada one year after the application.2 According to Spadotto and Hornsby,3 adsorption of the acidic pesticide 2,4-D on soils is higher for neutral (pH < pKa) than for negatively charged molecules (pH > pKa). Adsorption of picloram on humin and humic acids carried out by Nearpass4 showed that at pH close to the pKa of picloram (3.4), adsorption of the herbicide is greater than that observed at higher pHs, at which the herbicide is predominantly found as the anion, in agreement with the results observed for 2,4-D. Grover5 found that adsorption of picloram on soil is pH dependent and that there is a decrease in bioactivity of the herbicide at low pH, a behavior which can be explained by interactions between the molecular forms of picloram with humic acids and/or humin in the soil. It was found that the adsorption of picloram on soils is dependent on the amount of organic matter.6-8 Soils poor
in organic matter have low retention of picloram, which can be easily leached to rivers, lakes and groundwater.
the advantages of high speed and high sensitivity.17 Coupling SWV to an SI system enabled the quantification of picloram in natural waters at a sampling throughput of 190 analyses per hour.18 The combination of the high sensitivity obtained by SWV, with the versatility of SI enabled the automation of analyses for determination of picloram, appears as a promising alternative for the determination of this herbicide in many kinds of matrices, including soil solutions involved in adsorption studies.
Experimental
Apparatus and reagents
Voltammetric measurements were carried out using an EG&G model 263A potentiostat. An EG&G model 303A static mercury drop electrode (SMDE) was used in all experiments. The flow cell adapted to the Hg capillary has already been described in the literature.19 The electrochemical cell was completed with an Ag/AgCl reference electrode (saturated KCl) and a platinum auxiliary electrode. A Metrohm 654 pH-meter was used with a Mettler Toledo HA405-60-88G-S7/120-Ag/AgCl combination glass electrode for pH measurements. Ultrapure N2 (O2 < 2 ppm) was used to remove dissolved O2 from the solutions and to provide an inert atmosphere inside the cell. Purified and doubly distilled mercury was used in the working electrode. An FIAlab 3500 (FIAlab Instruments, Bellevue) instrument was used in all experiments in the sequential injection mode according to Figure 1. Solutions were driven by a 5.00 mL syringe pump and an eight port rotary valve, RV (Valco Instrument Co.). The holding coil, HC, was made of 3 m × 0.8 mm internal diameter (i.d.) Teflon (polytetrafluoroethylene, PTFE) tubing. The tubing connecting RV to the flow cell was 27 cm long, made of 0.5 mm i.d. PTFE tubing. All other tubing connections were made of 0.5 mm i.d. PTFE tubing and PTFE nuts and ferrules (Upchurch, Oak Harbor). An auxiliary peristaltic pump (not shown in Figure 1) was used to continuously draw off the excess of solution inside the glass three-electrode cell, as described previously by Abate et al.19 An LC 9A Shimadzu HPLC, equipped with an SPD 6 AV UV detector, and the LC Workstation Class-LC 10 software was used in all experiments for quantification of picloram. An SB C18 Zorbax-HP column (150 mm × 4.6 mm, 3.5 µm particles) connected to a C18 Phenomenex guard column was used. Sample injection was made with a rotary Rheodyne valve using a 20 µL sample loop. All reagents used in this work were of analytical grade and all working solutions were prepared in deionized water (Simplicity 185 system from Millipore coupled to an UV lamp). A stock
1000 µg mL-1 picloram was prepared dissolving the solid standard (Riedel-de Haën, purity > 97.4%, molar mass of 241.46 g mol-1) in ethanol. Working solutions were prepared by diluting this stock solution in distilled deionized water. The voltammetric experiments were done in medium of 0.10 mol L-1 H
2SO4 and 0.010 mol L-1 CaCl2.
Soil sample
The soil sample was collected at the experimental farm of the Escola Superior de Agricultura Luiz de Queiroz da Universidade de São Paulo (ESALQ-USP) in the Piracicaba municipality, São Paulo state, Brazil, in a 500 m2 area with no history of application of herbicides. Fifteen surface samples were collected at depths between 0 and 20 cm from four different points and mixed to form a composed sample. The soil was air-dried and gently ground with a pestle and mortar to pass through a 1.0 mm sieve. The sieved sample was further dried in a vacuum oven at 35 °C until it achieved a constant weight, a process that required approximately 48 h, and finally stored in a desiccator. The CHN composition was: 1.58 ± 0.04% C; 0.76 ± 0.04% H; 0.07 ± 0.01% N. Sand, silt and clay contents were 29, 18 and 53%, respectively. Kaolinite is the dominant clay in this soil, with some contributions of esquioxides.11
Adsorption experiments
The adsorption experiments were performed in the presence of 0.010 mol L-1 CaCl
2, according to
Figure 1. Sequential injection manifold to perform SI-SWV; C = carrier (0.10 mol L-1 H
2SO4); SV = syringe valve; SP = syringe pump;
HC = holding coil (made of 3 m of PTFE tubing of 0.8 mm internal diameter); RV = eight port rotary selection valve; S = sample reservoir; B = 0.20 mol L-1 H
2SO4; SD = 2.50 mg L-1 picloram standard solution (in
recommendations of the Institute for Reference Materials and Measurements20 and Organization for Economic Cooperation and Development.21 Dried soil (1.000 ± 0.001 g) was transferred to polypropylene centrifuge tubes (Corning) with a capacity of 15 mL. An aliquot of 50 µL of 1.0 mol L-1 CaCl2 was added to each tube, followed by a suitable volume of a 100 mg L-1 (241.46
µmol L-1) of picloram stock solution to provide initial picloram concentrations of 1.00, 2.00, 4.00, 6.00, 12.0, 25.0 and 50.0 mg L-1 after reaching the total solution volume of 5.00 mL with deionized water. All centrifuge tubes were sealed, protected from light and shaken in an orbital shaker with thermostat for 24 h at 25.0 ± 0.1 ºC. The contact time of 24 h was previously determined to allow the system to reach an apparent chemical equilibrium.22 After the contact time, the solid phases were allowed to decant and the supernatant solution was filtered through 0.45 µm cellulose acetate membranes. The filtrate (1.8 mL) was pipetted and properly conditioned for square wave voltammetry measurements in 0.10 moL-1 H
2SO4 and 0.01 mol L-1 CaCl
2 by addition of 0.2 mL of 1.0 mol L-1 H2SO4 in 0.01 mol L-1 CaCl
2.
Standards in soil extracts
To correct for matrix effects, calibration of the system was made in soil extracts prepared in the same medium used to perform the adsorption experiments. To prepare the standard solutions in the matrix solution, a mass of 10.0 g of soil was equilibrated with 49.50 mL of deionized water plus 0.50 mL of 1.0 mol L-1 CaCl
2. This extraction was performed for 24 h in an orbital shaker at 25.0 ± 0.1 °C. After extraction, the solid phases were allowed to decant and the supernatant solution was filtered through 0.45 µm cellulose acetate membranes. Standard solutions of picloram with concentrations 0.10, 0.25, 0.50, 1.0 and 2.0 mg L-1 were prepared by diluting suitable volumes of a 100.0 mg L-1 stock picloram solution (prepared in 0.20 mol L-1 H
2SO4 and 0.010 mol L-1 CaCl2) in 2.00 mL of the filtered soil extract, up to 4.00 mL with appropriate volumes of 0.20 mol L-1 H
2SO4 in 0.010 mol L-1 CaCl2.
Sequential injection procedures for determination of the free picloram concentrations employing SWV
The first step of the SI system was to fill HC and the electrochemical cell (Figure 1) with the carrier solution (0.10 mol L-1 H
2SO4 in 0.010 mol L-1 CaCl2). The tubing connecting the port 2 of RV was filled with standard or sample solutions (SD or S). To perform this calibration, picloram standard solutions with concentrations between 0.10 and 2.00 mg L-1 were prepared in volumetric flasks, in
0.1 mol L-1 H
2SO4 (in 0.010 mol L-1 CaCl2). The potentiostat and the SI programs were started simultaneously, and, in this case, the delay time to start the potential scanning was 19 s. During this time, with syringe valve (SV) at position “out” (Figure 1), the SI system aspirated 800 µL of carrier inside the syringe at a flow rate of 500 µL s-1. Next, with SV at position “in”, 100 µL of air and 500 µL of standard/ sample solution were sequentially aspirated to HC at 50 µL s-1 from ports 7 and 2 of RV, respectively. Then, RV switched to port 3 and syringe pump (SP) dispensed 400 µL of standard/sample toward the flow cell at 50 µL s-1, while the potentiostat scanned the potential from −0.5 to −1.0 V using the frequency of 300 Hz and pulse height of 25 mV. The excess of sample/standard solution and the air bubble were expelled from HC dispensing 500 µL through port 6 of RV. Finally, RV switched back to port 3 and SP emptied the syringe at 100 µL s-1 washing the system.
HPLC analysis
Experiments were made in isocratic elution mode with a mobile phase consisting of 50% (v/v) acetonitrile/water mixture, with the aqueous phase composed of 0.1% (m/v) H3PO4. Both solutions constituting the mobile phase were previously filtered through 0.45 µm PTFE membranes. Helium was used for degassing the mobile phase in all experiments. The analyses were performed at a flow rate of 1.2 mL min-1. The UV detector monitored the absorbance at 220 nm.
Data treatment
Sorption data were treated by the linearized Freundlich equation 1, where q is the concentration of the studied compound in the solid phase (mol kg-1), C is the solution concentration (µmol L-1) after a given contact time (24 h in the present study), and Kf and 1/nare the empirical constants related to sorption.
log(q) = logKf + 1/n logC (1)
Results and Discussion
peaks of picloram lost intensity in 0.010 mol L-1 CaCl 2 solutions from soil extracts compared to voltammetric peaks obtained in the same supporting electrolyte that had no contact with the soil (both conditioned in 0.10 mol L-1 H2SO4) (Figure 2). This fact is probably caused by a decrease in the effective area of the mercury drop available for reduction of picloram as a consequence of adsorption of compounds such as humic and fulvic acids present in the soil extract. Additionally, picloram may be adsorbed on humic substances and the aggregate may behave as an inert or slow diffusing complex, decreasing the peak current in relation to that observed for the same concentration, but in the absence of soil matrix components. To correct this matrix effect, the determinations of the herbicide were made with a calibration curve obtained in soil extract prepared in
the same proportion and composition of the samples, using the matrix-matched approach.
Adsorption studies
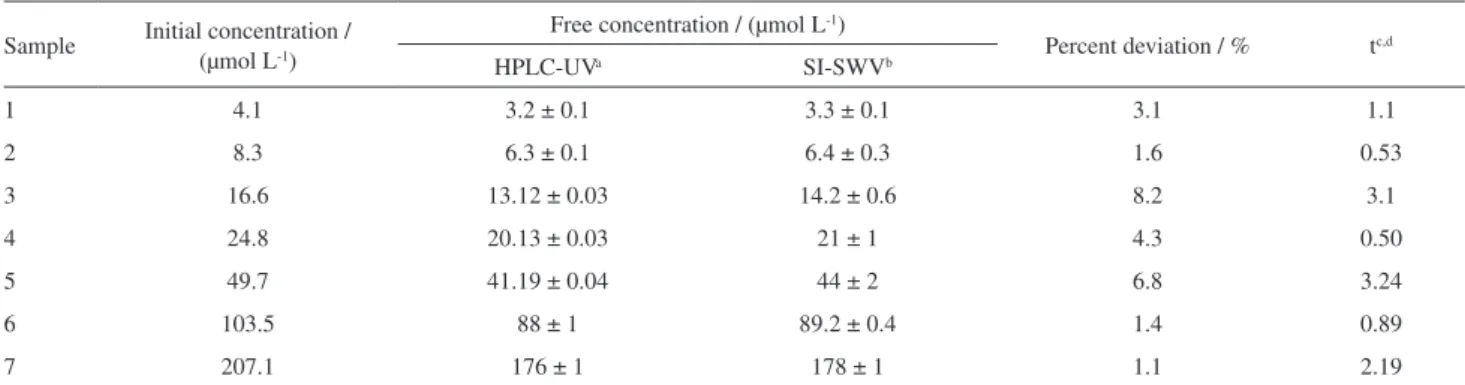
The determination of the free concentration of picloram in soil extract after the adsorption experiments was carried out in triplicate using SI-SWV and in duplicate by HPLC-UV. The results obtained by SI-SWV and HPLC-UV show that the HPLC-UV provided better precision and concentrations systematically lower than those obtained by SI-SWV (Table 1). To verify whether the differences in the obtained mean concentrations were statistically significant for each level of initial picloram concentration, the Welch’s t-test was applied assuming that neither variances nor sample sizes were equals.23 This t-test revealed that there was no evidence of systematic differences between the concentration values obtained by SI-SWV and by HPLC-UV with 95% confidence level.
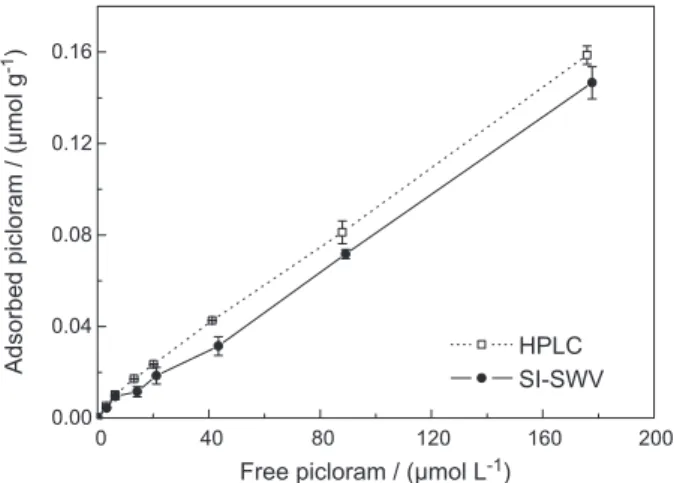
Figure 3 shows the adsorption isotherms obtained by the proposed SI-SWV method in comparison to the curves obtained by HPLC-UV. Adsorption data were represented mostly by a model of linear isotherm which was properly fitted to the Freundlich equation using linear regression analysis to calculate the Kf and 1/n values. Using the proposed SI-SWV the fitted values of Kf and 1/n were (1.6 ± 0.5) × 10-3 µmol1-1/n L1/n kg-1 and 0.85 ± 0.06 (r2 = 0.992), respectively. These values were comparable to those obtained by HPLC-UV, which were (2.0 ± 0.1) × 10-3
µmol1-1/n L1/n kg-1 and 0.83 ± 0.02, with r2 = 0.998. The t-test revealed that there is no evidence of systematic differences between the adsorption coefficients obtained by SI-SWV and HPLC. The 1/n
Table 1. Free concentrations of picloram found in the soil extracts by the proposed SI-SWV compared to those obtained by HPLC-UV after 24 h of contact time between the soil with the herbicide solution (soil to solution ratio of 200 mg mL-1)
Sample Initial concentration / (µmol L-1)
Free concentration / (µmol L-1)
Percent deviation / % tc,d
HPLC-UVa SI-SWVb
1 4.1 3.2 ± 0.1 3.3 ± 0.1 3.1 1.1
2 8.3 6.3 ± 0.1 6.4 ± 0.3 1.6 0.53
3 16.6 13.12 ± 0.03 14.2 ± 0.6 8.2 3.1
4 24.8 20.13 ± 0.03 21 ± 1 4.3 0.50
5 49.7 41.19 ± 0.04 44 ± 2 6.8 3.24
6 103.5 88 ± 1 89.2 ± 0.4 1.4 0.89
7 207.1 176 ± 1 178 ± 1 1.1 2.19
aHigh performance liquid chromatograph (HPLC) with UV detector; bsequential injection with square wave voltammetry(SI-SWV); ccomputed as
, where , with S being the standard deviation of the mean values; dcritical value of t for 2 degrees of
freedom at 95% confidence = 4.303.
-700 -800 -900 -1000 -1100
-1.5 -1.0 -0.5 0.0 0.5
0.50 mg L-1
picloram in 0.010 mol L-1
CaCl2soil extract
0.50 mg L-1
picloram in 0.010 mol L-1
CaCl2
I /
A
µ
E / mV
Figure 2. Sequential injection-square wave voltammograms of 0.50 mg L-1
picloram solutions in presence and absence of the soil matrix. Sample solutions (400 µL) conditioned in 0.20 mol L-1 H
2SO4 were measured by
coefficient obtained by SI-SWV and HPLC (0.85 and 0.83, respectively) suggests high energetic homogeneity of adsorption sites, and is in good agreement with the values between 0.76 and 0.92 found by Oliveira Jr. et al.6 for adsorption of picloram on another clay-rich soil.
As picloram (Figure 4) has a single carboxylic group with pKa 3.4,3 in soil colloids with pH between 5 and 8,6 the molecules of the pesticide are mostly ionized (negatively charged). Once the clay soil is a complex mixture formed by several clay minerals such as kaolinite, vermiculite and montmorillonite, which also have in their composition some groups which are negatively charged in aqueous media, low adsorption and high mobility of picloram are expected in many types of soil, as reported by Close et al.24 For instance, the K
f obtained for picloram (0.0016 ± 0.0005 µmol1-1/n L1/n kg-1) is lower than that of atrazine (Kf = 3.8 ± 0.2 µmol1-1/n L1/n kg-1)11 for the same soil sample. This low adsorption capacity is probably related to the fact that at pH around 6, at which both
experiments were performed, atrazine (pK = 1.7) is in its molecular form, whereas picloram (pK = 3.4) is mainly in the anionic form (Figure 4).25,26 The repulsion between the charged picloram and the groups of the same charge in the soil, accounts for the high mobility of the pesticide in the soil.
The major advantages of the proposed SI-SWV over HPLC-UV are the low consumption of reagent and the short time of analysis. The run time of an HPLC-UV determination is about 3.0 min, at a flow rate of 1.2 mL min-1 of 50% (v/v) acetonitrile:water mobile phase, implying a consumption of 1.8 mL of acetonitrile, in addition to the column conditioning time (ca. 30 min) before starting the serial analyses. On the other hand, the HPLC-UV method has better precision. If quantification can be made by external calibration using the matrix-matched standard solutions, the sampling throughput of the proposed SI-SWV method reaches 190 analyses per hour. The linear dynamic range was from 0.12 to 2.5 mg L-1 with limits of detection and quantification of 0.036 and 0.12 mg L-1, respectively. The limit of quantification is suitable for monitoring the maximum concentration level (MCL) of 0.5 mg L-1 recommended by Environmental Protection Agency (EPA) for drinking waters, so that the adsorption isotherms may be constructed using concentrations representative of most environmental conditions.The method is favored due to the advantages of the hanging mercury drop electrode, which allow one to use a fresh drop in each injection, overcoming passivation of the electrode surface as a consequence of adsorption effects. The use of a fresh electrode at each measurement, without the need for disassembling and re-assembling flow cells is an advantage of the hanging mercury electrode that has not yet been surpassed by new working electrodes such as boron-dopped diamond sensors and bismuth coated glassy carbon electrodes.27-30 Additionally, the used Hg may be easily recovered and reused in the electrode capillary, contrary to screen printed sensors that are discarded after some few analyses.
Conclusions
The proposed method can be used to determine the herbicide in 0.10 mol L-1 CaCl
2 soil extracts, enabling the construction of adsorption isotherms to be accomplished with short times of analyses (sampling throughput of 190 analyses per hour) and low consumption of reagents. The Freundlich adsorption coefficients obtained by the proposed method did not differ from the coefficients obtained by HPLC, a technique that is widely used to evaluate adsorption properties of herbicides in soil samples.
0 40 80 120 160 200
0.00 0.04 0.08 0.12 0.16
Adsorbed picloram / (µmol g
)
-1
Free picloram / (µmol L )-1
HPLC SI-SWV
Figure 3. Adsorption isotherm of picloram (25.0 ± 0.5 oC) obtained using
a soil to solution ratio of 200 mg mL-1. Initial concentrations of picloram
varied from 4.1 to 207 µmol L-1 (1.0 to 50 mg L-1).
Acknowledgements
Authors are grateful to CNPq and FAPESP for financial support and fellowships. The authors are also grateful to Prof Godofredo C. Vitti and Jonas D. Cuzzi (ESALQ-USP) for helping with the soil sampling. This work was funded by grants 475554/2009-4 and 304178/2009-8 from the Conselho Nacional de Desenvolvimento Científico e Tecnológico (CNPq). A post-doctoral fellowship from São Paulo Research Foundation (FAPESP) to Luciana B. O. dos Santos (2005/04286-0) is acknowledged.
References
1. Basic Information about Picloram in Drinking Water, http:// water.epa.gov/drink/contaminants/basicinformation/picloram. cfm, accessed in July 2015.
2. Meru, S.; Liber, K.; Stonefield, K.; Solomon, K.; Stephenson, G.;
Arch. Environ. Contam. Toxicol.1990, 19, 572.
3. Spadotto, C. A.; Hornsby, A. G.; J. Environ. Qual.2003, 32, 949.
4. Nearpass, D. C.; Soil Sci.1976, 121, 272. 5. Grover, R.; Weed Res.1968, 8, 226.
6. Oliveira Jr., R. S.; Alonso, D. G.; Koskinen, W. C.; Papiernik, S. K.; J. Environ. Sci. Health, Part B 2013,48, 1049. 7. Biggar, J. W.; Cheung, M. W.; Soil Sci. Soc. Am. J. 1973, 37,
863.
8. Farmer, W. J.; Aochi, Y.; Soil Sci. Soc. Am. J. 1974, 38, 418. 9. do Nascimento, F. H.; Masini, J. C.; Talanta2012, 100, 57. 10. Colombo, S. D.; Masini, J. C.; Microchem. J. 2011, 98, 260. 11. dos Santos, L. B. O.; Abate, G.; Masini, J. C.; Talanta 2005,
68, 165.
12. Yao, Y. Y.; Zhang, L.; Xu, J. K.; Wang, X. Q.; Duan, X. M.; Wen, Y. P.; J. Electroanal. Chem. 2014, 713, 1.
13. Amare, M.; Abicho, S.; Admassie, S.; J. AOAC Int.2014, 97, 580.
14. Inam, R.; Bilgin, C.; J. Appl. Electrochem.2013, 43, 425.
15. Pedrosa, V. A.; Caetano, J.; Machado, S. A. S.; Bertotti, M.;
Sensors2008, 8, 4600.
16. dos Santos, L. B. O.; Abate, G.; Masini, J. C.; J. Braz. Chem. Soc.2006, 17, 36.
17. Massaroppi, M. R. C.; Machado, S. A. S.; Avaca, L. A.; J. Braz.
Chem. Soc. 2003,14, 113.
18. dos Santos, L. B. O.; Masini, J. C.; Talanta2007, 72, 1023. 19. Abate, G.; Lichtig, J.; Masini, J. C.; Talanta2002, 58, 433. 20. Gawlik, B. M.; Lamberty, A.; Pauwels, J.; Muntau, H.; Anal.
Bioanal. Chem.2004, 378, 1284.
21. OECD Guidelines for the Testing of Chemicals, Section 1, http:// www.oecd-ilibrary.org/docserver/download/9710601e.pdf?exp ires=1416331662&id=id&accname=guest&checksum=78E4E 92A62E8B7EC25427CD37DF1F549 accessed in July 2015. 22. Abate, G.; Penteado, J. C.; Cuzzi, J. D.; Vitti, G. C.; Lichtig,
J.; Masini, J. C.; J. Agric. Food Chem. 2004, 52, 6747. 23. Miller, J. C.; Miller, J. N.; Statistics for Analytical Chemistry,
2nd ed.; Ellis Horwood Limited: Chichester, 1998.
24. Close, M. E.; Pang, L.; Watt, J. P. C.; Vincent, K. W.; Geoderma
1998, 84, 45.
25. Galvín, R. M.; Montoya, M. R.; Higuera, M. J.; Peréz, R.; Mellado, J. M. R.; Water, Air, Soil Pollut.2005, 165, 347. 26. Higuera, M. J.; Montoya, M. R.; Mellado, J. M. R.; Electrochem.
Commun. 1999, 1, 184.
27. Bandzuchova, L.; Svork, L.; Vojs, M.; Marton, M.; Michniak, P.; Chylkova, J.; Int. J. Environ. Anal. Chem. 2014, 94, 943. 28. Bandzuchova, L.; Svork, L.; Schor, J.; Svitkova, J.; Chylkova, J.;
Electrochim. Acta 2013, 111, 242.
29. Mellado, J. M. R.; Pintado, S.; Montoya, M. R.; Helv. Chim. Acta2008, 91, 1443.
30. Figueiredo, L. C.; Azzi, D. C.; Janegetz, B. C.; Fatibello, O.;
Electroanalysis2012, 24, 303.
Submitted: May 28, 2015
Published online: July 28, 2015