Pedro Tomás Martins Silva
BSc. Biology
Comparative Analysis of Locomotor Behavior
and Descending Motor System Anatomy
of Larval Zebrafish and Giant Danio
Dissertation submitted in partial fulfillment of the requirements for the degree of
Master of Science in
Molecular Genetics and Biomedicine
Adviser: Michael Brian Orger, Principal Investigator, Champalimaud Foundation
Co-adviser: Adrien Paul Roger Jouary, Postdoctoral Researcher, Champalimaud Foundation
Examination Committee
Chairperson: Dr. Margarida Casal Ribeiro Castro Caldas Braga Raporteur: Dr. André Guilherme Vilhena Valente Rodrigues da Silva
Members: Dr. Michael Brian Orger Dr. Adrien Paul Roger Jouary
Comparative Analysis of Locomotor Behavior and Descending Motor System Anatomy of Larval Zebrafish and Giant Danio
Copyright © Pedro Tomás Martins Silva, Faculty of Sciences and Technology, NOVA Uni-versity Lisbon.
The Faculty of Sciences and Technology and the NOVA University Lisbon have the right, perpetual and without geographical boundaries, to file and publish this dissertation through printed copies reproduced on paper or on digital form, or by any other means known or that may be invented, and to disseminate through scientific repositories and admit its copying and distribution for non-commercial, educational or research purposes, as long as credit is given to the author and editor.
Ac k n o w l e d g e m e n t s
It was a pleasure and an honor to be part of the Champalimaud Research community for a full year. I want to thank Michael Orger, principal investigator of the Vision to Action Lab, for accepting me as a member of his lab and giving me the opportunity to develop such a challenging and ambitious project.
I wish to express my highest respect and gratitude to Adrien Jouary, Postdoctoral Researcher in the Vision to Action Lab, for all the support, guidance, and the constant teaching about the intricacies of behavioral neuroscience and Zebrafish. Most of what was achieved was thanks to him.
To all the other Vision to Action Lab members, thank you for everything.
A special thanks goes to the Fish Facility, whose members were tireless, always helping me with my requests. Another special thanks goes to the ABBE Facility, for helping me with the confocal imaging.
QuimTó provided hillarious laughs and random clowning, essential for a healthy mind.
Another special thanks goes for my bachelor’s chemistry teacher, Ana Seca, for unend-ing support since the first class she ever gave me.
Last but not least, thanks to my family for the support.
I wish I could have gone fishing more than I went. Fishing is the BEST! NEVER STOP FISHING!
Behavior set-ups were custom built by Adrien Jouary, with my help and always under his careful guidance.
Behavioral data analysis was done with the help of Adrien Jouary and Michael Orger. Immunohistochemistry stainings were done with the help and guidance of Bernardo Esteves.
Image analysis and image registration was done with the help of Aaron Ostrovsky. The entire pipeline for achieving the brain template was devised by Aaron.
Backfills of reticulospinal neurons were done with help and guidance of Jens Bierfeld. Head-restrained experiments were done with the help of Rita Félix and Elena Hindinger. Alexandre Laborde, Adrien Jouary and Michael Orger provided the much needed coding support.
A b s t r a c t
A major challenge for comparative biology is understanding what aspects of an animal’s locomotor repertoire represent general features of motor organization, versus specialized adaptations for its anatomy and ecological niche. In this thesis I investigate the Giant Danio larvae (Devario aequipinnatus) as a potential model for comparative studies with Zebrafish, a well-established animal model in neuroscience. To this end, I study the lo-comotor behavior of both species and how its differences are reflected in the underlying neural circuit structure. Initially, I compare the anatomy of the descending pathways controlling locomotion in Giant Danio to Zebrafish using retrograde labelling of reticu-lospinal neurons. I see a striking resemblance of the circuit in both species, with a roughly similar organization and the general division and number of cell clusters being very well conserved. Following, I compare visually guided behaviours in Giant Danio to differ-ent Zebrafish strains. Giant Danio show a stronger optomotor response than Zebrafish. The optomotor response of Giant Danio first appear around 4 days post fertilization and can be consistently and reliably evoked. During optomotor tracking Giant Danio show shorter interbout intervals and are able to track motion at higher speeds than Zebrafish. I also observe that the higher manoeuvrability of Giant Danio is also reflected during prey capture. Interestingly, Zebrafish strains derived from more recently wild-caught fish show more robust optomotor behaviour, closer to Giant Danio. Lastly, I demonstrate the suitability of using Giant Danio in a head-restrained preparation with a 3D virtual reality environment.
Combined with the potential for comparative approaches with Zebrafish, the faster development, larger neurons, and the rich behavioural repertoire of Giant Danio make it a promising model for neuroscience.
Keywords: Giant Danio; Zebrafish; Behavior; Reticulospinal neurons; Comparative ap-proach
R e s u m o
Um grande desafio para a biologia comparativa é compreender que aspetos do reportório locomotor de um animal representam características gerais de organização motora ou adaptações especializadas para a sua anatomia e nicho ecológico. Neste trabalho, inves-tiguei se o peixe Devario aequipinnatus (D. aequipinnatus) é um potencial modelo para estudos comparativos com o Peixe-zebra, um modelo bem estabelecido em neurociência. Para tal, comparei o comportamento locomotor e a estrutura neural subjacente das duas espécies, começando por estudar a anatomia das vias neurais descendentes que contro-lam a locomoção no D. aequipinnatus, usando uma marcação retrógrada de neurónios reticuloespinais. Verifiquei uma grande semelhança do circuito em ambas as espécies, tanto quanto à organização, como à divisão geral e número de aglomerados de células. Seguidamente, comparei comportamentos mediados pela visão noD. aequipinnatus com o de diferentes linhas de Peixe-zebra. OD. aequipinnatus mostrou uma resposta optomotora mais robusta do que o Peixe-zebra. Em relação à resposta optomotora do D. aequipinna-tus, esta aparece aos 4 dias pós-fertilização e é provocada de forma consistente e confiável. No geral, a natação doD. aequipinnatus apresenta intervalos curtos entre cada movimento da cauda que lhe permitem seguir padrões de estimulação a velocidades mais elevadas que o Peixe-zebra. Observei também que a maior manobrabilidade doD. aequipinnatus se refletia durante o comportamento predatório. Linhas de Peixe-zebra derivadas de peixes capturados mais recentemente no seu habitat natural e, como tal, mais selvagens, mos-traram maior robustez no comportamento optomotor, sendo a sua resposta optomotora mais parecida com a doD. aequipinnatus. Por fim, demonstrei que o D. aequipinnatus se adequa a utilização em experiências com preparações onde a cabeça é fixa e o peixe é colocado num ambiente tridimensional de realidade virtual.
Combinando o seu potencial para abordagens comparativas com Peixe-zebra, ao seu desenvolvimento mais rápido, neurónios maiores e um reportório comportamental rico, oD. aequipinnatus apresenta-se como um modelo promissor para a neurociência.
Palavras-chave: Devario aequipinnatus; Peixe-zebra; Comportamento; Neurónios reticu-loespinais; Biologia comparativa
C o n t e n t s
List of Figures xiii
1 Introduction 1
1.1 Comparative Approach in Neuroscience . . . 1
1.2 Fish in Neuroscience . . . 2
1.3 Zebrafish as a Model Organism . . . 3
1.4 Visually Evoked Behaviors in Larval Zebrafish. . . 5
1.5 Larval Zebrafish Locomotor Repertoire . . . 7
1.6 The Giant Danio . . . 9
1.7 Objectives . . . 10
2 Methods 13 2.1 Experimental Models Rearing Conditions and Subject Details . . . 13
2.2 Fish growth. . . 14
2.3 Retrograde Labeling of Reticulospinal Neurons in Giant Danio . . . 15
2.4 tERK immunohistochemistry staining . . . 15
2.5 Confocal Microscopy . . . 16
2.6 Image Analysis . . . 16
2.7 Behavioral set-ups . . . 17
2.7.1 Low-Resolution Behavior set-up . . . 17
2.7.2 High-Resolution Behavior set-up . . . 18
2.7.3 Head-Restrained Behavior set-up . . . 19
2.8 Behavioral Assays . . . 20
2.8.1 Circular Optomotor Response . . . 20
2.8.2 Virtual Open Loop Optomotor Response . . . 21
2.8.3 Prey Capture. . . 23
2.8.4 Head-Restrained Closed Loop Virtual Reality Optomotor Response 23 2.9 Behavior Analysis . . . 24
2.9.1 Circular Optomotor Response . . . 24
2.9.2 Virtual Open Loop Optomotor Response . . . 25
2.9.3 Prey Capture. . . 25
C O N T E N T S
2.10 Fish Tracking, Tail Segmentation and Bout Detection . . . 26
3 Results 29 3.1 Anatomy . . . 29
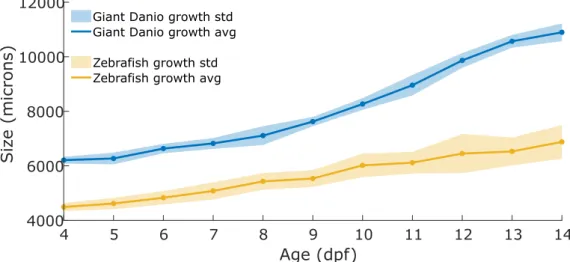
3.1.1 Growth throughout development . . . 29
3.1.2 One for All – The Brain Template . . . 30
3.1.3 Anatomy of spinal projection neurons . . . 33
3.2 Behavior . . . 38
3.2.1 Optomotor Response . . . 38
3.2.2 Virtual Open Loop Optomotor Response . . . 43
3.2.3 Prey Capture. . . 45
3.2.4 Head-Restrained Closed Loop Virtual Reality Optomotor Response 47 4 Discussion 51 4.1 Anatomy . . . 52 4.1.1 Growth . . . 52 4.1.2 Brain Template . . . 53 4.1.3 Backfills . . . 54 4.2 Behavior . . . 57 4.2.1 Optomotor Response . . . 57 4.2.2 Swimming Kinematics . . . 60 4.2.3 Prey Capture. . . 61
4.2.4 Head-Restrained in Virtual Reality . . . 63
5 Conclusions 65 6 Future Perspectives 69 6.1 Brain Template. . . 69
6.2 Reticulospinal neurons . . . 69
6.3 Behavior . . . 70
6.4 The Giant Danio Locomotor Repertoire . . . 70
6.5 The Giant Danio and Neuroscience . . . 71
Bibliography 73 I Annex I 87 I.1 Supplementary figures . . . 87
I.2 Suplementary Code . . . 89
II Annex II 91 II.1 Current outcomes of the work presented . . . 91
L i s t o f F i g u r e s
1.1 Zebrafish as a standard model organism . . . 3
1.2 Phylogenetic tree and comparative analysis of the brain of major model species 4 1.3 Zebrafish larvae swim bout . . . 8
1.4 Stereotypical Zebrafish swim bouts . . . 9
1.5 Giant Danio, a potential model organism for neuroscience . . . 10
2.1 Injections for labelling the reticulospinal neurons . . . 15
2.2 Brain Registration Process . . . 17
2.3 Set-up for behavioral experiments . . . 18
2.4 Larvae head-restrained preparation . . . 19
2.5 Head-restrained set-up . . . 20
2.6 Circular Optomotor response (OMR) visual stimuli . . . 21
2.7 Virtual Open Loop Optomotor Response assay visual stimuli directions . . . 22
2.8 Virtual Open Loop stimulation . . . 22
2.9 Head-Restrained Closed Loop . . . 23
2.10 Steps of tail tracking algorithm . . . 27
3.1 Growth throughout development . . . 30
3.2 total ERK (tERK) Giant Danio reference brain . . . 31
3.3 Registration Precision . . . 31
3.4 Registration variability . . . 32
3.5 Giant Danio backfill max intensity z-projection . . . 34
3.6 Onset of OMR in Giant Danio and Zebrafish larvae . . . 39
3.7 Average swimming speed of Giant Danio and Zebrafish larvae at each stimuli speed for every age . . . 39
3.8 Behavioral tracking state . . . 40
3.9 Behavioral non-tracking state . . . 41
3.10 Giant Danio and Zebrafish larvae tracking capacity . . . 42
3.11 Giant Danio and Zebrafish larvae bout traces . . . 44
3.12 Giant Danio and Zebrafish larvae interbout interval . . . 44
3.13 Giant Danio and Zebrafish larvae bout duration . . . 45
3.14 Average cumulative number of rotifers eaten per fish . . . 46
L i s t o f F i g u r e s
3.16 Head-restrained Giant Danio larvae intended speed . . . 47
3.17 Head-restrained tail end bend angle trace . . . 48
3.18 Head-restrained sequence of three stimulation trials . . . 49
I.1 Growth measurements arena. . . 87
I.2 Circular OMR arena . . . 88
I.3 Concave arenas used in the high-resolution behavior set-up . . . 88
I.4 Head-restrained arena . . . 88
I.5 Prey Capture arena . . . 89
I.6 MATLAB script used for Growth Measurements. . . 89
Ac r o n y m s
AF Arborization fields.
BSA Bovine serum albumin.
CMTK Computational Morphometry Toolkit. CNS central nervous system.
CV Coefficient of variation. DMSO Dimethyl sulfoxide. dpf days post fertilization.
EDTA Ethylenediaminetetraacetic acid.
FPS Frames per second.
HD High Definition.
IBI interbout interval. ICI intercapture interval.
IR infra-red.
ISI interstimulus interval. LED Light-emitting diode.
AC R O N Y M S
llf lateral longitudinal fasciculus. M-cell Mauthner cell.
mlf medial longitudinal fasciculus.
MW Molecular Weight.
NGS normal goat serum.
nMLF nucleus of the Medial Longitudinal Fasciculus. OKR Optokinetic response.
OMR Optomotor response.
PBT Phosphate buffer solution with 0.25 % Triton. PTU 1-phenyl 2-thiourea.
RGC Retinal ganglion cell.
Ro rhombomere.
SEM Standard error of the mean. STD Standard deviation.
tERK total ERK.
Tu Tübingen.
ZBB Zebrafish Brain Browser.
C
h
a
p
t
e
r
1
I n t r o d u c t i o n
In this chapter I address fundamental aspects of this work. First, the importance of a comparative approach in neuroscience is detailed. This approach can expand our capacity to fully understand the significance of results in research. Next, an overview of the most common fish model organisms used in neuroscience is made, later focusing in the Zebrafish. Special attention is given to its visually evoked behaviors and locomotor repertoire. Finally, Giant Danio is introduced and the main goals and workflow of this project are described.
1.1
Comparative Approach in Neuroscience
When studying the neural basis of behavior, the traditional neuroethological approach was to identify the organism most suited to address the biological question of interest [1]. Usually this was an organism highly specialized in a particular task, for example, the study of prey localization in the barn owl [2], or auditory timing in the bat [3]. Such way of conducting research brought foundational discoveries upon neuroscience throughout the years [4]. For instance,Aplysia was used to study the learning and memory because of the easily identifiable and accessible neurons that mediate these behaviors [5], or the lamprey, which was used to study basic neural circuits that coordinate the generation of different patterns of motor behavior, known as central pattern generators [6].
With the advent of the genomic revolution there has been a clear convergence in the animal models used; the vast majority of neuroscience now focuses on what are now known as "standard model organisms"[4,7]. These standard model organisms were orig-inally chosen for their low maintenance costs and their breeding patterns, which were important for fields such as genetics and developmental biology, instead of being chosen for any specific behavioral trait or specialized function [8,9]. The benefits of this led to
C H A P T E R 1 . I N T R O D U C T I O N
the rapid development of a wide range of tools that facilitate a detailed interrogation of neural circuits [4,7]. But by converging on standard model species, it may not be feasible to address the diversity of mechanistic and functional adaptations present in even closely related species that may differ behaviorally [10]. Additionally, the generalization of sci-entific findings, derived from a set of standard model organisms, will require replication of the results beyond those species. And so, in the absence of comparative studies that harness comparative data,“an entire field may be lead astray by observations that are either species specific or misinterpreted” [4].
One of the longstanding goals in neuroscience has been to identify generalizable mech-anisms that may shed light on functions and dysfunctions of the brain. On top of that, studying familiar functions across a diverse set of relevant species is a core concept of the comparative approach that could be embraced in order to achieve such generalizable mechanisms [7, 11]. Comparative studies are useful not just because of the potential diversity of behaviors that could be studied, but also because they allow us to discover what aspects of the system are fundamental, what is consistent across species versus spe-cialized adaptations [12]. A good example of this is the jamming avoidance response in the electric fish Eigenmannia sp. and Gymnarchus sp. [13], which evolved their electric sense independently, but the neural circuits where the amplitude and phase information coding neurons lie turned out to have the same functional cell types and computations, even though in some cases they are localized in different brain areas; the jamming avoid-ance response consists on the modulation of the frequency of the produced electric signal, in order to avoid interference, leading to electrolocation inhibition, with another electric field produced by other fish. Besides allowing for the discovery of novel adaptations, with potentially bigger impact, the comparative approach also brings forth relevance when comparing systems across models of different complexity, and validity of major scientific statements made from standard model organisms [7,10,12,14]. Additionally, the neuro-science community would benefit from the interplay between standard and nonstandard model organisms [4,7]. Finally, for as many studies that use standard model organisms with great results achieved, resorting to a comparative approach could improve even further our capacity to fully understand the significance of the results.
1.2
Fish in Neuroscience
The most diverse class of vertebrates on Earth is the fish. Despite this diversity, and al-though there are increasing numbers of works done with fish, particularly with Zebrafish, fish still remain a largely untapped resource for comparative analyses of neural circuits and behavior, with the potential to bring new insights to questions about how the brain of vertebrates functions [12]. Considering the practical advantages that come with them – high throughput, fertility, developmental speed, amenability to genetic manipulations and relative simplicity of the nervous system – they did not go unnoticed in neuroscience. Studying fish also brought the opportunity to compare functions of neurological systems
1 . 3 . Z E B R A F I S H A S A M O D E L O R G A N I S M
in multiple lab strains [15].
The majority of the studies done with fish have been done on adult fish, and although the methods that exist now are amenable to larval fish, relatively little, outside of Ze-brafish, is known regarding larval fish. In neuroscience, different fish models seemingly show up every day and are used for a variety of different questions. This diversity in model organisms provide rich research territories for those that are willing to go off the boundaries of the standard models and risk larger workloads for the chance of novel outcomes.
Here, I will discuss the fish models that are most used in neuroscience research. Besides Zebrafish, some common fish used in neuroscience are the Medaka (Oryzias latipes), Danionella (Danionella translucida) Three-spined Stickleback (Gasterosteus ac-uleatus), Tilapia (Astatotilapia burtoni), Mexican Cavefish (Astianax mexicanus) and the Goldfish (Carassius auratus). Medaka has been an important model for understanding the oculomotor function as well as neurotransmitter systems [16, 17]. Danionella is a highly promising emerging model; it owns the smallest known adult vertebrate brain and is transparent even as an adult making it especially useful for investigating vertebrate neural connectivity, brain function and behavior repertoire [18]. The Three-spined Stick-leback has had major applications in behavioral neuroscience with regard to studying behavioral syndromes such as aggression-boldness [19,20]. Studies on Tilapia are largely focused on behavioral neuroscience, in particular social hierarchy, social interactions, and aggression aspects of behavior, and just like Medaka, for understanding neurotransmitter systems [21, 22]. The Mexican Cavefish, also known as Mexican Tetra, has also been a model for behavioral neuroscience, where it was used to model neural bases of multiple behavioral changes, social behavior, and aggressiveness [23,24]. Lastly, the Goldfish is one of the most used models. Goldfish have seen wide use as a model organism for both behavior – aversive conditioning, anxiety, fear and stress – as well as unravelling the retinal projections and neurotransmitter systems [15,25,26].
1.3
Zebrafish as a Model Organism
Figure 1.1: Left: Adult Zebrafish, Adapted from: Hines-UW, S (2014, November 12). Tim-ing can take the stripes off a zebrafish. Retrieved from https://www.futurity.org/wp/wp-content/uploads/2014/11/zebrafish_1170.jpg ; Right: 4dpfTu Zebrafish larva.
C H A P T E R 1 . I N T R O D U C T I O N
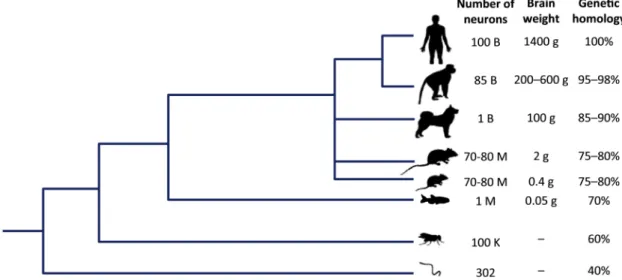
Zebrafish (fig.1.1),Danio rerio, is a small danionin (designation given to fish belong-ing to the danio and devario clades) teleost fish from the cyprinid subfamily Danioninae (Teleostei: Ostariophysi: Cypriniformes). Native to the streams of South-eastern Hi-malayan region [27], Zebrafish are pelagic and accustomed to living in slow-moving waters from rice paddies and slower reaches of streams, to rivers and lakes [28]. Because this small fish is easy to maintain in the laboratory, has low maintenance costs, low space requirements, a fast generation time and rapid reproductive cycle, produces clutches with over 100 embryos per mating pair with external development, and larvae transparency, it has been used for developmental and genetic studies since the late 1950s in a cost-efficient manner [29,30]. By the 1980s, Zebrafish was already used as a genetically tractable or-ganism [31–33]. Although Zebrafish stands far, phylogenetically, from humans (fig. 1.2), this species still shares 70% homology with human genes and have 10660 genes in com-mon with chicken, mouse and human [34,35]. Moreover, Zebrafish have a similar basic structure ofcentral nervous system (CNS)morphology to other vertebrates, with all the major domains that are found in the mammalian brain. Additionally, its larval stages offer an unprecedented optical access to theirCNS[35–38].
Figure 1.2: Although phylogenetically distant from humans, Zebrafish still shares 70% homology with human genes. Furthermore, its reduced brain size allows unprecedented optical access to theirCNSin larval stages, while maintaining a similar basic structure of theCNS. Adapted from Stewart et al., 2014 [35].
Nowadays, with the most recent technical developments, including the ability to make precise genetic manipulations [39–41], the Zebrafish became an important tool for trans-lational research [42]. The availability of large libraries of mutant and transgenic fish allow researchers to target specific cell types or provide vertebrate models of human neurological, neurodevelopmental and neurodegenerative diseases such as Alzheimer’s, Parkinson’s, epilepsy or autism [35, 38, 43–46]. Furthermore, larval Zebrafish, owing to their small brain size and optical transparency providing access to the CNS, has be-come an attractive model for optical imaging of brain development and function [47,48]. Coupled with state-of-the-art optical imaging methods and optogenetic tools, Zebrafish
1 . 4 . V I S UA L LY E V O K E D B E H AV I O R S I N L A RVA L Z E B R A F I S H
is growing as a vertebrate model for systems neuroscience as well. Some of the tech-niques that have been recently used include Two-Photon Scanning Microscopy, Selective Plane Illumination Microscopy, and Light-Field Microscopy. These approaches can si-multaneously monitor brain activity over large regions, potentially even the whole-brain dynamics [49].
The currently available microscopy techniques, complemented by the continuously growing and extensive genetic modifications toolbox possible in Zebrafish, provide ways of reporting neuronal activity or directly controlling that activity with light. Optogenetic actuators such as channelrhodopsin induce or suppress neuronal activity in response to light, and upon expression in Zebrafish neurons, allow researchers to probe the causal role of neuronal activity in selected populations of neurons [50]. Similarly, optogenetic reporters such as GCaMP, a genetically encoded calcium indicator that changes its flu-orescence properties in response to the binding of Ca2+, can be expressed in selected populations of neurons in the fish’s brain. Neurons fire action potentials, this opens voltage gated calcium channels that lead to large influx of Ca2+into the cells. GCaMP’s fluorescence increase upon calcium binding allows one to visually capture neuronal ac-tivity through the fluorescence changes in selected populations of neurons [51].
In contrast to other animal models such as mice or rat, these manipulations are per-formed in a non-invasive fashion, without the need for surgery or anesthesia, requiring only the larva to be head-restrained in agarose, leaving the eyes and the tail free to move [30]. Ultimately, the small size of the brain in comparison to the field of view of avail-able imaging methods and optical accessibility paired with the ability to simultaneously monitor sensory and motor areas in the behaving larvae make Zebrafish an ideal model for the holistic approach on how the brain generates behavior [48]. From an ethological point of view, the zebrafish shows more advantages as an animal model to study behavior related questions. Those advantages are best seen in the larva’s visually driven behaviors, as described in the next section.
1.4
Visually Evoked Behaviors in Larval Zebrafish
The visual system develops extraordinarily fast in the Zebrafish embryo. Considering the external embryonic development, there is a strong evolutionary pressure for rapid development of functional sensory systems [52]. In particular, vision is critical to their survival, allowing them to feed, navigate and avoid predators [53]. Innate visually guided behaviors begin to appear at just 3 days post fertilization (dpf), afterRetinal ganglion
cell (RGC)axons reach and innervate the tectal neuropil [54, 55]. These behaviors can
be: phototaxis; two responses to visual motion, theOptokinetic response (OKR)and the
OMR, where in the first they move their eyes and in the second they swim to follow a motion pattern; a visual startle response, prey capture and visually evoked escape.
Phototaxis represents one of the simplest forms of taxis behavior. In phototaxis, a fish will try to reach a desired location on the environment, according to the incidence
C H A P T E R 1 . I N T R O D U C T I O N
of light. Zebrafish larvae older than 3 dpfshow phototactic behavior [52], seeking out lighter areas by adjusting their swimming behavior according to light variation and based on temporal and spatial cues [56–58]. Moreover, this phototactic response illustrates how a complex behavior transpires from simple behavioral rules. This phototactic behavior can be reproduced by a simple model in which the retinal OFF pathway, sensitive to the decay in lighting deploys contralateral turns and drives turning away from the darker side, and the ON pathway, active following an increase in light intensity and controlling the rate of approach by activating forward swims, stimulates approach [59].
TheOKRfirst appears at 3dpf[55] when a focused image can first be formed on the retina and the extraocular muscles have finished adopting their adult configuration, and persists throughout adulthood. Additionally, only at 3dpfall 10RGC Arborization fields (AF)are first innervated [60].OKRis evoked by whole-field motion patterns, which give the perception of motion to the fish relative to fixed landmarks [54]. It is a robust visual stabilization behavior based on stereotyped tracking eye movements that are elicited when objects move across the visual field in order to reduce retinal image motion and thus obtain visual stabilization. It consists mainly of two components: a smooth pursuit (slow eye movements) followed by a fast saccade which resets the eyes once the object has left the visual field [55]. Also, theOKRrequires circuits distributed throughout the brain involving connections from optic flow sensitive neurons in the pretectum to motor neurons controlling the eye muscles [61]. Due to its reliability, and the fact that larvae will perform it even when fully immobilized, theOKRis one of the more widely studied behaviors in zebrafish [62].
In larval Zebrafish, theOMRis present as early as 5dpf, when the retina has devel-oped enough to further support this behavior which requires the ability to see a pattern [52], and is maintained in adulthood [63]. Just like theOKR, theOMR is a visual sta-bilization behavior in response to whole-field motion, but in this case the fish will turn and swim in the direction of the perceived motion [64]. When presented with moving stimuli, Zebrafish larvae were seen to be able to adjust their average speed to match the stimulus [65], and even adapt their response gain based on visual feedback [49,66]. The
OMRconsists of a set of basic motor components tuned to motion direction: the fish will perform forward swims driven by forward motion and turns driven by lateral movement [67]. Furthermore, it relies on contralateral relay of information from theRGCs to an arborization field in the pretectum, and from there ipsilaterally to reticulospinal neurons (which relay information form the brain to the spinal cord), in particular thenucleus of
the Medial Longitudinal Fasciculus (nMLF), which in turn send direct motor response to
the spinal cord through descending glutamatergic inputs [65,68].
As in the OMR, in larval Zebrafish hunting and feeding starts at 5 dpf, when the retina has developed enough to support this behavior (allowing visual recognition) and their yolk supply has been mostly depleted [52]. Prey capture is a critical behavior for survival that relies on a complex sequence of movements. Initially, larvae have to do visual recognition of the prey. Following this recognition, two distinct phases take place
1 . 5 . L A RVA L Z E B R A F I S H L O C O M O T O R R E P E R T O I R E
in prey capture behavior: an initial orientation and approach phase, during which the larva converges its eyes and maneuvers, through slow swims and J-turns (see Zebrafish Locomotor Repertoire section), in order to fit the prey into the newly formed binocular zone, and a capture phase, where a capture-swim is triggered once the prey is positioned at a correct location in front of the fish [69–71]. During prey capture, neurons inAF7 receive input fromRGCs and project to the optic tectum,nMLFand the hindbrain [72]. Although in later larval stages larvae may use other sensory inputs to hunt [73], in early stages larvae mostly rely on vision to capture prey, as demonstrated by the dramatic decrease in the number of prey eaten in the dark [74].
The visual startle response has been described as first appearing around 3dpf, when the larva is presented with sudden changes in illumination [54]. This response consists of an abrupt movement, often from a large angle turn, triggered from a change in the stimulus – illumination changes (i.e if it is changes in light intensity, or a dark flash) [57]. Turns evoked by light are kinematically indistinguishable from routine turns (see Zebrafish Locomotor Repertoire section), while those evoked by dark flashes appear to form a O-bend (see Zebrafish Locomotor Repertoire section) which was shown not to require theMauthner cell (M-cell), distinguishing this response from the faster C-bend escape responses [62].
Visually evoked escape, in Zebrafish larvae, is an escape response to what, in a nat-ural environment, would be a predator or any larger fish or object closing in that could represent a threat. This behavior can be elicited in a stereotyped manner with a loom-ing stimulus, normally an expandloom-ing dark dot in a bright background [75–79] projected from below [76] or from the side [78]. This escape response is evoked when the stimulus has neared the fish to a point that it creates a “critical visual angle”, with a fixed lag or waiting period, in relation to the looming stimulus critical visual angle [75, 76]. The escape motor circuits, based on theM-celland its homologs, are then stimulated by tectal neurons capable of relaying information regarding the critical visual angle [76]. In terms of kinematics, the Zebrafish larvae performs a fast C-bend [78], characteristic of escape responses [62].
Through the presentation of different sets of stimuli, projected below, laterally or in 3D environments, these behaviors can be elicited in both freely swimming and head-restrained Zebrafish larvae. In those conditions, a reproducible set of larval swim types (locomotor repertoire) has already been identified and characterized [79]. That locomotor repertoire will be discussed more fully below.
1.5
Larval Zebrafish Locomotor Repertoire
Zebrafish larvae propel themselves through patterns of body undulations consisting largely of the curvature of the tail – tail oscillation – in the horizontal plane. In ad-dition, the larva aids its swimming using rotations of the eyes and movements of the two pectoral fins. Freely swimming Zebrafish navigate in 3D environments, express their
C H A P T E R 1 . I N T R O D U C T I O N
behavior throughout the whole water column. But with Zebrafish larvae, experimentally reducing their behavior into a 2D plane, by confining them into shallow waters, allows for behavior to be easily recorded with a single camera without any stereoscopic vision tools.
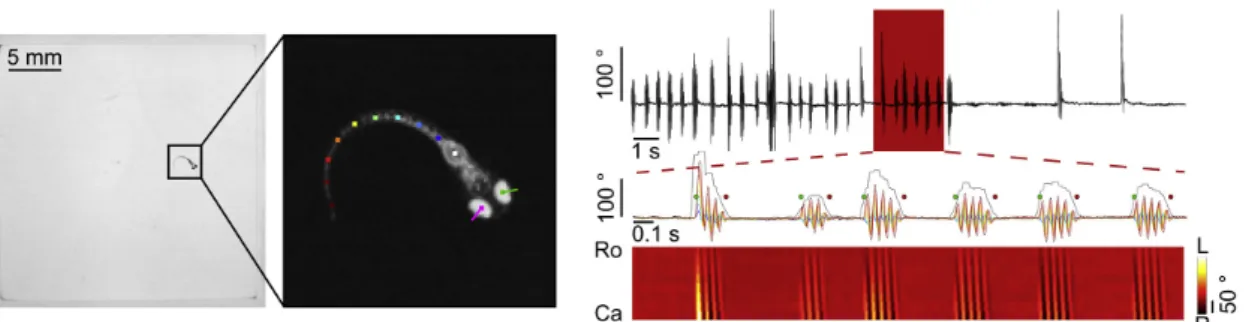
Figure 1.3: Zebrafish larvae locomotion can be divided into single events, the swim bouts, characterized by short bursts of tail movement that propel the larvae, followed by interbout periods where larvae move passively through the water. Left: Tracking of position, eyes and tail of Zebrafish larva. In order to be able to detect the bouts, it is necessary to track the larva; Right: Detection of the swim bouts from a tail end angle trace. Adapted from Marques et al., 2018 [79].
Once the larva has been confined to a movement in a single 2D plane, its movements can be segmented into elementary and discrete units that proceed through time. Zebrafish larva swim in a "burst and glide"fashion, characterized by swimming in short bursts of tail movement that propel the larvae, called swim bouts (fig. 1.3), followed by interbout periods where the larvae moves passively through the water [79]. These swim bouts can last between 80 to 400 milliseconds, with beat frequencies between 30 and 100 Hz [81]. Bouts follow an organization in sequence that enables larvae to carry out goals at longer timescales, including exploration of the environment [82] or precise control of speed [65]. And so, thanks to this discrete nature of locomotion, the quantification of behavior is greatly facilitated [83].
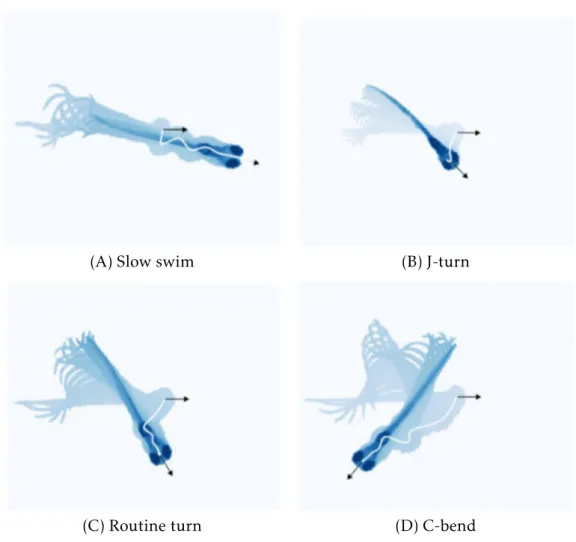
From 3dpfto 4dpf, Zebrafish larva go through a developmental switch, where their bouts change from isolated and long immature locomotor patterns, to shorter and more mature locomotor patterns with a short interval in between them [84] that allows the fish to sustain an active freely swimming behavior. Zebrafish larvae as young as five days post-fertilization already exhibit a rich repertoire of innate behaviors that enable them to explore the world [85,86]. Observing the examples in Figure1.4: (A) larvae can maintain their position in a changing environment with slow swims [64, 65]; (B) they can capture prey [69, 71]; (C) they avoid other larvae [79]; (D) and they escape from threatening stimuli [57,76,87,88]. Furthermore, a total of 13 different bout types have
been recently identified and characterized, acquired across a wide range of stimuli and related to different behaviors [79]. This rich behavior repertoire makes zebrafish larvae an attractive model organism to study in laboratory conditions.
1 . 6 . T H E G I A N T DA N I O
(A) Slow swim (B) J-turn
(C) Routine turn (D) C-bend
Figure 1.4: Example of a Zebrafish larva stereotyped swim bouts by super-imposing images of the larva’s body as it moves. Head trajectory is shown by the white line and the orientation of the head at the beginning and end of the bout is represented by the black arrows. Adapted from Romano et al., 2015 [80]. (A) Low tail bend and beat frequency. (B) Fine reorientation turn achieved by a strong bend at the caudal region of the tail, associated with prey capture. (C) Reorientation turn characterised by its slow speed, large bend angle and, in most cases, unilaterality. (D) Turn associated with predator avoidance behaviors that relies on the Mauthner cells, characterised by its high-velocity and short duration. Named after the C shape the larva’s body generates at the beginning of the movement.
1.6
The Giant Danio
Giant Danio (fig. 1.5),Devario aequipinnatus, is a danionin teleost fish from the cyprinid subfamily Danioninae (Teleostei: Ostariophysi: Cypriniformes) [89,90]. Native to India, Nepal and Sri Lanka [27], and also found in Bangladesh [91], this species is pelagic and accustomed to living in small streams and rivers with fast water currents [28]. It is the largest of all the danionin species, displaying a size markedly greater than that of the Zebrafish, in which the adult can grow up to 15cm in length [92].
Following on the footsteps of the Zebrafish, Giant Danio also show some of the main advantages of a valuable research model as in being easy to maintain in the laboratory with low maintenance costs, a rapid reproductive cycle [93, 94], large clutches with over 2000 embryos per mating pair [95], external development, small larvae size and
C H A P T E R 1 . I N T R O D U C T I O N
Figure 1.5: Left: Adult Giant Danio, Adapted from: Rudloff, K (2013, June). Devario aequipinnatus. Re-trieved from https://www.biolib.cz/IMG/GAL/214411.jpg ; Right: 3dpfGiant Danio larva, Photo credit: Champalimaud Research Fish Platform.
larvae transparency [96]. Furthermore, the phylogenetic proximity to Zebrafish make the Giant Danio a strong candidate not only for a valuable research model, but as well as for enabling comparative approaches with Zebrafish [28,89,90].
The Giant Danio has been used as a model for a multitude of different studies in various fields of research. The most recent works with this model encompass the fields of pharmacokinetics [97], ecotoxicology [98,99], community ecology [100], developmental biology [94, 101,102], conservation [103] and social behavior [104]. Other works that should be mentioned, with this species as model organism, covered major topics like electrophysiology, in retinal bipolar cell input mechanisms [105–107], and even research facilities management, specifically in the expansion of thePseudoloma neurophilia known host range in different fish models kept in research facilities [108].
Considering the phylogenetic proximity to Zebrafish, the different body size and the fact that, although they may share habitat with Zebrafish, they are normally found in particular environmental conditions (faster water currents), the Giant Danio was chosen as a non-standard model organism for this comparative approach.
1.7
Objectives
Week-old larval Zebrafish (Danio rerio) already exhibit a diverse array of sensory driven behaviors that allow them to explore their environment, hunt prey and avoid predators. To study each one of these behavioral traits, the Orger Lab has developed an automated system for real-time behavior analysis at high spatial and temporal resolution. By using an unsupervised clustering method they identified 13 basic movements that the Zebrafish use when swimming [79]. Additionally, these movements are controlled by a stereotyped array of brainstem reticulospinal neurons. Understanding how generalizable the rela-tionship between the behavior, the anatomy and the structure of the underlying neural circuits is in similar organisms, and in relation to what is known in Zebrafish, may pro-vide foundations for future work in neuroethological research. Thus, in this work we followed a comparative approach and applied a systematic analysis to the behavior of a related fish species, the Giant Danio (Devario aequipinnatus), to try to answer three main questions: i) Do both species have similar locomotor characteristics? ii) Do Zebrafish and
1 . 7 . O B J E C T I V E S
Giant Danio have similar underlying motor system structure? iii) Will differences in the underlying motor system structure reflect differences in visually guided behaviors? To try and answer those questions, the following goals where set: Initially, i) characterize the descending reticulospinal neurons in the Giant Danio using retrograde labelling with dextran-conjugated dyes and confocal imaging, and identify identical/different structures from the Zebrafish; ii) record high-speed movements of Giant Danio and Zebrafish larvae and compare their locomotor performance in different behavior assays; lastly iii) apply the lab algorithms to the behavioral recordings data in order to identify basic swimming kinematics of the Giant Danio.
C
h
a
p
t
e
r
2
M e t h o d s
In this chapter, all experimental procedures and sources of materials are presented. In brief, protocols for handling the animals, label spinal projecting neurons and do the imaging are detailed. Following, the different behavioral set-ups used, as well as the design of the behavioral assays and how the analysis of all acquired behavioral data underwent are described in detail. Lastly, how the larvae are tracked, while they swim during the experiments, and their bouts detected is briefly explained.
2.1
Experimental Models Rearing Conditions and Subject
Details
Adult Zebrafish and Giant Danio were maintained by the vivarium platform at Champali-maud Research. These species are photoperiodic in their breeding and spawning tends to occur at the onset of daylight. Therefore, breeding pairs were set overnight the day before in a female-to-male ratio of 2:1 in breeding tanks. The following day, fish were returned to the system during the morning as soon as spawning was confirmed. Embryos were collected and reared at 28°C in E3 embryo medium (5 mM NaCl, 0.17 mM KCl, 0.33 mM CaCl2and 0.33 mM MgSO4), with pH and salinity kept in physiological conditions [109]. Larval density was established at 15 Giant Danio or 20 Zebrafish per 90 mm petri dish. Larva were kept on a 14h/10h light/dark cycle. E3 embryo medium was changed daily until feeding started. Once feeding commenced, embryo medium was changed twice a day, always prior to feeding. Giant Danio were fed with rotifers (Brachionus sp.) after 4dpfand Zebrafish after 5dpf. From 8dpfand 11dpf, respectively, Giant Danio and Zebrafish were fed with Artemia salina. For experimental procedures where fish were raised past 8dpfand up to 14dpf, larger 150 mm diameter petri-dish were used.
C H A P T E R 2 . M E T H O D S
when it comes to optimal rearing conditions. Those differences were mostly reflected in small changes on conductivity values [95] from Zebrafish. While efforts were made
to optimize the breeding conditions for the Giant Danio larvae during our experiments, larvae from both species were raised in the same embryo medium and we did not observe any problems with growth and viability of Giant Danio larvae under these conditions.
Three Zebrafish strains were used:Tübingen (Tu), Anju and 5D. Rearing conditions were the same for all strains. These strains were chosen so that the behavior of a com-monly used inbred strain (Tu) could be compared, performance-wise, to Zebrafish strains derived from more recently wild-caught fish. These strains derived from more recently wild-caught fish could potentially show more robust behavior responses.
For experiments involving the growth trajectories of the larvae, bothTuZebrafish and Giant Danio larvae were reared in the same conditions but kept at a density of 4 per petri-dish. For backfills and confocal imaging with Giant Danio, the E3 embryo medium was changed to a 0.003 % w/v solution ofPTU(1-phenyl 2-thiourea) in E3 embryo medium 8 to 9 hours post fertilization to prevent the development of pigmentation. The PTU
solution was then changed daily; other rearing conditions were kept the same.
All experimental procedures and animal handling were approved by the Champali-maud Foundation Ethics Committee and the Portuguese Direção Geral de Alimentação e Veterinária and were performed according to the European Directive 2010/63/EU.
2.2
Fish growth
To measure larvae growth throughout development, larvae of each species were raised in sets of 4 until they were 14dpf. A total of 8 larvae from Giant Danio andTuZebrafish were raised for growth measurements. From 4dpfonwards, pictures of each larva were taken daily, for a total of 10 images per fish. Pictures were taken from above with a custom-made high-resolution imaging set-up, using an infra-red (IR)sensitive camera (MC1362, Mikrotron). The larvae swam freely in a custom-made acrylic transparent circular arena (AnnexI.1) with a 25 mm diameter and 2 mm depth, illuminated by a custom-made 10x3x10 cmLight-emitting diode (LED)backlight (850 nm) placed below the larvae arena. The fish were imaged between 12:30h and 13:30h on each day. Image analysis and total length measurements were made using a custom MATLAB (Mathworks, USA) script (AnnexI.6). All daily measurements were then averaged in order to plot a growth curve including theStandard deviation (STD). In order to compare total length variation in both species, theCoefficient of variation (CV)for every age was calculated.
2 . 3 . R E T R O G R A D E L A B E L I N G O F R E T I C U L O S P I N A L N E U R O N S I N G I A N T DA N I O
2.3
Retrograde Labeling of Reticulospinal Neurons in Giant
Danio
Retrograde labeling (backfills) of the reticulospinal neurons in Giant Danio was per-formed following a protocol adapted from Ma and colleagues [110] and Lu and colleagues [111]. 5dpflarvae were put on a 5 % agarose base and excess medium was removed to restrain larvae movement. A 1 % w/v solution of Texas Red-Dextran conjugate (3000 MW, Lysine Fixable, Invitrogen) in Zebrafish external solution (134 mM NaCl, 2.9 mM KCl, 2.1 mM CaCl2, 1.2 mM MgCl2and 10 mM HEPES glucose, pH 7.853) was pressure injected with a micro-manipulator into ventral spinal cord, targeting descending axon tracts at the fifth and seventeenth myotome level, transecting the cord and overlaying muscles dorsal to the notochord (fig.2.1). Dye application was done through a needle made from a GC100F-10 glass capillary (Harvard Apparatus) using a micropipette puller P-2000 (Sutter Instrument). After the injection, larvae were left in E3 embryo medium at 28°C overnight to allow retrograde filling of reticulospinal neurons. On the following morning, 6dpflarvae were screened for positive labeling of the reticulospinal neurons under an Axio Zoom.V16 fluorescence microscope (Zeiss). The specimens with the most extensive labeling were selected for fixation. Larvae were sacrificed with tricaine 1.6 mg/ml, fol-lowed by fixation in 4 % paraformaldehyde during two hours at room temperature and finally washed inPhosphate buffer solution with 0.25 % Triton (PBT)[112].
Figure 2.1: Representation of the Giant Danio backfills. A solution of Texas Red-Dextran conjugate (3000 MW) in Zebrafish external solution was pressure injected into the ventral spinal cord. Injections were done in two different places, one more rostral (left side), near the 5thmyomere, and one more caudal (right side),
near the 17thmyomere.
2.4
tERK immunohistochemistry staining
After fixation, retrogradely labelled Giant Danio larvae with extensive labeling were processed for whole-mount immunohistochemistry staining. The protocol was adapted from Randlett and colleagues [113].
Whole larvae were subjected to heat-induced epitope retrieval by treatment with TrisHCl 150 mM pH 9 at 70°C for 15 min and then permeabilized in 0.05 %
Trypsin-EDTA for 5 min on ice. After incubation in blocking buffer (PBT+ 1 %Bovine serum
albumin (BSA)+ 2 %NGS+ 1 %Dimethyl sulfoxide (DMSO)), samples were incubated
C H A P T E R 2 . M E T H O D S
used as a whole-brain counterstain, as it labels the cytoplasm of neurons. Then, samples were washed inPBTand incubated with the appropriate secondary antibody, an Alexa Fluor 633 conjugate (Invitrogen). All antibodies were diluted 1/500 inPBT+ 1 %BSA+ 1 %DMSO.
2.5
Confocal Microscopy
For imaging the stained tissues, samples were mounted in low-melting agarose (1.5 % in PBS) directly on a glass coverslip (thickness of 0.17 ± 0.005 mm). Fish larvae were positioned dorsal side up and as straight and close to the coverslip as possible, with the help of forceps. After being surrounded by a grease well filled with PBS, the microscope slide was added and the sample was imaged [112].
Fish were imaged using an upright confocal Zeiss Laser Scanning Microscope 710 cou-pled with a 25x/0.8 NA multi-immersion objective (Zeiss). A diode-pumped solid-state 561 nm laser and a HeNe 633 nm laser unit were used to excite the Texas Red Dextran con-jugate fluorophore and Alexa Fluor 633 concon-jugate, respectively. As immersion medium, Immersol-W (Invitrogen) with refractive index n=1.334, matching the refractive index of water, was used. The imaging volume was selected manually and acquisition param-eters (pinhole size, pixel dwell time, digital gain, digital offset and laser power) were optimized for optimal dynamic range and signal-to-noise ratio. To image the whole brain a tiling configuration was used where two adjacent tiles (one of the forebrain and optic tectum, a second of the cerebellum and hindbrain) with 15 % overlap were acquired and stitched together (see image analysis). Each tile was imaged with a zoom factor of 0.6x at 2428x2428 pixels with 16bit depth, for an effective voxel size of 0.23x0.23x1.0 310 µm. After stitching, the field of view of each image was approximately 1045x570x350 310 µm.
2.6
Image Analysis
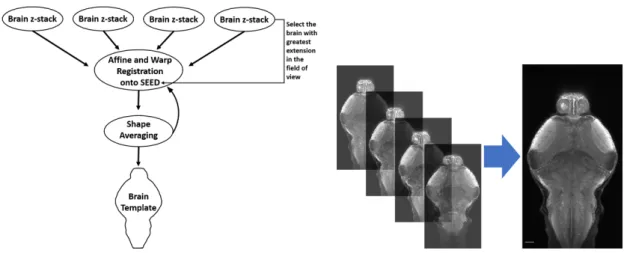
Confocal images analysis was done using the open source software Fiji [114]. Image tiles were stitched together using the 3D Stitching plugin [115], and raw full stacks were generated. To build the Giant Danio reference brain, a method adapted from Marquart and colleagues was followed [116]. Imaged individual brains were examined, and the individual with the greatest extent of the brain in the field of view was chosen as the initial seed. Each individual brain was then registered to the seed using an affine and non-rigid warping algorithm implemented inComputational Morphometry Toolkit (CMTK)(see
http://www.nitrc.org/projects/cmtk/). Each registration was checked to ensure that
the alignment was good for each brain, and then a shape-averaged brain was generated usingCMTK’s avg_adm function. This average brain then served as a template for two subsequent rounds of registration and averaging (fig. 2.2). In order to assess the precision of the registration, eight landmarks were selected in the template image, and the X, Y, and Z of each were recorded. These eight landmarks were then identified in each of the four
2 . 7 . B E H AV I O R A L S E T- U P S
Figure 2.2: Simplified cartoon of brain registration process. Left: Registration pipeline scheme. Initially the individual with greatest extent of the brain in the field of view is chosen as the initial seed. Then, individual brains are registered to the seed using an affine and non-rigid warping algorithm implemented inCMTK. Following, a shape-averaged brain is generated usingCMTK’savg_adm algorithm, which then serves as a
template for two subsequent rounds of registration and averaging to obtain the final shape-averaged brain or brain template. Right: Example of registration of four confocal brain stacks to generate a shape-averaged brain.
original (un-registered) individual confocal stacks, and their locations were noted. These landmarks were used to calculate the Euclidean distance to the corresponding landmark in the template space, with the following formula:
d(p, q) = v u t 3 X i=1 (pi−qi)2
The landmarks of the individual brains were then transformed into the template space using 3D warping registrations carried out on the correspondingtERKchannels and the "streamxform" function of theCMTKpackage. The same two calculations of distance were performed as above on the newly transformed points.
To anatomically identify and characterize the reticulospinal neurons in the Giant Danio, stacks from multiple samples were compared to Zebrafish reticulospinal neurons labeling from previous literature [110,111,113,117–121] using the open source software Fiji [114]. Because neurons overlap one another in the z-dimension, a 3D analysis was required to distinguish them.
For presentation purposes, max intensity z-projections with inverted lookup table values and standard deviation z-projections were made from the stacks of the chosen samples.
2.7
Behavioral set-ups
2.7.1 Low-Resolution Behavior set-up
The low-resolution behavior set-up was used to run circularOptomotor response(OMR) experiments with both Giant Danio and all three Zebrafish strains. Freely swimming
C H A P T E R 2 . M E T H O D S
Figure 2.3: General organization of a set-up used in behavioral experiments. Illumination is done from below with anLEDbacklight, and image acquisition is done with anIRsensitive camera from above. Stimulation is done using a projector and projecting onto a cold mirror placed between theIR LEDbacklight and the arena.
larvae were recorded in a custom-made acrylic arena consisting of a 10 mm wide circular track that had a 140 mm outer diameter, 120 mm inner diameter and 8 mm depth (Annex
I.2). Images were recorded from above at 3Frames per second (FPS)using anIRsensitive camera (Chameleon3 USB3 CM3-U3-13Y3M-CS, Flir), coupled with anHDVari-Focal Fujinon CCTV lens (YV2.8X2.8SA-2, Fujifilm) and a 790 nm long pass filter. To optimize the field of view in this set-up it was necessary to trade off spatial resolution, so it was only possible to track the fish’s position, but no to record fine tail kinematics. This set-up was therefore limited to tracking the position of the larva. Illumination was provided from below by a custom-made 130x25x110 mmIR LEDarray backlight (850 nm). Visual stim-uli were projected by a ML750e projector (Optoma) onto a cold mirror (Edmund Optics) placed between theIR LEDbacklight and the arena, allowing simultaneous illumination of the larva and presentation of the visual stimuli (fig. 2.3).
Visual stimulation and behavioral recordings were controlled by software custom-written in MATLAB (Mathworks, USA).
2.7.2 High-Resolution Behavior set-up
The high-resolution behavior set-up was used to run virtual open loopOMRand prey capture experiments with both Giant Danio and TuZebrafish. Recording of behavior of freely swimming larvae was done using three different custom-made acrylic concave arenas. Arena dimensions were proportionally increased to use with larvae in different developmental stages. Zebrafish larvae from 4dpfto 6dpfwere recorded in a 50 mm diameter arena with a 4 mm depth; 8dpfto 14dpfZebrafish larvae and 4dpfto 8dpf
Giant Danio larvae were recorded in a 66 mm diameter arena with a 5.3 mm depth; and 9 18
2 . 7 . B E H AV I O R A L S E T- U P S
dpfto 14dpfGiant Danio larvae were recorded in a 88 mm diameter arena with a 7 mm depth (AnnexI.3). Images were recorded from above at 700FPSusing anIRsensitive high-speed camera (MC1362, Mikrotron), coupled with an Apo-Xenoplan 2.0/24 (Schneider) lens and a 790 nm long pass filter. 948x948 pixel images were acquired, with the number of microns per pixel varying according to the size of the arena used. This high spatial and temporal resolution enabled the tracking of the tail and acquisition of the kinematic parameters of even the fastest movements executed by the larvae. Illumination and visual stimulation were performed in the same way as in the low-resolution behavior set-up (fig.
2.3).
Visual stimulation and behavioral recordings were controlled by software custom-written in Visual C# (Microsoft).
2.7.3 Head-Restrained Behavior set-up
Figure 2.4: Tail-free head-embedded, or head-restrained, larva preparation. Embedding is done with low-melting agarose (1.6 % in E3 embryo medium). This preparation was used in the Head-Restrained Closed Loop Virtual Reality Optomotor Response assay experiments.
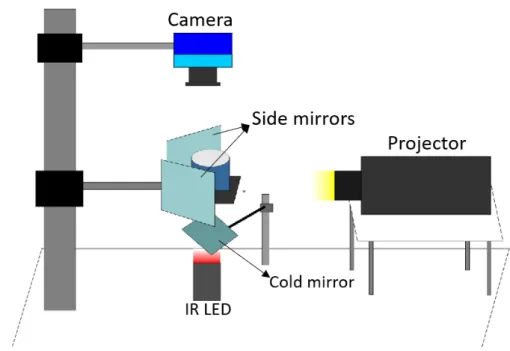
The head-restrained behavior set-up was used to run closed loopOMRexperiments with Giant Danio. Tail-free head-embedded larvae (fig.2.4) were recorded in a custom-made acrylic cylindrical arena with a 36 mm diameter and a 25 mm depth (AnnexI.4). Images were recorded from above using the sameIRsensitive high-speed camera used in the high-resolution behavior set-up described above, coupled with an Apo-Xenoplan 2.8/50 (Schneider) lens and a 790 nm long pass filter. Illumination was provided from below by a mountedIR LED(M780L3, Thorlabs) backlight. Visual stimulation was pro-jected by a ML750e projector (Optoma), through a plano-convex lens (LA1172, Thorlabs), onto one cold mirror and two first-surface mirrors (Thorlabs), the cold mirror placed in between the mountedIR LEDbacklight and the arena, and one first-surface mirror on each side of the arena located left and right in relation to the fish position (fig. 2.5). In this set-up, tracking of the tail and acquisition of the kinematic parameters was also done during the recordings.
C H A P T E R 2 . M E T H O D S
Figure 2.5: Schematic representation of the head-restrained set-up. This set-up is considerably different from the remaining, since there is a need to create a 3D virtual environment. The main difference remains in the mirrors used and their location. In order to create the 3D virtual reality environment, visual stimulation needs to be projected below the fish and sideways, creating the "illusion"of full retinal flow. To achieve this, one cold mirror is placed in between the mountedIR LEDbacklight and the arena, and two first-surface mirrors are positioned on each side of the arena, located left and right in relation to the fish position when head-restrained in the arena.
As for the high-resolution behavior set-up, visual stimulation and behavioral record-ings were controlled by software custom-written in Visual C# (Microsoft).
2.8
Behavioral Assays
The behavioral recordings were performed in acrylic transparent arenas that varied in shape, size and depth, according to the set-up, the behavior assay that was performed, and the age of the larva. All behavior assays were performed with a single larva at a time. Experiments lasted from 15 min to 2 hr depending on the duration of the stimuli protocol used for each assay. The visual stimuli protocols used in all set-ups were projected on a diffuser screen placed 5mm below the larva.
Larvae were tested with four different assays: Circular Optomotor Response, Virtual Open Loop Optomotor Response, Prey Capture and Head-restrained Closed-Loop Virtual Reality Optomotor Response.
2.8.1 Circular Optomotor Response
The three Zebrafish strains and Giant Danio larvae, from 4dpfto 14dpf, were tracked freely swimming in the low-resolution circular track described above. A total of four larvae were recorded per day.
2 . 8 . B E H AV I O R A L A S S AY S
Figure 2.6: Schematic representation of the radial gratings used for visual stimulation in the Circular Opto-motor Response assay. Image credit: Adrien Jouary.
The visual stimuli consisted of a radial grating with a spatial period of approximately 9° (fig. 2.6), which is equivalent to a 10 mm spatial period at the center of the track; the grating was displayed at maximum contrast and drifting at different speeds. A total of nine speeds were tested: 0 mm/s, 2 mm/s, 4 mm/s, 7 mm/s, 10 mm/s, 15 mm/s, 20 mm/s, 30 mm/s and 40 mm/s (speed is defined for the center of the track). Before starting an experiment, larvae were placed in the arena for a 10 min habituation period. During an experiment larva were presented with 10 sets of visual stimuli. Each set, which lasted a total of 12 min, consisted of the nine speeds presented in random order. Each speed was displayed for 1 min followed by aninterstimulus interval (ISI)of 20 s during which the grating was static. Whenever there was a new drifting speed the direction of the grating was reversed.
2.8.2 Virtual Open Loop Optomotor Response
TuZebrafish larvae at 4dpf, 5dpf, 6dpf, 8dpf, 10dpf, 12dpfand 14dpf, and Giant Danio larvae at 4dpf, 5dpf, 6dpf, 7dpf, 8dpfand 10dpf, were recorded freely swimming in custom-made concave arenas using the high-resolution behavior set-up, as mentioned above. Up to 18 larvae were recorded per day.
Visual stimuli consisted of a rectangular grating with a spatial period of 10 mm at the maximum contrast, drifting at different speeds and directions relative to the position and orientation of the larva. The tested speeds were the following: 0 mm/s, 3 mm/s, 5 mm/s, 8 mm/s, 10 mm/s, 15 mm/s, 20 mm/s and 30 mm/s. Along with the speeds, the directions of the gratings were 0°, 45°, 90°, 135°, 180°, 225°, 270° and 315°, always in relation to the fish orientation (fig.2.7). The gratings were projected in an experimental closed loop, in other words, translating and rotating the stimulus to cancel the larva’s own motion. Thus, the larva’s swimming would have no effect on the visual feedback.
C H A P T E R 2 . M E T H O D S
For example, if a larva viewing a forward motion grating accelerated, the stimulus would also increase in speed in the same direction so that the larva continued to experience the forward motion at the same speed as it would be if the larva was stationary (fig.2.8). This was done by tracking the larva position and heading in real time during an experiment. Every larva went through a 10 min habituation period in the arena before starting an experiment as for the circularOMRexperiment. During an experiment, larvae underwent a total of 720 trials. One trial, which lasted a total of 5 s, consisted of the projection of one speed in one direction. Each speed at every direction was repeated 15 times, in a fully randomized order.
Figure 2.7: Schematic representation of the eight directions of the rectangular gratings used during the Visual Open Loop Opotmotor Response assay. The directions of the gratings were 0°, 45°, 90°, 135°, 180°, 225°, 270° and 315°.
Figure 2.8: Schematic representation of how a virtual open loop, a kind of experimental closed loop, works. Left: Whenever the larva turns, the stimuli is updated and rotated to cancel the larva’s own motion ; Right: When there is forward motion (red arrow - size represents speed of the grating), if the larva swims the gratings increase their speed in the same direction so that the larva continued to experience the forward motion at the same speed as it would be if the larva was still stationary.
2 . 8 . B E H AV I O R A L A S S AY S
2.8.3 Prey Capture
To assess prey capture behavior, TuZebrafish and Giant Danio larvae, at 6 dpfand 5
dpf, respectively, were recorded freely swimming in a custom-made 19 mm diameter 3 mm deep acrylic concave arena (AnnexI.5). Images were recorded at 10FPSusing the high-resolution behavior set-up. Although no tail tracking was used in these experiments, the high-resolution set-up was necessary in order to be able to see the rotifers and identify hunting events. Before starting the experiment, larvae were put in the arena and habit-uated for 3 min. After the habituation period larvae were fed 50-200 live rotifers and were allowed to hunt for 15 min. At the end of the experiment, the resulting video was analyzed in order to count the number of rotifers eaten. Analysis of the video was done manually, going through the 9000 frames one-by-one, identifying whenever a rotifer was eaten.
2.8.4 Head-Restrained Closed Loop Virtual Reality Optomotor Response This assay was adapted from Portugues and Engert (2011)[66] and used as a “proof of concept”. It was necessary to see if the Giant Danio larvae behaved and performedOMR
when head restrained to prove that it is in fact a valuable model with potential for func-tional imaging and neuronal recordings.
Giant Danio larvae at 4dpfand 5dpfwere recorded embedded using the head-restrained behavior set-up. Embedding was done in low-melting agarose (1.6 % in E3 embryo medium) on top of a sylgard (Dow Corning) cone. After embedding, the tail was freed to move, keeping only the head stationary in agarose. The cone was then put inside the cylindrical arena (AnnexI.4).
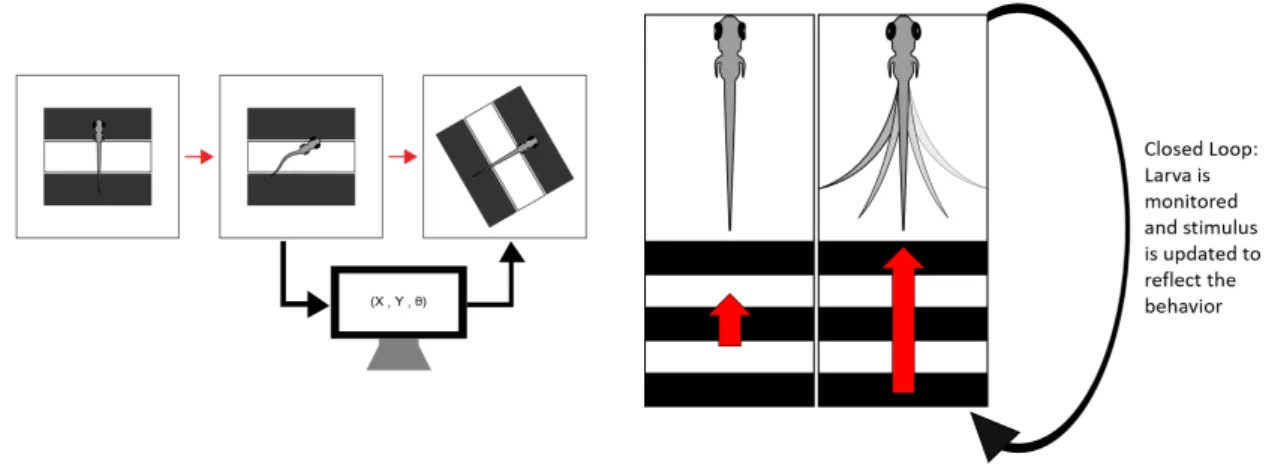
Figure 2.9: Schematic representation of the closed loop used during the Head-Restrained Closed Loop Virtual Reality Optomotor Response assay experiments. If a larva viewing a forward motion (red arrow -size represents speed of the grating) grating tried to swim forward, the stimulus decreased in speed so that the larvae perceived itself moving forward.
Visual stimuli consisted of a set of black and white stripes, projected laterally (from both sides, left and right relative to the fish position) onto the curved walls of the arena,
C H A P T E R 2 . M E T H O D S
with anamorphic perspective, so they appeared to extend on an infinite horizontal surface, and a linear gratings pattern, projected from below. Both patterns were presented with a spatial period of 10 mm and with maximum contrast. Stimuli were updated in an experimental closed loop according to the larva’s swimming. This was designed to create a 3D virtual reality environment through which the fish could swim. In this case, the translation and rotation of the stimulus was updated in a way to simulate the effect of the larvae’s intended motion. For example, if a larva viewing a forward motion grating tried to swim forward, the stimulus decreased in speed so that the larvae perceived itself moving forward (fig. 2.9). Stimuli were presented drifting at different speeds: 0 mm/s,
3 mm/s, 5 mm/s, 8 mm/s, 10 mm/s, 12 mm/s, 15 mm/s, 20 mm/s, 25 mm/s and 30 mm/s. Every larva went through a total of three trials, each lasting a total of 8 min and consisting on the projection of each speed in a random order for 30 s followed by anISI
of 20 s during which the grating was static.
After experiments, head embedded larvae were left embedded overnight to look at survival rates in agarose.
2.9
Behavior Analysis
Behavioral assays tracked data was always analyzed quantitatively using a custom MAT-LAB (Mathworks, USA) scripts. Data that was not acquired through tracking the larva in any assay was partially analyzed manually and again with custom MATLAB (Mathworks, USA) scripts. A qualitative analysis was done for comparing the prey capture behavior between Giant Danio and Zebrafish, to look at bout traces from both species and at tail end angles from head-restrained Giant Danio larvae.
2.9.1 Circular Optomotor Response
CircularOMRtracking data was analyzed using custom-written MATLAB (Mathworks, USA) scripts. All acquired data went through a pre-processing script, in order to get rid of tracking mistakes during the experiments and compute speed during spontaneous movements (no stimulation) and during trials. To compute speed, the minimum bound-ing circle of all data points was calculated in order to define the center and radius of the circle. From there, the angular speed during each stimuli speed in all trials, for positive directions (swimming in the direction of the stimuli) and negative directions (swimming against the direction of the stimuli), was calculated and the spontaneous speed duringISI
was extracted. These calculations were done per fish and per stimuli speed. Every strain of fish was saved independently, keeping all data regardingTuZebrafish, Anju Zebrafish, 5D Zebrafish and Giant Danio separated.
After processing the data, a new script was used to analyze the already pre-processed data. To look at the improvement of the speed of Tu Zebrafish and Giant Danio larvae during OMRwith age, average speed was calculated by splitting frames
2 . 9 . B E H AV I O R A N A LY S I S
into 2 s windows of time and averaging only the positive values, where the larvae was swimming in the direction of the gratings. A linear regression analysis was run on the calculated average speed to compare the development of the obtained slopes as a way to clearly state if the larvae was showing a response or not. For the purpose of looking at the probability distribution of the larvae speed during all trials per stimuli speeds, average speed of each strain during stimulations, dissociating the behavioral states that lead the larvae to track or not track the stimuli (tracking state vs non-tracking state); the average speed of each larva per stimuli speed was calculated by splitting frames into 2 s windows of time. Following, the average speed per stimuli per strain was calculated averaging the full distribution of speed values.STDwas calculated per stimuli speed and was further used to calculate theStandard error of the mean (SEM)per strain.
In order to compare the tracking state and non-tracking state of the larvae, the aver-age time spent following the stimuli (tracking state) and averaver-age time spent stationary (non-tracking state) between Giant Danio and Zebrafish, the pre-processed data from all Zebrafish strains was pooled together and then used to do the same calculations men-tioned above. This data was then compared for significance using the Wilcoxon Rank-sum test coupled to a Bonferroni correction, by multiplying each p value obtained by the total number of tests run, considering the result of that operation to infer the true significance (if p remained < 0.05 then it was considered significant and null hypothesis was rejected).
2.9.2 Virtual Open Loop Optomotor Response
Data acquired during the virtual open loopOMRexperiments was analyzed with a cus-tom MATLAB (Mathworks, USA) script previously developed in the lab. With this MAT-LAB script, data regarding bout duration, interbout interval (IBI), and bout traces was extracted. In order to make interpretation easier, all data regarding bout duration and
IBIfrom fish of the same developmental stage were pooled together and represented as probability density functions. To facilitate qualitative analysis, bout traces were manu-ally cut into smaller fragments of 20 s, where the bout onset and bout offset were clearly identified and labelled.
2.9.3 Prey Capture
The resulting videos from the prey capture experiments were analyzed in order to verify that the larva was successfully eating the prey, count the number of rotifers eaten and look at theintercapture interval (ICI). Analysis of the video was done manually, going through the 9000 frames one-by-one, identifying whenever a rotifer was eaten. The number of the frames where rotifers where captured were then inserted into a custom MATLAB (Mathworks, USA) script, separated into species, Giant Danio and Zebrafish. After, an average for the cumulative number of eaten rotifers and ICIwas calculated for each species. Lastly,STDwas calculated and further used to calculate theSEM, per