EUROPEAN ORGANIZATION FOR NUCLEAR RESEARCH (CERN)
CERN-PH-EP/2011-177 2011/11/08
CMS-BPH-10-014
J/ψ and ψ(2S) production in pp collisions at
√
s
=
7 TeV
The CMS Collaboration
∗Abstract
A measurement of the J/ψ and ψ(2S) production cross sections in pp collisions at
√
s= 7 TeV with the CMS experiment at the LHC is presented. The data sample
cor-responds to an integrated luminosity of 37 pb−1. Using a fit to the invariant mass and
decay length distributions, production cross sections have been measured separately for prompt and non-prompt charmonium states, as a function of the meson transverse momentum in several rapidity ranges. In addition, cross sections restricted to the ac-ceptance of the CMS detector are given, which are not affected by the polarization of the charmonium states. The ratio of the differential production cross sections of the two states, where systematic uncertainties largely cancel, is also determined. The
branching fraction of the inclusive B → ψ(2S)X decay is extracted from the ratio of
the non-prompt cross sections to be:
B(B→ψ(2S)X) = (3.08±0.12(stat.+syst.) ±0.13(theor.) ±0.42(BPDG)) ×10−3.
Submitted to the Journal of High Energy Physics
∗See Appendix A for the list of collaboration members
arXiv:1111.1557v1 [hep-ex] 7 Nov 2011
FERMILAB-PUB-11-745-CMS
1
1
Introduction
Quarkonium production at hadron colliders provides important tests of calculations in the con-text of both perturbative and non-perturbative quantum chromodynamics (QCD), via measure-ments of production cross sections and polarizations.
The J/ψ and ψ(2S)mesons can be produced in proton-proton (pp) collisions through two
mech-anisms: prompt mesons directly produced in the primary interaction and non-prompt mesons from the decay of directly produced b hadrons. In addition, J/ψ production can also occur via
decays of heavier charmonium states, both S-wave (the ψ(2S)itself) and P-wave (the three χc
states). The determination of the latter contribution is challenging both theoretically and
exper-imentally, because it requires detection of the low-energy photons from χcdecays. In
nonrela-tivistic QCD (NRQCD) models [1, 2], by adding a contribution to prompt charmonium
produc-tion through colour-octet states [3], a satisfactory descripproduc-tion of prompt J/ψ and ψ(2S)meson
cross sections at the Tevatron [4] has been obtained. However, in these calculations the
frac-tion of J/ψ originating from χcdecays must be assumed from experimental measurements with
large uncertainties, which makes the ψ(2S)mesons cleaner probes of NRQCD predictions.
Non-prompt J/ψ and ψ(2S)production can be directly related to b-hadron production,
provid-ing a measurement of the b-hadron cross section in pp collisions. Past discrepancies between the Tevatron results and the next-to-leading-order (NLO) QCD calculations have been resolved using the fixed-order next-to-leading-log (FONLL) approach and updated measurements of the
b→J/ψ fragmentation and decay [5, 6].
Measurements of the prompt and non-prompt production cross sections of J/ψ mesons decay-ing to muon pairs was published usdecay-ing the first Compact Muon Solenoid (CMS) data [7], as well as data from other LHC experiments [8–10]. The present analysis extends the CMS result with a larger amount of statistically independent data and complements it by providing a
mea-surement of the ψ(2S)production cross section, as well as the ratio of the two cross sections.
Higher trigger thresholds induced by the increased LHC luminosity do not allow the current
measurement to reach charmonium transverse-momentum (pT) values as low as in Ref. [7],
but the high-pTreach is increased by the much larger amount of data. The advantage of
mea-suring the ψ(2S)to J/ψ cross-section ratio lies in the cancellation of several experimental and
theoretical uncertainties.
The polarizations of the J/ψ and ψ(2S)states affect the muon momentum spectrum in the
lab-oratory frame, thus influencing the charmonium acceptance and, as a consequence, the ex-tracted cross sections. Therefore it was decided to present the results in two different ways.
The first approach assumes unpolarized production for prompt J/ψ and ψ(2S)whereas
non-prompt mesons are assumed to have the polarization generated by the EVTGENMonte Carlo
program [11], corrected to match the most recent measurements [12]. Typical changes of the measured cross sections resulting from using hypotheses of full longitudinal or full transverse polarizations are also given. The second approach provides results restricted to the phase-space region of the CMS muon detector acceptance, in order to avoid corrections which depend on the unknown polarizations of the two charmonium states.
The paper is structured as follows. In Section 2, a brief description of the CMS detector is provided. In Section 3, the data and Monte Carlo samples are presented, and the event selection
is described, while Section 4 presents the method to extract the total J/ψ and ψ(2S)yields. In
Section 5, corrections for acceptance and efficiency are explained, which are used to determine the inclusive cross sections, as discussed in Section 6. Section 7 describes the method to extract
2 3 Data selection and event reconstruction
differential cross sections, the non-prompt fractions, the cross-section ratios, and the inclusive
branching fractionB(B→ψ(2S)X)from the ratio of the non-prompt cross sections are given.
2
The CMS detector
A detailed description of the detector can be found elsewhere [13]. The central feature of the CMS apparatus, composed of a central barrel and two endcaps, is a 6 m diameter superconduct-ing solenoid producsuperconduct-ing a 3.8 T magnetic field. Within the magnetic field volume are the silicon tracker, the crystal electromagnetic calorimeter, and the brass/scintillator hadron calorimeter. The coordinate system adopted by CMS has the origin at the nominal collision point, the y axis pointing vertically upward, and the x axis pointing radially toward the centre of the LHC ring. The z axis points along the anti-clockwise beam direction defining a right-handed coordinate system. The polar angle θ is measured from the z axis. The pseudorapidity of a particle is
defined as η = −ln[tan(θ/2)], which approaches the rapidity y= 0.5 ln[(E+cpz)/(E−cpz)]
in the ultra-relativistic limit, where E and pzare the particle’s energy and longitudinal
momen-tum.
Muons are detected in the pseudorapidity range|η| <2.4 by three types of gas-based detectors
embedded in the steel return yoke: drift tubes in the barrel, cathode strip chambers in the endcaps, and resistive plate chambers in both the barrel and endcaps.
The silicon tracker consists of the inner pixel-based detector followed by layers of microstrip detectors. The strong magnetic field and the good position resolution of the silicon tracker enable the transverse momentum of muons matched to reconstructed tracks to be measured
with a resolution of∼1.5 % for pTsmaller than 100 GeV/c.
The first level (L1) of the CMS trigger system, composed of custom hardware processors, uses information from the calorimeters and muon detectors to select the most interesting events. The high level trigger (HLT) runs on a processor farm to reduce further the rate before data storage.
3
Data selection and event reconstruction
This analysis is based on a data sample collected in 2010 with the CMS detector, in pp collisions at a centre-of-mass energy of 7 TeV. The sample is selected to have consistent trigger require-ments for the data used in the analysis and without overlap with the sample used in Ref. [7]. It
corresponds to a total integrated luminosity of 36.7±1.5 pb−1[14]. During this data-taking
pe-riod, there were on average 2.2 inelastic pp collisions per bunch crossing at the CMS interaction region.
The J/ψ and ψ(2S)mesons are reconstructed in the µ+µ−decay channel. This analysis is based
on events selected by dimuon triggers that exploit advanced processing at the HLT level. Infor-mation from all three muon systems, as well as from the tracker, are used to make the trigger decision. Both muons are required to be consistent with a L1 muon signal, requiring at least two independent segments in the muon chambers, and to be matched to a track reconstructed in a region of interest defined by the L1 seed. No explicit requirement on the transverse momentum
pT is applied.
Simulated events are used to tune the selection criteria, check the agreement with data, com-pute the acceptance, and derive efficiency corrections, as well as for systematic studies. Prompt
3
the leading-order colour-singlet and colour-octet mechanisms. Colour-octet states undergo a shower evolution. We use the NRQCD matrix element tuning obtained by fitting NRQCD calculations to CDF data [16, 17]. In the absence of consistent theoretical and experimental
in-formation about the J/ψ and ψ(2S)polarizations, the dilepton decay distribution is assumed to
be isotropic. Simulated events with b-hadron decays are also generated withPYTHIA, and the b
hadrons are forced to decay inclusively into J/ψ and ψ(2S)using the EVTGENpackage. Photon
final-state radiation (FSR) is implemented usingPHOTOS[18, 19].
The off-line event selection, only briefly summarized here, is very similar to the one used in Ref. [7]. Muon candidates are reconstructed from the combination of muon-detector and silicon-tracker hits. The muons are required to pass the following criteria in the tracker: have
at least 10 tracker hits, at least two of which are required to be in the pixel layers; have a χ2per
degree of freedom smaller than 1.8; and pass within a cylinder of radius 3 cm and length 30 cm centred at the beam-spot centroid position and parallel to the beam line.
To select events with J/ψ or ψ(2S)decays, muons with opposite charge are paired and their
invariant mass is computed. The mass is required to be between 2.5 and 4.7 GeV/c2. The two
muon trajectories are refitted with a common vertex constraint, and events are retained if the
χ2probability of the fit is larger than 1%. If more than one muon pair is found in the event, the
one with the largest vertex χ2probability is retained.
The dimuon L1 triggers include a veto, whose specific criteria depend on the type of muon chamber and the region of the detector: this rejects muon signals whose spatial separation in the muon stations is too small, in order to avoid spurious dimuon signatures from a single muon. As a consequence, the dimuon sample is split in two, depending on the signed differ-ence in azimuthal angle (∆φ) between the positively and the negatively charged muons. Muons that bend towards each other in the magnetic field are called type-C (“convergent”) dimuons, while muons that bend away from each other are type-D (“divergent”) dimuons.
Dimuons of type D are much less affected by the trigger veto, while dimuons of type C may cross at the muon stations. This causes sizeable correlations between the two muon detection efficiencies, and this effect is larger in the forward region. Therefore, in addition to the above requirements, all type-C dimuons are rejected for the inclusive cross-section measurements. This corresponds to a 48% reduction in the yield. For the non-prompt fraction determination (which is largely efficiency independent), type-C dimuons are only rejected in the high dimuon
rapidity region 1.6< |y| <2.4.
The momentum measurement of charged tracks in the CMS detector has systematic uncer-tainties that are due to imperfect knowledge of the magnetic field, modelling of the detector material, and sub-detector misalignment. These effects can shift and change the width of the mass peaks of dimuon resonances. In addition to calibrations already applied to the data [20– 22], residual effects are determined by studying the dependence of the reconstructed dimuon peak shapes on the muon kinematics, as was done in Ref. [7].
Because of the large difference in the branching fractions to dimuons of the two states, the
measured ψ(2S)yield is much smaller than the J/ψ yield. For this reason, different binnings
are used for the differential cross sections in pT and|y|.
4
Inclusive yield determination
Two methods are used to extract the inclusive yields from the µ+
µ−invariant mass distribution,
4 4 Inclusive yield determination
ψ(2S)distribution. Yields are derived using an extended unbinned maximum-likelihood
meth-od.
In both types of fits, the sum of a Gaussian and a Crystal Ball [23] function is used for the de-scription of the signal, simultaneously taking into account FSR and rapidity-dependent resolu-tion variaresolu-tions. In the J/ψ-only fits, an exponential funcresolu-tion is used to describe the background. Figure 1 (top) shows an example of a fitted mass distribution. The mass resolution ranges from
about 20 MeV/c2in the low rapidity region to 35 MeV/c2at intermediate rapidities, up to about
50 MeV/c2in the forward, high rapidity region.
In the second type of fits, the two mass peaks and the background are fitted simultaneously.
For the J/ψ and ψ(2S)signal peaks, the same probability density function (pdf) is used, with
the following constraints on the parameters: the ratio of the central values of the two masses is fixed to the world average value [24]; the widths, scaled by the nominal mass values, are constrained to be the same, and the parameters describing the asymmetric tail of the Crystal Ball function are constrained to be equal. The background is modelled by two exponentials. Figure 1 (bottom) shows an example of a fitted mass distribution.
) 2 invariant mass (GeV/c -µ + µ 2.5 2.6 2.7 2.8 2.9 3 3.1 3.2 3.3 3.4 3.5 ) 2 Events / ( 0.02 GeV/c 200 400 600 800 1000 ) 2 invariant mass (GeV/c -µ + µ 2.5 2.6 2.7 2.8 2.9 3 3.1 3.2 3.3 3.4 3.5 ) 2 Events / ( 0.02 GeV/c 200 400 600 800 1000 CMS - s = 7 TeV -1 L = 37 pb < 15 GeV/c T 12 < p 0.9 < |y| < 1.2 data total fit background = 45.5/44 DoF /n 2 χ ) 2 invariant mass (GeV/c -µ + µ 2.5 3 3.5 4 4.5 ) 2 Events / ( 0.02 GeV/c 10 2 10 3 10 ) 2 invariant mass (GeV/c -µ + µ 2.5 3 3.5 4 4.5 ) 2 Events / ( 0.02 GeV/c 10 2 10 3 10 = 7 TeV s CMS - -1 L = 37 pb < 9 GeV/c T 8 < p |y| < 1.2 data total fit background = 94.4/99 DoF /n 2 χ
Figure 1: Top: The µ+µ−invariant mass distribution in the J/ψ region and the result of the fit
for the bin: 0.9 < |y| <1.2, 12< pT < 15 GeV/c. Bottom: J/ψ and ψ(2S)mass distribution fit
for the bin: |y| <1.2, 8< pT <9 GeV/c. The solid and dashed lines represent the total fits and
5
The systematic uncertainties on the mass distribution fits are estimated by changing the ana-lytical form of the signal and background pdf hypotheses (a single Crystal Ball function is used for the signal and polynomial pdfs for the background) in the two types of fits. The largest variation in the yield of each fit is taken as the systematic uncertainty.
5
Acceptance and efficiency
As discussed in Section 1, measurements will be presented using two different approaches. In the first approach, the observed number of J/ψ events is corrected for the detector acceptance and reconstruction efficiency in every bin in which the cross section is measured. As the ac-ceptance is strongly dependent on the assumed polarization of the charmonium state, in the second approach we provide measurements exclusively within the CMS detector acceptance, where only detector efficiency corrections are made and without any polarization-related un-certainties.
5.1 Acceptance
The acceptance reflects the geometrical coverage of the CMS detector and the kinematic reach of the muon trigger and reconstruction, constrained by the amount of material in front of the muon detectors and by the track curvature in the magnetic field.
In the simulation, both muons are required to be within the geometric acceptance of the muon detectors. A single muon is defined as detectable if it satisfies the following requirements at generator level:
pµT >4.0 GeV/c for |ηµ| <1.2
pµT >3.3 GeV/c for 1.2< |ηµ| <2.4 . (1)
The J/ψ acceptance A is defined as the fraction of detectable J/ψ→µ+µ−decays, as a function
of the generated dimuon transverse momentum pT and rapidity y,
A(pT, y; λθ) =
Ndet(pT, y; λθ)
Ngen(pT, y; λθ)
, (2)
where Ndetis the number of detectable J/ψ events in a given (pT, y) bin, and Ngenis the
cor-responding total number of generated J/ψ events in the Monte Carlo (MC) simulation. An
analogous definition holds for ψ(2S). The parameter λθ reflects the fact that the acceptance
is computed for various polarization scenarios, which lead to different muon spectra in the laboratory frame.
For the acceptance calculation, a dedicated sample of generated events is used, with no restric-tions on the phase space. The large number of simulated events allows a much smaller bin size for determining A with respect to that used for the cross-section determination in data.
To study the effect of J/ψ and ψ(2S)polarization on the acceptance, these events are reweighted
depending on the values of the polar and azimuthal angles as computed in two different frames
(helicity and Collins-Soper [25]). The angular distribution for the decay of a J = 1 state into
fermions is used, which is a function of three independent parameters λθ, λφ, and λθφ:
W(cos θ, φ) = 3
2(3+λθ)
6 5 Acceptance and efficiency
The choice of zero for all λ parameters corresponds to an unpolarized decay, while λθ = −1
and λθ = +1 correspond to fully longitudinal and fully transverse polarizations, respectively.
By default, the prompt J/ψ and ψ(2S)are assumed to be unpolarized, while the non-prompt
mesons are assumed to be polarized as generated by EVTGENand corrected to match recent
measurements, as mentioned in the Introduction. Typical changes of the measured cross sec-tions when using alternative polarization scenarios are provided in Section 8.
Several sources of systematic uncertainty on the acceptance have been investigated:
• Kinematic spectra. Different pT and y spectra of the generated J/ψ and ψ(2S)might
produce different acceptances, as the acceptance is defined by single-muon crite-ria. Spectra from theoretical predictions presented in Section 8 have been used to
recompute the acceptance, and the difference from that obtained with the PYTHIA
spectrum has been taken as a systematic uncertainty.
• Final-state radiation. The generated dimuon momentum may differ from the J/ψ and
ψ(2S)momentum, because of FSR. The difference between the acceptance computed
using the dimuon or the charmonium variables in Eq. (2) is taken as a systematic uncertainty.
• B polarization. The J/ψ and ψ(2S)mesons produced in b-hadron decays have a
dif-ferent acceptance with respect to the prompt ones. The corresponding systematic uncertainty is evaluated by taking the difference of the default choice (corrected to match the experimental results of Ref. [12]) with respect to the one predicted by
EVTGEN.
• pT calibration. The muon transverse momenta in data have been calibrated as
de-scribed in Ref. [7]. A difference in the momentum resolution between data and simulated events would also give a systematic uncertainty on the acceptance. The acceptance has been computed with simulated muon momenta smeared according to the resolution measured with data [26]. The uncertainty on the measured res-olution was used to apply an additional smearing on the simulated momenta; the acceptance has been recalculated and the shift taken as a systematic uncertainty.
5.2 Muon efficiency
The single-muon efficiency is measured from data for muons in the acceptance, as described in Refs. [27, 28], and is based on the tag-and-probe (T&P) method. For this purpose, independent sets of triggers are used for which online requirements either on the muon or the tracker tracks are not applied, thus yielding samples which are unbiased with respect to the corresponding selections.
The combined trigger and offline reconstruction efficiency for a single muon is defined as:
e(µ) =etrig|off·eoff|ID·eID|track·etrack, (4)
where etrackis the offline tracking efficiency, eID|trackrefers to the muon identification in the
muon systems for a tracker-reconstructed muon, eoff|IDrefers to the specific quality
require-ments applied to reconstructed muons, and etrig|off is the probability for an offline
recon-structed muon to have also fired the trigger.
5.2 Muon efficiency 7
strongest pTµand|ηµ|dependence and are determined in 15 bins of pµ
T (3.3 < p
µ
T < 50 GeV/c)
and 14 bins of|ηµ|(0< |ηµ| <2.4), allowing an adequate description of the turn-on efficiency
curves. Since the tracking efficiency is almost constant for this momentum and rapidity range, broader bins are used.
The efficiency to detect a dimuon event is expressed as:
e(µ+µ−) =e(µ+) ·e(µ−) ·ρ·evertex, (5)
where e(µ+) and e(µ−)are the single-muon efficiencies, and evertex is the efficiency of the
vertex χ2 requirement, calculated from the data by determining the yields in regions of large
pT and|y|by alternatively applying and not applying this requirement. The ρ factor, defined
by Eq. (5), represents a correction to the efficiency factorization hypothesis: it accounts for the
finite size of the (pµT, ηµ)bins and, more importantly, for the possible bias introduced by the
T&P measurement, due to correlation effects as discussed in Section 3. In order to determine ρ, the efficiencies have also been evaluated using T&P techniques on simulated events and their
product has been compared with the true dimuon efficiency. Except for some bins at high pT,
the values are found to satisfy|1−ρ| <10%.
For the acceptance-corrected cross-section results, the acceptance and efficiencies are combined
into a single factor, which is computed for each (pT, y) bin and is defined as:
1 A·e bin ≡ 1 Nevent Nevent
∑
k=1 1 Ak·ek(µ+µ−), (6)where the average is taken over the data events in each bin, using the “fine-grained” bins of the acceptance and the event-by-event efficiency obtained from the single-muon efficiencies using Eq. (5).
Similarly, for the results which are not corrected for acceptance, the efficiency factor is deter-mined as: 1 e bin ≡ 1 Nevent Nevent
∑
k=1 1 ek(µ+µ−). (7)Two sources of systematic uncertainty in the efficiency are considered:
• The uncertainties on the measured muon efficiencies propagate as systematic errors
on the cross section measurement through the correction factor h 1
A·eibin (orh
1
eibin).
The effect has been estimated on a statistical basis in each bin by performing Monte Carlo pseudo-experiments, in which the muon efficiencies were varied randomly according to a probability density built by joining the left and the right side of two Gaussians with different widths, in order to allow for asymmetric errors. The r.m.s. of these correction factors in each bin has been taken as the systematic uncertainty associated with the single-muon efficiency.
• The full difference|1−ρ|in each bin is taken as a systematic uncertainty due to the
8 6 Inclusive cross-section determination
6
Inclusive cross-section determination
The inclusive double-differential cross section is given by:
d2σ dpTdy (J/ψ) · B(J/ψ→µ+µ−) = NJ/ψcorr(pT,|y|) R L dt·∆pT·∆y , (8)
whereR L dt is the integrated luminosity, ∆pT and∆y are the pT and y bin widths, B(J/ψ →
µ+µ−)is the decay branching fraction of the J/ψ into two muons, and NJ/ψcorr(pT,|y|)is the
cor-rected J/ψ yield in a given (pT, |y|) bin. The corrected yield is obtained from the fitted signal
yield NJ/ψ via Ncorr
J/ψ = NJ/ψ· hA·1eibin in the case where the J/ψ yields are corrected for
accep-tance and efficiency, and Ncorr
J/ψ = NJ/ψ· h1eibinin the case where the results are uncorrected for
acceptance. An analogous formula applies for the ψ(2S)double-differential cross section.
Figure 2 shows the measured (fully corrected) J/ψ inclusive cross section as a function of pTfor
the various rapidity bins. They are compared with our previous results published in Ref. [7], which are statistically independent and remain of interest since they partially overlap with the
present results and cover a lower pT range. A good agreement is observed. In this figure, as
well as in the cross-section plots of Section 8, multiplicative factors – appearing as additive offsets on the log scale – are used to achieve a convenient graphical separation of the measure-ments from different rapidity bins.
(GeV/c)
Tp
0.3
1
2 3 4 5
10
20
dy (nb/(GeV/c))
T/dp
ψ J/σ
2d
×
B
-210
-110
1
10
210
310
-1 = 7 TeV L = 37 pb s CMSLuminosity and polarization uncertainties not shown
, corrected for acceptance -µ + µ → ψ inclusive J/ Eur. Phys. J. C71 (2011) 1575 100) × 0.0 < |y| < 1.2 ( 10) × 1.2 < |y| < 1.6 ( 1) × 1.6 < |y| < 2.4 ( This paper 100) × 0.0 < |y| < 0.9 ( 100) × 0.9 < |y| < 1.2 ( 10) × 1.2 < |y| < 1.6 ( 1) × 1.6 < |y| < 2.1 ( 1) × 2.1 < |y| < 2.4 (
Figure 2: Measured differential cross section for J/ψ inclusive production as a function of pTfor
five rapidity bins, fully corrected for acceptance and efficiency. Also plotted are the results
pub-lished in Ref. [7], which extend to a lower pTrange. The error bars on data points include all the
statistical and systematic contributions except luminosity and polarization. The measurements have been offset by the numerical values given in the legend for easier viewing.
9
7
Prompt and non-prompt fractions
To estimate the J/ψ fraction from b-hadron decays, a two-dimensional fit is performed, in which the pdfs and fit procedure are the same as those described in Ref. [7]. The variables used for the two-dimensional fits are the dimuon invariant mass and the “pseudo proper decay length”
`J/ψ, defined as the most probable value of the transverse distance between the dimuon vertex
and the primary vertex, corrected by the transverse Lorentz boost of the J/ψ. As in Ref. [7], the primary vertex is chosen as the one closest to the dimuon vertex in the z direction.
The resolution of the pseudo proper decay length is described by a function depending on an event-by-event uncertainty determined from the covariance matrices of the primary and secondary vertex fits. The uncertainty is used as the r.m.s. of the resolution Gaussian function that describes the core of the resolution, while a second Gaussian function with a small relative
normalization (usually<1%) parametrizes the effect of incorrect primary vertex assignments.
The pdf F(`J/ψ, mµµ, σ`)for the J/ψ is then:
F(`J/ψ, mµµ, σ`) = fSig·DSig(σ`) ·FSig(`J/ψ, σ`) ·MSig(mµµ) +
(1− fSig) ·DBkg(σ`) ·FBkg(`J/ψ, σ`) ·MBkg(mµµ), (9) where: Fk(`J/ψ, σ`) = 2
∑
i=1 Fktrue(`0J/ψ) ⊗Ri(`J/ψ− `0J/ψ|µ, siσ`). (10)and k={Sig, Bkg}. In the equations above:
• MSig(mµµ)and MBkg(mµµ)are the mass pdfs determined for the signal and
back-ground in Section 4, and fSigis the fraction of signal events in the entire range of the
fit;
• FSigtrue(`J/ψ)and FBkgtrue(`J/ψ)are the functional forms describing the`J/ψdistribution for
the signal and background, respectively. The signal part is given by the sum of
prompt and non-prompt components: Ftrue
Sig (`J/ψ) = fb· fb(`J/ψ) + (1− fb) ·Fp(`J/ψ),
where fbis the fraction of J/ψ from b-hadron decays, and Fp(`J/ψ)and fb(`J/ψ)are
the`J/ψdistributions for prompt and non-prompt J/ψ, respectively. The`J/ψpdfs for
prompt signal and background are the same as in Ref. [7]. The non-prompt life-time function is described by an exponential decay of the b hadron, with a Gaussian smearing function that accounts for the difference between the measured pseudo proper decay length and the proper decay length of the b hadron;
• σ`is the per-event uncertainty of the decay length and DSig(σ`)and DBkg(σ`)are its
distributions separately for signal and background [29]. They are obtained from the signal region of the invariant mass distribution, after a sideband subtraction, and the sideband regions, respectively;
• R1and R2represent the core and tail decay-length resolution Gaussian functions: µ
is their common mean and si represent scale factors for the per-event uncertainty,
which are both left free in the fit to account for initial assumptions on the
uncer-tainties of track parameters. These functions are convolved with Fktrue(`J/ψ)to obtain
the observed Fk(`J/ψ)distributions, including the experimental resolution (k ={Sig,
Bkg}).
The background is fitted using the events in mass sidebands and the result is used to fix lifetime parameters of the overall fit in the entire mass region. The mass sideband region is defined as
10 7 Prompt and non-prompt fractions
For the determination of the ψ(2S)non-prompt fraction, the quantity`ψ(2S), defined as for the
J/ψ case, is computed. In order to constrain the fit and avoid problems due to limited statistical
accuracy, the J/ψ and ψ(2S)samples are fitted simultaneously using the same binning as for the
ψ(2S)cross-section determination. The lifetime resolution functions R1and R2are constrained
to be described by the same parameters (mean value and scale factors) and the backgrounds to have the same fractions of long-lived components.
The invariant mass sideband regions used for the determination of the background parameters
are defined as above for the J/ψ, and as [3.35, 3.45] and [3.85, 4.20] GeV/c2for the ψ(2S).
Figure 3 shows two examples of the`J/ψand`ψ(2S)distributions with projections of
two-dimen-sional fits on these dimensions, as well as the prompt and non-prompt components obtained as described above. The lower plots in Figure 3 give the pull distributions from the fits, and show no systematic structure.
-0.5 0 0.5 1 1.5 2 Events / (0.03 mm) 10 2 10 3 10 4 10 -0.5 0 0.5 1 1.5 2 Events / (0.03 mm) 10 2 10 3 10 4 10 = 7 TeV s CMS - -1 L = 37 pb data total fit prompt non-prompt background < 9 GeV/c T 8 < p |y| < 0.9 (mm) ψ J/ l -0.5 0 0.5 1 1.5 2 Fit pull -4 -3 -2-1 01 2 3 4 (mm) ψ J/ l -0.5 0 0.5 1 1.5 2 Fit pull -4 -3 -2-1 01 2 3 4 -0.5 0 0.5 1 1.5 2 Events / (0.06 mm) -1 10 1 10 2 10 -0.5 0 0.5 1 1.5 2 Events / (0.06 mm) -1 10 1 10 2 10 = 7 TeV s CMS - -1 L = 37 pb data total fit prompt non-prompt background < 15 GeV/c T 12 < p 1.6 < |y| < 2.4 (mm) (2S) ψ l -0.5 0 0.5 1 1.5 2 Fit pull -4 -3 -2-1 01 2 3 4 (mm) (2S) ψ l -0.5 0 0.5 1 1.5 2 Fit pull -4 -3 -2-1 01 2 3 4
Figure 3: Left: Projection of a J/ψ two-dimensional fit on the`J/ψdimension in the bin|y| <0.9,
8 < pT < 9 GeV/c and in the whole mass region [2.50, 3.35] GeV/c2. Right: Projection of a
J/ψ-ψ(2S)two-dimensional fit on the `ψ(2S)dimension in the bin: 1.6 < |y| < 2.4, 12 < pT <
15 GeV/c, in the ψ(2S)mass region [3.35, 4.20] GeV/c2. The solid lines represent the total fits;
the prompt, non-prompt and background components are also shown using green dash-dotted, red dashed and blue dotted lines, respectively. The fit pull plots show no systematic structures. Several sources of systematic uncertainty have been addressed, using mostly the same proce-dures as in Ref. [7]. The main additional systematic effect comes from attempting to choose the correct primary vertex of the interaction in the presence of pile-up. The sources of systematic uncertainty include the following:
• Primary vertex assignment. In order to estimate the possible effect of pile-up on the
primary vertex estimation, the primary vertex associated to the dimuon is chosen as
the one with the largest track∑ pT2, instead of the one closest in z to the dimuon
ver-tex. The difference between the fitted non-prompt fractions in these two approaches is taken as the systematic uncertainty.
11
• Residual misalignment in the tracker. The effect of uncertainties in the measured
mis-alignment of the tracker modules is estimated by reconstructing the data using dif-ferent sets of alignment constants. The largest difference in the fit results with respect to the nominal case is taken as the systematic uncertainty.
• b-hadron lifetime model. An alternative fit method is used, namely the b-hadron
life-time model used in Ref. [7], which is based on MC templates; the difference in the fitted non-prompt fraction is taken as the systematic uncertainty.
• Background fits. The effect of a ±100 MeV/c2 variation in the lower limit of the
low-mass side (upper limit of the high-low-mass side) of the J/ψ (ψ(2S)) sideband boundaries
is taken as the systematic uncertainty.
• Resolution model. The nominal (double-Gaussian) model for the pseudo proper
de-cay length per-event resolution is compared with a model using a single-Gaussian shape. The difference is taken as the systematic uncertainty.
• Different prompt and non-prompt efficiencies. The MC simulation predicts slight
dif-ferences between the prompt and non-prompt J/ψ and ψ(2S) efficiencies, mostly
because of the different track densities from fragmentation products around the muons. These are taken into account; the relative difference is propagated to the non-prompt fraction, and taken as the systematic uncertainty.
Non-prompt fraction results are given in Section 8 and a summary of all the systematic
uncer-tainties is given in Tables 1 and 2 for the J/ψ and ψ(2S), respectively.
8
Results
The prompt and non-prompt double differential cross sections for the two charmonium states are obtained by multiplying the measured inclusive cross sections with the fraction of prompt and non-prompt events, respectively. In addition the cross-section ratio of the two charmonium states is calculated.
Statistical uncertainties and contributions from the investigated sources to the total systematic uncertainties on these cross sections are summarized in Tables 1 and 2. The largest uncertainties are due to the efficiency correlations; FSR estimation has a sizeable effect only in bins close to the edges of the acceptance.
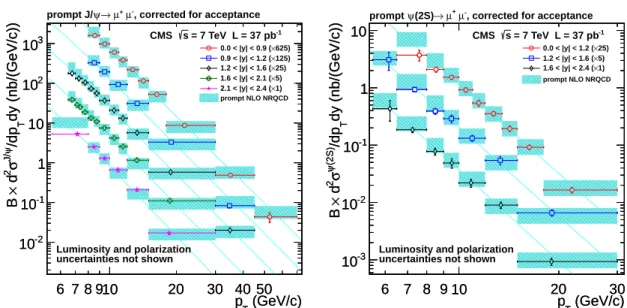
8.1 Prompt and non-prompt cross sections corrected for acceptance
Figures 4 and 5 show the measured prompt and non-prompt cross sections for the J/ψ and the
ψ(2S)as a function of pT, for the various rapidity bins and corrected for detector acceptance.
They are compared with theoretical predictions from NRQCD [3] and from FONLL [5, 6] for the prompt and non-prompt cases, respectively. Numerical values are also reported in Ref. [30]. The NRQCD prediction includes non-prompt production in the J/ψ case caused by feed-down decays from heavier charmonia, and can therefore be directly compared with the data. Good
agreement is found in both the J/ψ and the ψ(2S)cases. For non-prompt production the
mea-surements lie systematically below the FONLL predictions, possibly because of the large
un-certainty on the B → ψ(2S)X branching fraction. In general, for both states, the observed
differential cross sections seem to fall more rapidly than the FONLL prediction at high pT, and
this effect is more evident for the J/ψ because of the higher pTreach.
The NRQCD theoretical uncertainties include those on the feed-down contributions and on the colour-octet, long-distance matrix elements determined from fits to the Tevatron data. The
12 8 Results
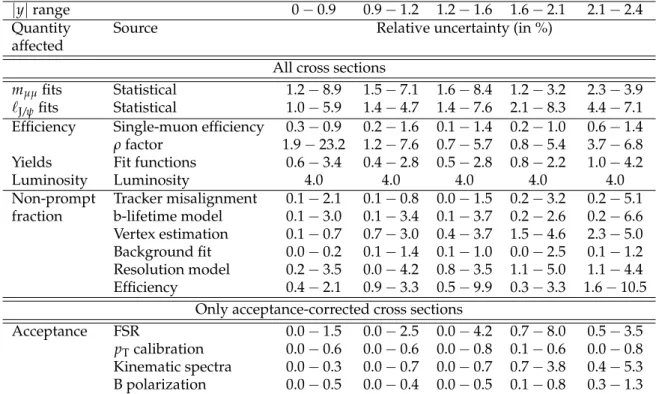
Table 1: Summary of the relative statistical and systematic uncertainties on the non-prompt
J/ψ cross section (in %). The variation over the different pT bins is given for the five
rapid-ity regions. Uncertainties on the prompt cross section are identical, with the exception of the
non-prompt fraction, where they must be regarded as relative to (1− fb) rather than to fb.
Acceptance uncertainties on the FSR are given, excluding the lowest-pT bin in every rapidity
region, where it can be as large as 19% because of acceptance edge effects.
|y|range 0−0.9 0.9−1.2 1.2−1.6 1.6−2.1 2.1−2.4
Quantity Source Relative uncertainty (in %)
affected
All cross sections
mµµfits Statistical 1.2−8.9 1.5−7.1 1.6−8.4 1.2−3.2 2.3−3.9 `J/ψfits Statistical 1.0−5.9 1.4−4.7 1.4−7.6 2.1−8.3 4.4−7.1 Efficiency Single-muon efficiency 0.3−0.9 0.2−1.6 0.1−1.4 0.2−1.0 0.6−1.4 ρfactor 1.9−23.2 1.2−7.6 0.7−5.7 0.8−5.4 3.7−6.8 Yields Fit functions 0.6−3.4 0.4−2.8 0.5−2.8 0.8−2.2 1.0−4.2
Luminosity Luminosity 4.0 4.0 4.0 4.0 4.0
Non-prompt Tracker misalignment 0.1−2.1 0.1−0.8 0.0−1.5 0.2−3.2 0.2−5.1 fraction b-lifetime model 0.1−3.0 0.1−3.4 0.1−3.7 0.2−2.6 0.2−6.6 Vertex estimation 0.1−0.7 0.7−3.0 0.4−3.7 1.5−4.6 2.3−5.0 Background fit 0.0−0.2 0.1−1.4 0.1−1.0 0.0−2.5 0.1−1.2 Resolution model 0.2−3.5 0.0−4.2 0.8−3.5 1.1−5.0 1.1−4.4 Efficiency 0.4−2.1 0.9−3.3 0.5−9.9 0.3−3.3 1.6−10.5
Only acceptance-corrected cross sections
Acceptance FSR 0.0−1.5 0.0−2.5 0.0−4.2 0.7−8.0 0.5−3.5 pTcalibration 0.0−0.6 0.0−0.6 0.0−0.8 0.1−0.6 0.0−0.8 Kinematic spectra 0.0−0.3 0.0−0.7 0.0−0.7 0.7−3.8 0.4−5.3 B polarization 0.0−0.5 0.0−0.4 0.0−0.5 0.1−0.8 0.3−1.3
FONLL theoretical errors include uncertainties onB(B →J/ψ X)andB(B→ ψ(2S)X),
renor-malization and factorization scales, b-quark and c-quark masses, parton distribution functions, and bfragmentation parameters.
However, uncertainties on the B→charmonium decay spectrum were not included in the
orig-inal FONLL prediction. To estimate those, we make use of the EVTGENMC generator, which
describes B→charmonium decays using a sum of many exclusive modes. We split the decay
modes into two categories, “high-Q” and “low-Q”, if the value of Q in the decay is respectively
greater than or less than 1.2 GeV/c2, where Q = mB−∑imi and the index i runs over the B
decay products. As low-Q (high-Q) modes yield charmonia with smaller (larger) momentum in the Brest frame, they populate different regions of the B-decay spectrum. Two sets of non-prompt charmonium MC events are generated according to the following criteria. In the first, each high-Q mode branching fraction is increased by its world-average uncertainty [24] or by 100% of its value if the branching fraction is not measured. Low-Q mode branching fractions are decreased by a similar amount, rescaling the sum to unity after this procedure. In the sec-ond, the treatment of the high- and low-Q modes is interchanged. The maximum difference in the resulting spectra in the two cases is added to the theoretical FONLL uncertainty.
To investigate the effect of the assumed J/ψ and ψ(2S)polarizations on the prompt cross section,
the acceptance is recomputed for four extreme polarization scenarios corresponding to fully longitudinal or fully transverse polarization in the helicity and Collins-Soper frames [25]. This produces relative cross-section shifts across the entire kinematic range of up to 18–20% (20–
25%) for the J/ψ (ψ(2S)) in the helicity frame, and 6–15% for both states in the Collins-Soper
8.2 Prompt and non-prompt cross sections uncorrected for acceptance 13
Table 2: Summary of the relative statistical and systematic uncertainties in the non-prompt
ψ(2S)cross section (in %). The variation over the different pT bins is given for the three
ra-pidity regions. Uncertainties on the prompt cross section are identical, with the exception of
the non-prompt fraction, where they must be regarded as relative to(1− fb)rather than to fb.
Acceptance uncertainties on the FSR are given excluding the lowest-pT bin in every rapidity
region, where it can be as large as 29% because of acceptance edge effects.
|y|range 0−1.2 1.2−1.6 1.6−2.4
Quantity Source Relative uncertainty (in %) affected
All cross sections
mµµfits Statistical 5.6−14.8 7.5−31.7 7.3−24.1 `ψ(2S)fits Statistical 4.3−12.7 5.9−38.0 9.1−26.4 Efficiency Single-muon efficiency 0.1−0.5 0.1−0.6 0.2−0.9
ρfactor 0.7−13.1 2.1−6.6 2.3−9.8 Yields Fit functions 1.2−3.7 0.6−12.1 3.1−10.0
Luminosity Luminosity 4.0 4.0 4.0
Non-prompt Tracker misalignment 0.3−2.6 1.5−7.1 1.8−11.1 fraction b-lifetime model 0.0−2.5 0.4−7.6 0.0−2.9
Vertex estimation 0.0−1.7 0.2−3.5 1.2−4.2 Background fit 1.0−6.8 2.2−10.0 2.5−15.3 Resolution model 0.5−3.5 0.1−4.6 0.9−24.9 Efficiency 0.5−7.8 0.9−6.3 0.5−13.8
Only acceptance-corrected cross sections
Acceptance FSR 0.0−3.9 0.5−3.4 0.3−4.1 pTcalibration 0.2−0.5 0.3−0.5 0.3−0.5 Kinematic spectra 0.1−1.2 0.0−0.9 0.7−2.0 B polarization 0.1−0.8 0.0−0.6 0.2−1.7
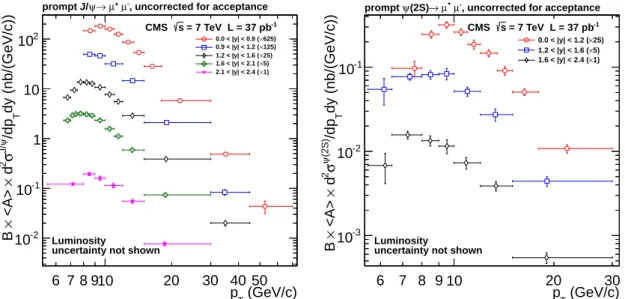
8.2 Prompt and non-prompt cross sections uncorrected for acceptance
As discussed previously, since the polarization effects are large compared to the measurement uncertainties, cross-section values are also reported that are restricted to the CMS muon
accep-tance region, to allow future measurements of the J/ψ and ψ(2S)polarization to be exploited.
Figures 6 and 7 show the measured prompt and non-prompt cross sections for the J/ψ and the
ψ(2S)as a function of pTfor the various rapidity bins and uncorrected for detector acceptance.
Numerical values can be found in Ref. [30].
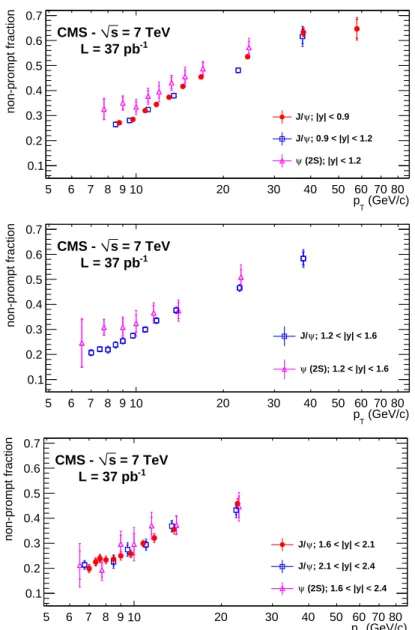
8.3 Non-prompt fractions
The measured non-prompt fractions for J/ψ and ψ(2S)mesons, extracted as described in
Sec-tion 7 and uncorrected for acceptance, are reported in Ref. [30] and shown in Fig. 8. The uncer-tainties shown are statistical and systematic, and the measured values are plotted as a function
of pT in three rapidity ranges. In agreement with previous measurements [4, 7], we observe
similar sizes of non-prompt fractions for J/ψ and ψ(2S), and an increasing trend with pT.
Ac-ceptance corrections do not induce significant changes in the non-prompt fractions within their uncertainties.
8.4 Cross-section ratio
Most of the systematic uncertainties on the acceptances and efficiencies listed in Tables 1 and 2,
as well as the luminosity uncertainty, cancel partially or fully in the ratio of the ψ(2S) to J/ψ
14 8 Results (GeV/c) T p 6 7 8 910 20 30 40 50 dy (nb/(GeV/c)) T /dp ψ J/ σ 2 d × B -2 10 -1 10 1 10 2 10 3 10 (GeV/c) T p 6 7 8 910 20 30 40 50 dy (nb/(GeV/c)) T /dp ψ J/ σ 2 d × B -2 10 -1 10 1 10 2 10 3 10 -1 = 7 TeV L = 37 pb s CMS
Luminosity and polarization uncertainties not shown
, corrected for acceptance -µ + µ → ψ prompt J/ 625) × 0.0 < |y| < 0.9 ( 125) × 0.9 < |y| < 1.2 ( 25) × 1.2 < |y| < 1.6 ( 5) × 1.6 < |y| < 2.1 ( 1) × 2.1 < |y| < 2.4 ( prompt NLO NRQCD (GeV/c) T p 6 7 8 9 10 20 30 dy (nb/(GeV/c)) T /dp (2S) ψ σ 2 d × B -3 10 -2 10 -1 10 1 10 (GeV/c) T p 6 7 8 9 10 20 30 dy (nb/(GeV/c)) T /dp (2S) ψ σ 2 d × B -3 10 -2 10 -1 10 1 10 CMS s = 7 TeV L = 37 pb-1
Luminosity and polarization uncertainties not shown
, corrected for acceptance -µ + µ → (2S) ψ prompt 25) × 0.0 < |y| < 1.2 ( 5) × 1.2 < |y| < 1.6 ( 1) × 1.6 < |y| < 2.4 ( prompt NLO NRQCD
Figure 4: Measured differential cross section for prompt J/ψ and ψ(2S) production (left and
right, respectively) as a function of pT for different rapidity bins. The error bars on the data
points include all the statistical and systematic contributions except luminosity and polariza-tion. The measurements have been offset by the numerical values given in the legend for easier viewing. The coloured (dark) bands indicate the theoretical predictions from NRQCD calcula-tions. The lines are added only for illustrative purposes.
(GeV/c) T p 6 7 8 910 20 30 40 50 dy (nb/(GeV/c)) T /dp ψ J/ σ 2 d × B -1 10 1 10 2 10 (GeV/c) T p 6 7 8 910 20 30 40 50 dy (nb/(GeV/c)) T /dp ψ J/ σ 2 d × B -1 10 1 10 2 10 -1 = 7 TeV L = 37 pb s CMS Luminosity
uncertainty not shown
, corrected for acceptance -µ + µ → ψ non-prompt J/ 625) × 0.0 < |y| < 0.9 ( 125) × 0.9 < |y| < 1.2 ( 25) × 1.2 < |y| < 1.6 ( 5) × 1.6 < |y| < 2.1 ( 1) × 2.1 < |y| < 2.4 ( FONLL (GeV/c) T p 6 7 8 9 10 20 30 dy (nb/(GeV/c)) T /dp (2S) ψ σ 2 d × B -3 10 -2 10 -1 10 1 (GeV/c) T p 6 7 8 9 10 20 30 dy (nb/(GeV/c)) T /dp (2S) ψ σ 2 d × B -3 10 -2 10 -1 10 1 -1 = 7 TeV L = 37 pb s CMS Luminosity
uncertainty not shown
, corrected for acceptance -µ + µ → (2S) ψ non-prompt 25) × 0.0 < |y| < 1.2 ( 5) × 1.2 < |y| < 1.6 ( 1) × 1.6 < |y| < 2.4 ( FONLL
Figure 5: Measured differential cross section for non-prompt J/ψ and ψ(2S)production (left
and right, respectively) as a function of pTfor different rapidity bins. The error bars on the data
points include all the statistical and systematic contributions except luminosity. The measure-ments have been offset by the numerical values given in the legend for easier viewing. The coloured (dark) bands indicate the theoretical predictions from FONLL calculations. The lines are added only for illustrative purposes.
8.4 Cross-section ratio 15 (GeV/c) T p 6 7 8 910 20 30 40 50 dy (nb/(GeV/c)) T /dp ψ J/ σ 2 d × <A> × B 10-2 -1 10 1 10 2 10 -1 = 7 TeV L = 37 pb s CMS Luminosity
uncertainty not shown
, uncorrected for acceptance -µ + µ → ψ prompt J/ 625) × 0.0 < |y| < 0.9 ( 125) × 0.9 < |y| < 1.2 ( 25) × 1.2 < |y| < 1.6 ( 5) × 1.6 < |y| < 2.1 ( 1) × 2.1 < |y| < 2.4 ( (GeV/c) T p 6 7 8 9 10 20 30 dy (nb/(GeV/c)) T /dp (2S) ψ σ 2 d × <A> × B -3 10 -2 10 -1 10 -1 = 7 TeV L = 37 pb s CMS Luminosity
uncertainty not shown
, uncorrected for acceptance -µ + µ → (2S) ψ prompt 25) × 0.0 < |y| < 1.2 ( 5) × 1.2 < |y| < 1.6 ( 1) × 1.6 < |y| < 2.4 (
Figure 6: Measured differential cross section for prompt J/ψ (left) and ψ(2S)(right) production
as a function of pTfor the different rapidity bins. The error bars on data points include all the
statistical and systematic contributions except luminosity. The measurements have been offset by the numerical values given in the legend for easier viewing. The results are not corrected for the muon acceptance.
(GeV/c) T p 6 7 8 910 20 30 40 50 dy (nb/(GeV/c)) T /dp ψ J/ σ 2 d × <A> × B 10-2 -1 10 1 10 2 10 CMS s = 7 TeV L = 37 pb-1 Luminosity
uncertainty not shown
, uncorrected for acceptance -µ + µ → ψ non-prompt J/ 625) × 0.0 < |y| < 0.9 ( 125) × 0.9 < |y| < 1.2 ( 25) × 1.2 < |y| < 1.6 ( 5) × 1.6 < |y| < 2.1 ( 1) × 2.1 < |y| < 2.4 ( (GeV/c) T p 6 7 8 9 10 20 30 dy (nb/(GeV/c)) T /dp (2S) ψ σ 2 d × <A> × B -3 10 -2 10 -1 10 -1 = 7 TeV L = 37 pb s CMS Luminosity
uncertainty not shown
, uncorrected for acceptance -µ + µ → (2S) ψ non-prompt 25) × 0.0 < |y| < 1.2 ( 5) × 1.2 < |y| < 1.6 ( 1) × 1.6 < |y| < 2.4 (
Figure 7: Measured differential cross section for non-prompt J/ψ (left) and ψ(2S)(right)
pro-duction as a function of pTfor the different rapidity bins. The error bars on data points include
all the statistical and systematic contributions except luminosity. The measurements have been offset by the numerical values given in the legend for easier viewing. The result is not corrected for the muon acceptance.
16 8 Results (GeV/c) T p 5 6 7 8 9 10 20 30 40 50 60 70 80 non-prompt fraction 0.1 0.2 0.3 0.4 0.5 0.6 0.7 ; |y| < 0.9 ψ J/ ; 0.9 < |y| < 1.2 ψ J/ (2S); |y| < 1.2 ψ = 7 TeV s CMS - -1 L = 37 pb (GeV/c) T p 5 6 7 8 9 10 20 30 40 50 60 70 80 non-prompt fraction 0.1 0.2 0.3 0.4 0.5 0.6 0.7 ; 1.2 < |y| < 1.6 ψ J/ (2S); 1.2 < |y| < 1.6 ψ = 7 TeV s CMS - -1 L = 37 pb (GeV/c) T p 5 6 7 8 9 10 20 30 40 50 60 70 80 non-prompt fraction 0.1 0.2 0.3 0.4 0.5 0.6 0.7 ; 1.6 < |y| < 2.1 ψ J/ ; 2.1 < |y| < 2.4 ψ J/ (2S); 1.6 < |y| < 2.4 ψ = 7 TeV s CMS - -1 L = 37 pb
Figure 8: Fitted J/ψ and ψ(2S)non-prompt fractions plotted as a function of pTfor three rapidity
regions: 0 < |y| < 1.2 (top); 1.2 < |y| < 1.6 (middle); 1.6 < |y| < 2.4 (bottom). The inner
error bars represent the statistical uncertainties only, the outer ones are the quadratic sum of statistical and systematic uncertainties.
R(pT,|y|) = d2σ dpTdy(ψ(2S)) · B(ψ(2S) →µ + µ−) d2σ dpTdy(J/ψ) · B(J/ψ→µ + µ−) = N corr ψ(2S)(pT,|y|) NJ/ψcorr(pT,|y|) , (11)
where the ratio R is computed in bins of pTand rapidity, and the binning is the same as used
for the ψ(2S)cross section.
The statistical uncertainties affecting R are extracted directly from the simultaneous invariant mass fits. The systematic uncertainties are estimated by considering the same sources as for the cross sections (except the luminosity and single-muon efficiency, which cancel out in the ratio) and evaluating directly the variation of the ratio, in order to take correlations into account. No significant dependence of R on rapidity is observed; the ratios over the entire rapidity range are therefore computed. The resulting prompt and non-prompt cross-section ratios are shown
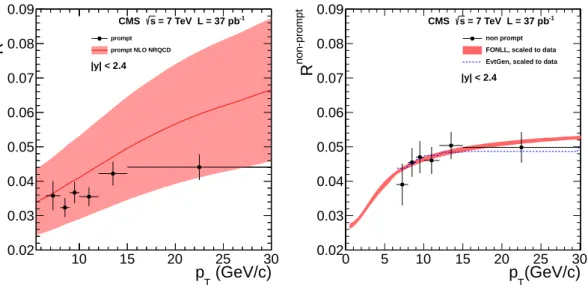
8.5 InclusiveB→ψ(2S)X branching fraction 17 (GeV/c) T p 10 15 20 25 30 prompt R 0.02 0.03 0.04 0.05 0.06 0.07 0.08 0.09 prompt prompt NLO NRQCD -1 = 7 TeV L = 37 pb s CMS |y| < 2.4 (GeV/c) T p 0 5 10 15 20 25 30 non-prompt R 0.02 0.03 0.04 0.05 0.06 0.07 0.08 0.09 non prompt FONLL, scaled to data EvtGen, scaled to data -1 = 7 TeV L = 37 pb s
CMS
|y| < 2.4
Figure 9: Measured value of R, the ψ(2S) to J/ψ differential cross-section ratio defined in
Eq. 11, for prompt (left) and non-prompt (right) production, averaged over rapidity and
plot-ted as a function of pT. The left plot also includes the comparison with the NRQCD
predic-tion, while the right plot shows the predictions of the theoretical models used to determine
B(B → ψ(2S)X), after the latter have been rescaled to the fitted value given in Eq. (12). The
shaded bands show the uncertainties on the theoretical predictions. The error bars give the total uncertainties on the measurements; polarization uncertainties are not included.
in Fig. 9 as a function of pT. Numerical values of rapidity-dependent and integrated ratios are
given in Ref. [30].
The assumptions on polarization also affect the prompt cross-section ratio measurement. In
a plausible scenario [31], the polarizations of the directly produced J/ψ and ψ(2S) states are
assumed to be the same. Therefore the uncertainty on the ratio comes only from the difference between the polarization of the directly produced mesons and the polarization of the J/ψ
com-ing from decays of P-wave states (χc1and χc2), for which the maximum possible variations are
considered. Using the measured feed-down fractions measured at CDF [32, 33], this leads to the definition of the two extreme scenarios:
• λψθ(2S) =1, λJ/ψθ =0.445;
• λψθ(2S) = −1, λJ/ψθ = −0.647;
which result in changes to the measured prompt cross-section ratio by 12−20%.
8.5 Inclusive B
→
ψ(
2S)
X branching fractionThe non-prompt ψ(2S) cross-section results can be used to determine B(B → ψ(2S)X), the
average inclusive branching fraction of all weakly decaying particles containing a bquark to
ψ(2S).
Since the results are determined only for a limited range of phase space, a theoretical assump-tion is needed to extrapolate to the full phase space. The most precise result is obtained using the non-prompt cross-section ratio, where most theoretical uncertainties cancel. The FONLL
model is used for the result, taking as an alternative the EVTGENprediction to determine a
systematic uncertainty.
18 9 Summary
assuming the world-average values, listed by the Particle Data Group (PDG) [24], ofBPDG(B→
J/ψ X), BPDG(ψ(2S) → µ+µ−), and BPDG(J/ψ → µ+µ−)(the branching fractions taken from
the PDG are indicated as BPDG). In both models the production cross section for each type
of B meson or baryon is weighted using the values of the fractions f(b → B0), f(b → B±),
f(b →B0s), and f(b→ Λ0
b), taken from LEP and Tevatron measurements. The predictions are
then fitted to the data points, leaving only the normalization (N) as a free parameter. A good
agreement in the shape of the pTdistribution is found for both models. The branching fraction
B(B→ψ(2S)X)is then derived from the fitted normalization.
In addition to the fit uncertainty, including statistical and systematic uncertainties on the single
measurements (±3.8%), the following sources of uncertainty are considered (with the
corre-sponding relative∆Buncertainty given in parentheses):
• PDG branching fractions. The uncertainties quoted by the PDG for B(B → J/ψ X),
B(ψ(2S) →µ+µ−), andB(J/ψ →µ+µ−)are summed in quadrature (13.5%).
• Model assumptions. The EVTGEN prediction is used for an alternative fit and the
difference with respect to the nominal N value is taken as a systematic uncertainty (1.0%).
• FONLL uncertainties. All uncertainties on the underlying bb cross section, discussed
in Section 8.1, are assumed to be fully correlated between B → J/ψ X and B →
ψ(2S)X transitions. Residual uncertainties affecting the cross-section ratio
predic-tion are used to perform alternative fits and the differences with respect to the nom-inal value of N are taken as systematic uncertainties (1.5%).
• B →charmonium spectrum theoretical uncertainties. The only source of theoretical
un-certainty which is not correlated is the one on the B →charmonium spectrum. We
use the high-Q and low-Q method to estimate this uncertainty as detailed in Sec-tion 8.1. In order to obtain an upper limit on the uncertainty of this ratio, the high-Q
sample of B →J/ψX is compared to the low-Q B→ψ(2S)X sample and vice versa.
The average difference in N with respect to the nominal EVTGENprediction is taken
as a systematic uncertainty (3.8%). The measured value is:
B(B→ψ(2S)X) = (3.08±0.12(stat.+syst.) ±0.13(theor.) ±0.42(BPDG)) ·10−3, (12) where the last uncertainties are from the world-average branching fractions and the theoret-ical variations, respectively. The result is in agreement with the current world-average value
from LEP and Tevatron measurements (BPDG(B → ψ(2S)X) = (4.8±2.4) ·10−3 [24]), while
improving the relative uncertainty by a factor of three.
9
Summary
A measurement of the J/ψ and ψ(2S)production cross sections in pp collisions at√s = 7 TeV
with the CMS experiment at the LHC has been presented. The data sample corresponds to
an integrated luminosity of 36.7±1.5 pb−1. The two cross sections and their ratio have been
measured as a function of the meson transverse momentum (up to 70 GeV/c for the J/ψ and to
30 GeV/c for the ψ(2S)) in several rapidity ranges. Cross sections for prompt and non-prompt
production have been determined from the measured values of the J/ψ and ψ(2S)non-prompt
fractions.
19
well as four other polarization scenarios. In addition, cross sections restricted to the acceptance of the CMS detector are given, which are not affected by the polarization of the charmonium states.
Cross sections for prompt and non-prompt production have been compared with NRQCD and FONLL predictions, respectively. Agreement is found in the prompt case: this is particularly
re-markable in the ψ(2S)case, where theoretical uncertainties are reduced because of the absence
of feed-down from heavier charmonium states. In the non-prompt case, general agreement in
shape is found for ψ(2S)in the entire pTrange considered (up to 30 GeV/c), but an overall scale
discrepancy is observed, possibly because of the assumption on the inclusive branching
frac-tionB(B→ψ(2S)X). For J/ψ there is similarly general agreement over the above range, while
the predictions overestimate the measured differential cross-sections for 30< pT <70 GeV/c.
For plausible hypotheses on the polarizations of the two charmonium states the ratio of their differential cross sections is obtained. In this ratio systematic errors largely cancel. The
inclu-sive branching fraction B(B → ψ(2S)X) is extracted from the ratio of the non-prompt cross
sections to be:
B(B→ψ(2S)X) = (3.08±0.12(stat.+syst.) ±0.13(theor.) ±0.42(BPDG)) ×10−3, improving the relative uncertainty on the previous world average by a factor of three.
Acknowledgements
We would like to thank Yan-Qing Ma for providing theoretical predictions in NLO NRQCD and Matteo Cacciari for predictions in the FONLL scheme and useful discussions.
We wish to congratulate our colleagues in the CERN accelerator departments for the excellent performance of the LHC machine. We thank the technical and administrative staff at CERN and other CMS institutes. This work was supported by the Austrian Federal Ministry of Science and Research; the Belgium Fonds de la Recherche Scientifique, and Fonds voor Wetenschappelijk Onderzoek; the Brazilian Funding Agencies (CNPq, CAPES, FAPERJ, and FAPESP); the Bul-garian Ministry of Education and Science; CERN; the Chinese Academy of Sciences, Ministry of Science and Technology, and National Natural Science Foundation of China; the Colom-bian Funding Agency (COLCIENCIAS); the Croatian Ministry of Science, Education and Sport; the Research Promotion Foundation, Cyprus; the Estonian Academy of Sciences and NICPB; the Academy of Finland, Finnish Ministry of Education and Culture, and Helsinki Institute of Physics; the Institut National de Physique Nucl´eaire et de Physique des Particules / CNRS, and Commissariat `a l’ ´Energie Atomique et aux ´Energies Alternatives / CEA, France; the Bundes-ministerium f ¨ur Bildung und Forschung, Deutsche Forschungsgemeinschaft, and Helmholtz-Gemeinschaft Deutscher Forschungszentren, Germany; the General Secretariat for Research and Technology, Greece; the National Scientific Research Foundation, and National Office for Research and Technology, Hungary; the Department of Atomic Energy and the Department of Science and Technology, India; the Institute for Studies in Theoretical Physics and Mathe-matics, Iran; the Science Foundation, Ireland; the Istituto Nazionale di Fisica Nucleare, Italy; the Korean Ministry of Education, Science and Technology and the World Class University program of NRF, Korea; the Lithuanian Academy of Sciences; the Mexican Funding Agencies (CINVESTAV, CONACYT, SEP, and UASLP-FAI); the Ministry of Science and Innovation, New Zealand; the Pakistan Atomic Energy Commission; the State Commission for Scientific Re-search, Poland; the Fundac¸˜ao para a Ciˆencia e a Tecnologia, Portugal; JINR (Armenia, Belarus, Georgia, Ukraine, Uzbekistan); the Ministry of Science and Technologies of the Russian Feder-ation, the Russian Ministry of Atomic Energy and the Russian Foundation for Basic Research;
20 9 Summary
the Ministry of Science and Technological Development of Serbia; the Ministerio de Ciencia e Innovaci ´on, and Programa Consolider-Ingenio 2010, Spain; the Swiss Funding Agencies (ETH Board, ETH Zurich, PSI, SNF, UniZH, Canton Zurich, and SER); the National Science Council, Taipei; the Scientific and Technical Research Council of Turkey, and Turkish Atomic Energy Authority; the Science and Technology Facilities Council, UK; the US Department of Energy, and the US National Science Foundation.
Individuals have received support from the Marie-Curie programme and the European Re-search Council (European Union); the Leventis Foundation; the A. P. Sloan Foundation; the Alexander von Humboldt Foundation; the Belgian Federal Science Policy Office; the Fonds pour la Formation `a la Recherche dans l’Industrie et dans l’Agriculture (FRIA-Belgium); the Agentschap voor Innovatie door Wetenschap en Technologie (IWT-Belgium); and the Council of Science and Industrial Research, India.
21
References
[1] P. Artoisenet, J. P. Lansberg, and F. Maltoni, “Hadroproduction of J/ψ andΥ in
association with a heavy-quark pair”, Phys. Lett. B 653 (2007) 60.
doi:10.1016/j.physletb.2007.04.031.
[2] P. Artoisenet, F. Maltoni, and T. Stelzer, “Automatic generation of quarkonium amplitudes in NRQCD”, JHEP 02 (2008) 102.
doi:10.1088/1126-6708/2008/02/102.
[3] Y.-Q. Ma, K. Wang, and K.-T. Chao, “J/ψ(ψ0)production at the Tevatron and LHC at
O(α4sv4)in nonrelativistic QCD”, Phys. Rev. Lett. 106 (2011) 042002,
arXiv:1009.3655. doi:10.1103/PhysRevLett.106.042002.
[4] CDF Collaboration, “Production of ψ(2S) mesons in p ¯p collisions at 1.96 TeV”, Phys. Rev. D 80 (2009) 031103. doi:10.1103/PhysRevD.80.031103.
[5] M. Cacciari, M. Greco, and P. Nason, “The pTspectrum in heavy-flavour
hadroproduction”, JHEP 05 (1998) 007. doi:10.1088/1126-6708/1998/05/007.
[6] M. Cacciari, S. Frixione, and P. Nason, “The pTspectrum in heavy-flavour
photoproduction”, JHEP 03 (2001) 006. doi:10.1088/1126-6708/2001/03/006.
[7] CMS Collaboration, “Prompt and non-prompt J/ψ cross sections in pp collisions at√
s =7 TeV”, Eur. Phys. J. C 71 (2011) 1575.
doi:10.1140/epjc/s10052-011-1575-8.
[8] ATLAS Collaboration, “Measurement of the differential cross-sections of inclusive,
prompt and non-prompt J/ψ production in proton-proton collisions at√s =7 TeV”,
Nucl. Phys. B 850 (2011) 442. doi:10.1016/j.nuclphysb.2011.05.015.
[9] LHCb Collaboration, “Measurement of J/ψ production in pp collisions at√s=7 TeV”,
Eur. Phys. J. C 71 (2011) 1645. doi:10.1140/epjc/s10052-011-1645-y.
[10] ALICE Collaboration, “Rapidity and transverse momentum dependence of inclusive J/ψ
production in pp collisions at√s =7 TeV”, Phys. Lett. B 704 (2011) 442.
doi:10.1016/j.physletb.2011.09.054.
[11] D. J. Lange, “The EVTGENparticle decay simulation package”, Nucl. Instrum. Meth. A
462(2001) 152. doi:10.1016/S0168-9002(01)00089-4.
[12] BaBar Collaboration, “Study of inclusive production of charmonium mesons in B decays”, Phys. Rev. D 67 (2003) 032002. doi:10.1103/PhysRevD.67.032002. [13] CMS Collaboration, “The CMS experiment at the CERN LHC”, JINST 03 (2008) S08004.
doi:10.1088/1748-0221/3/08/S08004.
[14] CMS Collaboration, “Absolute luminosity normalization”, CMS Detector Performance Summary CERN-CMS-DP-2011-002, (2011).
[15] T. Sj ¨ostrand, S. Mrenna, and P. Z. Skands, “PYTHIA6.4 physics and manual”, JHEP 05
(2006) 026. doi:10.1088/1126-6708/2006/05/026.
[16] M. Kr¨amer, “Quarkonium production at high-energy colliders”, Prog. Part. Nucl. Phys.
22 9 Summary
[17] M. Bargiotti and V. Vagnoni, “Heavy quarkonia sector in PYTHIA 6.324: tuning, validation and perspectives at LHC(b)”, CERN report LHCb-2007-042, (2007).
[18] E. Barberio, B. van Eijk, and Z. Wa¸s, “PHOTOS- a universal Monte Carlo for QED
radiative corrections in decays”, Comput. Phys. Commun. 66 (1991) 115.
doi:10.1016/0010-4655(91)90012-A.
[19] E. Barberio and Z. Wa¸s, “PHOTOS- a universal Monte Carlo for QED radiative
corrections: version 2.0”, Comput. Phys. Commun. 79 (1994) 291.
doi:10.1016/0010-4655(94)90074-4.
[20] CMS Collaboration, “Precise mapping of the magnetic field in the CMS barrel yoke using cosmic rays”, JINST 05 (2010) T03021. doi:10.1088/1748-0221/5/03/T03021. [21] CMS Collaboration, “Studies of Tracker Material in the CMS Detector”, CMS Physics
Analysis Summary CMS-PAS-TRK-10-003, (2010).
[22] CMS Collaboration, “Alignment of the CMS silicon tracker during commissioning with cosmic rays”, JINST 5 (2010) T03009. doi:10.1088/1748-0221/5/03/T03009.
[23] J. E. Gaiser, “Charmonium Spectroscopy from Radiative Decays of the J/ψ and ψ0”. PhD
thesis, SLAC, 1982. SLAC-R-255, Appendix F.
[24] Particle Data Group Collaboration, “2010 Review of Particle Physics”, J. Phys. G 37 (2010) 075021. doi:10.1088/0954-3899/37/7A/075021.
[25] P. Faccioli et al., “Towards the experimental clarification of quarkonium polarization”, Eur. Phys. J. C 69 (2010) 657. doi:10.1140/epjc/s10052-010-1420-5.
[26] CMS Collaboration, “Measurement of Momentum Scale and Resolution using Low-mass Resonances and Cosmic Ray Muons”, CMS Physics Analysis Summary
CMS-PAS-TRK-10-004, (2010).
[27] CMS Collaboration, “Performance of muon identification in pp collisions at√s = 7 TeV”,
CMS Physics Analysis Summary CMS-PAS-MUO-10-002, (2010).
[28] CMS Collaboration, “Measurement of Tracking Efficiency”, CMS Physics Analysis Summary CMS-PAS-TRK-10-002, (2010).
[29] G. Punzi, “Comments on likelihood fits with variable resolution”, in Proceedings of the PHYSTAT 2003 conference. 2003. arXiv:physics/0401045.
[30] CMS Collaboration. Numerical results for this paper: http:
//twiki.cern.ch/twiki/bin/view/CMSPublic/PhysicsResultsBPH10014.
[31] P. Faccioli, C. Lourenc¸o, J. Seixas et al., “Determination of χcand χbpolarizations from
dilepton angular distributions in radiative decays”, Phys. Rev. D 83 (2011) 096001. doi:10.1103/PhysRevD.83.096001.
[32] CDF Collaboration, “Production of J/ψ mesons from χ√ cmeson decays in p ¯p collisions at
s = 1.8 TeV”, Phys. Rev. Lett. 79 (1997) 578. doi:10.1103/PhysRevLett.79.578.
[33] CDF Collaboration, “Measurement of σχc2B(χc2→J/ψγ)/σχc1B(χc1→J/ψγ)in p ¯p
Collisions at√s = 1.96 TeV”, Phys. Rev. Lett. 98 (2007) 232001.


![Figure 3: Left: Projection of a J/ ψ two-dimensional fit on the ` J/ ψ dimension in the bin | y | < 0.9, 8 < p T < 9 GeV/c and in the whole mass region [2.50, 3.35] GeV/c 2](https://thumb-eu.123doks.com/thumbv2/123dok_br/15695762.1066358/12.892.145.742.452.803/figure-left-projection-dimensional-dimension-gev-mass-region.webp)