MARIA CLARISSE
SILVA FERREIRA
ABUNDÂNCIA E DIVERSIDADE DE CRUSTÁCEOS
DOS CANHÕES PORTUGUESES
Dissertação apresentada à Universidade de Aveiro para cumprimento dos requisitos necessários à obtenção do grau de Mestre em Biologia Marinha, realizada sob a orientação científica da Professora Doutora Marina Ribeiro da Cunha, Professora Auxiliar do Departamento de Biologia da Universidade de Aveiro
o júri
Presidente Prof.º Dr.º Victor Manuel dos Santos Quintino
Professor auxiliar do Departamento de Biologia da Universidade de Aveiro
Prof.ª Dr.ª Maria Marina Pais Ribeiro da Cunha
Professora auxiliar do Departamento de Biologia da Universidade de Aveiro
Doutor Ricardo Jorge Guerra Calado
Investigador auxiliar do Centro de Estudos do Ambiente e do Mar da Universidade de Aveiro
agradecimentos Nasci numa aldeia perto do mar. O meu avô materno foi pescador e morreu
com as sequelas que o mar sabe deixar nas gentes desta faina. Sem saber porquê ou como, aprendi a amar os “bichos”. A biodiversidade sempre esteve perto de mim, escolhi tirar um curso de Biologia e Geologia para poder ensinar às novas gerações a respeitarem a riqueza natural do nosso planeta. Neste caminho traçado pela ciência e pela experimentação, de centro de ciência em centro de ciência, de destacamento em destacamento, inspirada na riqueza de espécies das poças de maré da praia da Aguda e na Estação Litoral da Aguda, resolvi aprofundar os meus conhecimentos sobre os seres que habitam as profundezas do Oceano Atlântico, mais precisamente sobre os crustáceos que vivem nos canhões submarinos portugueses. A entrevista da investigadora Teresa Amaro sobre a fauna destes lugares inóspitos e sem luz foi crucial na tomada da decisão. Ter encontrado a minha professora de Ecologia -Professora Doutora Marina Cunha foi sem dúvida uma agradável surpresa e agradeço-lhe a possibilidade de integrar a equipa de investigação do Laboratório de Ecologia Marinha e Estuarina (LEME) e de usufruir dos seus ensinamentos, que não serão guardados, mas serão utilizados quer para ensinar quer para comunicar ciência. Ainda, por despertar em mim o gosto pelos crustáceos peracarídeos.
Quero agradecer ao Capitão, equipa multidisciplinar do Projecto HERMES e toda a tripulação dos cruzeiros, RRS Discovery (NOCS) 297, RRS Charles Darwin (NOCS) 179 e RV Pelagia (NIOZ) 64PE252.
Aos meus superiores hierárquicos que acompanharam o decorrer deste trabalho e sempre valorizaram a investigação no oceano profundo proporcionando-me a possibilidade de realizar mais um sonho da minha vida, deixo aqui um agradecimento especial. Aos colegas da equipa do LEME e da Fábrica – Centro Ciência Viva da Universidade de Aveiro que respirando, transpirando, investigando ou divulgando Ciência, contribuíram de forma directa ou indirecta para a finalização deste trabalho.
Por fim, mas não menos importante à memória do meu pai e à minha família, especialmente à minha mãe que me mostrou a beleza e desenvolveu em mim desde pequenina o sentimento de respeito pelo Mar, pelos seres vivos que o habitam e que sempre me deu apoio nas horas mais difíceis da minha vida. Ao meu marido agradeço toda a atmosfera com a qual pude levar avante dois anos de trabalho; e ao meu filho, as horas em que fez o trabalho de casa, enquanto a mãe contava e tentava identificar os pequeninos crustáceos, no laboratório.
“No one ought to feel surprise at much remaining as yet unexplained in regard to the origin of species and varieties, if he make due allowance for our profound ignorance in regard to the mutual relations of the many beings which live around us. Who can explain why one species ranges widely and is very numerous, and why another allied species has a narrow range and is rare? Yet these relations are of the highest importance, for they determine the present welfare and, as I believe, the future success and modification of every inhabitant of this world.”
resumo O conhecimento da fauna de crustáceos que habita os fundos marinhos, particularmente a dos ecossistemas existentes nos canhões é escasso. Esta tese investiga a abundância e diversidade de crustáceos dos canhões centrais de Portugal: Nazaré, Cascais e Setúbal e taludes adjacentes. Contribui para o conhecimento de padrões na estrutura da comunidade de crustáceos e pretende identificar diferenças entre as amostras recolhidas nos taludes e canhões e entre canhões, relacionando-as com o gradiente vertical de profundidade e gradiente vertical no sedimento, ao nível de espécie.
A amostragem decorreu em Agosto de 2005, com o cruzeiro RRSDiscovery (D297-NOCS), entre Abril e Maio de 2006, com o cruzeiro RRS Charles Darwin (CD179-NOCS) e em Setembro de 2006, com o cruzeiro RV Pelagia (64PE252-NIOZ). As amostras foram recolhidas usando USNEL-box corer (área=0.25m2), UKORS megacorer (área=0,00785m2) e NIOZ box corer (área=0.196m2) respectivamente. Num total de 1260 indivíduos descritos e 157 taxa, 6 ordens, 9 sub-ordens e 47 famílias. Tanaidacea foi a ordem mais abundante seguida da ordem Isopoda (grupo com maior número de espécies, 61 taxa), Amphipoda, e finalmente Cumacea. Os decápodes e misídaceos foram os grupos com menor abundância. O padrão na distribuição vertical no sedimento indica que geralmente existe uma diminuição na densidade, de 0-1 até 5-10 cm. Estes animais revelam uma diversidade de estilos de vida e formas de se alimentar, ficando muitas vezes enterrados e alimentando-se de detritos, vivendo principalmente nas camadas superficiais ou sub-superficiais. A análise multivariavel das amostras revela diferenças significativas entre canhões e taludes; nos canhões e entre canhões e também entre amostradores/ano e profundidade. As comparações entre canhões indicam que existe uma maior similaridade entre as amostras dos canhões de Cascais e da Nazaré, do que entre estes canhões e o canhão da Nazaré. Sendo que o último exibe uma maior dominância de espécies, menor riqueza de taxa e maior abundância. As amostras de Cascais e de Setúbal apresentam maior equitatibilidade e maior diversidade. A 3400m todas as amostras recolhidas dos canhões apresentam uma maior abundância e riqueza de espécies, quando comparadas com as amostras recolhidas a 4300m. Estes padrões são discutidos tendo em atenção dados ambientais destes habitats, publicados recentemente.
Os resultados ilustram uma riqueza elevada de espécies e heterogeneidade nas amostras dos crustáceos peracarídeos dos canhões portugueses, sugerindo que a comunidade de crustáceos, das diferentes áreas analisadas, apresenta uma grande variabilidade na composição ao nível de espécie. Em conclusão, a conservação da biodiversidade dos canhões, nomeadamente dos portugueses, pode ser crucial para a sustentabilidade e o funcionamento do maior ecossistema da biosfera.
abstract Knowledge of the deep-sea crustacean faunal composition, particularly on canyon ecosystems is scarce. This thesis investigates crustacean abundance and diversity from central Portuguese submarine canyons: Nazaré, Cascais and Setúbal and adjacent slopes. Contribute to the knowledge of crustacean assemblages patterns and aimed to identify differences between open slope and canyon, between canyons assemblages and related to the depth and sediment gradients at species level.
Sampling was performed in August 2005 during RRS Discovery cruise (D297-NOCS), between April and May 2006 during RRS Charles Darwin cruise (CD179-NOCS) and in September 2006 during RV Pelagia (64PE252-NIOZ) cruise. Samples were collected using: USNEL-pattern box corer (area=0.25m2), UKORS megacorer (area=0,00785m2) and NIOZ circular box corer (area=0.196m2) respectively. A total of 1260 specimens were ascribed to 157 nominal taxa, 6 orders, 9 subOrders and 47 families. Tanaidacea was the most abundant followed by Isopoda (the most speciose group with 61 taxa), Amphipoda, and finally Cumacea. Decapods and mysids were the groups with lowest abundance. The trends in the vertical distribution within the sediment indicate generally that there is a decreasing in density from 0-1 to 5-10cm. These animals show a diversity of life styles and ways of feeding, they are burrowing detritivore peracarids species that live mainly in the surface or subsurface. Multivariate analyses of samples revealed significative differences between: canyons and open slopes; within and between canyons and also sampling gear/year and depths. The comparisons between canyons indicate higher similarities between the assemblages of Cascais and Setúbal than between these canyons and Nazaré. The latter exhibits greater dominance, lower taxa richness and higher abundance. The Cascais and Setúbal assemblages are more evenness and revel higher diversity. At 3400m all the canyons revel a higher abundance and diversity when compare to the 4300m assemblages. These patterns are discussed attending environmental conditions in these particular deep sea habitats.
The results illustrate the high taxa richness and heterogeneity of peracarida crustacean assemblages in Portuguese canyons, suggest that community structure of the different areas analyzed show a great variability in species composition. In conclusion, the conservation of deep-sea biodiversity of Portuguese canyons can be crucial for the sustainability of the functions of the largest ecosystem of biosphere.
INTRODUCTION ... 1
1.1 Deep Sea Biodiversity and Habitats ... 1
1.2 West Iberian Margin ... 5
1.2.1 North Atlantic Oceanography ... 5
1.2.2 Submarine Canyons ... 6
1.3 Crustacean Fauna ... 7
1.3.1 Systematics and Morphology ... 7
1.4 Study Context ... 10
1.4.1 Aims of the Study ... 10
METHODOLOGY ...
11
2.1 Study Area ... 11
2.2 Sample Collection and Processing ... 12
2.3 Data Analysis ... 15
2.3.1 Univariate and Distributional Analyses ... 15
2.3.2 Multivariate Analysis... 16
RESULTS ... 17
3.1 Vertical Distribution Within the Sediment ... 21
3.2 Canyons vs Open Slopes (64PE252 cruise) ... 24
3.3 Variability Within and Between Canyons (CD179 cruise) ... 27
3.4 Variability Between Sampling Gears/Years (D297 and CD197 cruises) ... 31
DISCUSSION AND CONCLUSION ... 34
REFERENCES ... 38
Appendix 1 - Taxonomic List of The Collected Species ... 43
Appendix 2 - Amphipoda Plates ... 53
factors on species richness of local communities (adapted from Levin et al. 2001) ... 4 Figure 2: Anatomy and diversity in some peracarid crustaceans, AMP=amphipods, ISO=isopods, TAN=tanaids, CUM=cumaceans and MYS=mysids (adapted from Brusca & Brusca 2003) ... 8
Figure 3: Anatomy and diversity in Isopoda. A 1st= first antennae, A 2nd= second antennules, E=eye, H=head, M=marsupium, PE=pereon, PL=pleon, T=telson and U=urosome ... 8
Figure 4: Bathymetric map of the 11 sampling stations, from central Portuguese canyons (NC-Nazaré Canyon, CC-Cascais Canyon and SC-Setúbal Canyon), during 2005 (D297) and 2006 (CD179 and 64PE252) ... 12 Figure 5: Procedure adopted on the three cruises, resulting: A=0-1cm, B=1-3cm, C=3-5cm, D=5-10cm, E=10-15cm and F=15-20cm sediment layers ... 15 Figure 6: Crustacean specimen examined showing a total of 1260 individuals, data collected during D297, CD179 and 64PE252 cruises, between 2005 and 2006. AMP (Amphipoda), ISO (Isopoda), CUM (Cumacea), TAN (Tanaidacea), MYS (Mysidacea) and DEC (Decapoda) ... 17 Figure 7: Species richness in the different sampling station from the Portuguese Canyons. The values are pooled from all replicates in one site. Samples taken in the same site at consecutive years (Nazaré 3400m and 4300m) were kept separate.*Samples taken during D297 in 2005 ... 18 Figure 8: Crustacean abundance in the different studied sites, during D297, CD179 and 64PE252 cruises. The values are averages from the replicates taken in each site expressed as ind.m-². Samples taken in the same site at consecutive years (Nazaré 3400m and 4300m) were kept separate. *Samples taken during D297 in 2005 ... 19 Figure 9: Composition and structure of the crustacean assemblages from the study sites in the Portuguese canyons: Nazaré (N), Cascais (C), and Setúbal (S) and Open slope South Nazaré (OSO) and Open slope Sines (OSO) at 1000, 3400 and 4300m of depth, until subOrder taxonomic level ... 20 Figure 10: Vertical distribution of crustacean fauna within the sediment (ind.m-2). Data from Nazaré canyon at 3400m and 4300m depths, obtained during D297 cruise, in 2005.21 Figure 11: Vertical distribution of crustacean fauna within the sediment (ind.m-²). Data from Nazaré, Cascais and Setúbal canyons at 3400m and 4300m depths, obtained during CD179 cruise, in 2006 ... 22
Figure 13: MDS plot of the analysis performed on the crustacean data from samples collected during 64PE252 cruise. Labels of sampling station as in Table 2 ... 25 Figure 14: k –dominance curves for the five 64PE252 cruise sampling sites ... 26
Figure 15: MDS plot of the analysis performed on the crustacean data from samples collected during CD179 cruise. Labels of sampling station as in Table 2 ... 28 Figure 16: k –dominance curves for the twenty seven CD179 cruise sampling sites ... 30
Figure 17: MDS plot of the analysis performed on the crustacean data from samples collected in Nazaré canyon during D297 and CD179 cruises. Labels of sampling station as in Table 2 ... 31 Figure 18: k –dominance curves for the fourteen D279 and CD179 cruises sampling sites.33
1983; Bacescu & Petrescu 1999; Gutu & Sieg 1999; Nouvel, Casanova & Lagardere, 1999; Roman & Dalens 1999 and Santinni 1999).. ... 9 Table 2: List of the samples taken for crustacean fauna in the Portuguese canyons during HERMES cruises: RSS Discovery (D297-2005), RSS Charles Darwin (CD179-2006) and RV Pelagia (64PE252-2006), using USNEL box core, UKORS megacore and NIOZ box core, respectively. Samples were taken in Nazaré (N), Cascais (C) and Setúbal (S) canyons and open slopes (OSO South of Nazaré, OSI off Sines) ... 13 Table 3: Univariate biodiversity indices for each station sampled during D297, CD179 and 64PE252 cruises. Values are average from replicates in each station: n= number of replicates; S= number of species; N= densities (ind.m-²); J’= Pielou’s evenness index and H’ (log e)= Shannon-Wiener diversity index... 19 Table 4: Univariate biodiversity indices for the five stations sampled during 64PE252 cruise. Values are average from replicates in each station: n= number of replicates; S= number of species; N= densities (ind.m-²); J’= Pielou’s evenness index and H’ (log e)= Shannon-Wiener diversity index ... 26 Table 5: Six dominant crustacean species for each studied site and depth (canyons and slopes; 1000 m, 3400 m and 4300 m) expressed in percentage.*Dominant species obtained during D297 cruise were kept separate ... 27
Table 6: Results of the ANOSIM global and pairwise tests for the MDS performed for the samples collected during CD179 cruise. Two-way crossed analysis; Factors: depth (3400 and 4300m); site N (Nazaré), S (Setúbal) and C (Cascais) ... 29
Table 7: Univariate biodiversity indices for the 27 stations sampled during 27 CD179 cruise. Values are average from replicates in each station: n= number of replicates; S= number of species; N= densities (ind.m-2); J’= Pielou’s evenness index and H’(log e)= Shannon-Wiener diversity index ... 30 Table 8: Results of the ANOSIM global tests for the MDS performed for the samples collected during D297 and CD179 cruises. Two-way crossed analysis, factors: depth (3400 and 4300m) and sampler/year (Box core/2005 and megacore/2006) in Nazaré Canyon.. 32 Table 9: Univariate biodiversity indices for the 14 stations sampled with a box-core during the D297 cruise (2005) and with a megacore during the CD179 cruise (2006). Values are average from replicates in each station: n= number of replicates; S= number of species; N= densities (ind.m-2); J’= Pielou’s evenness index and H’(log e)= Shannon-Wiener diversity index ... 33
I
NTRODUCTION
1.1 Deep sea Biodiversity and Habitats
The oceans cover three quarters of the earth’s surface and have a huge impact on the biosphere. The largest ecosystem on earth is not an environment with stable conditions; it is in fact very dynamic throughout time. However, the hydrologic, physical and chemical characteristics divide the oceans in four main ecological zones: one euphotic sublittoral or coastal zone (low water to 200m), and three deep-sea zones where sunlight penetration is to low to support primary production - bathyal (from 200 to 2000m), abyssal (2000 to 6000m), and hadal (more than 6000m) (Gage & Tyler 1991). The coastal waters occupy about 5% of the world’s oceans, and the average depth of the oceans is approximately 3.8 kilometres with 88% are deeper than 1000m (Herring 2002). Up to now only 0.0001% of the deep sea floor has been investigated by biologists (UNEP 2007).
Our knowledge of the deep sea benthic boundary organisms and environmental conditions is intimately related to the evolution of the scientific methods. Qualitative and quantitative methods such as, box cores, multicores, epibenthic sledges, multibeam bathymetry, sidescan sonar; showed the outstanding heterogeneity of the deep sea habitats inhabited by a diversity of organisms with different shapes, sizes and life styles (Gage & Tyler 1991). In the last twenty to twenty - five years oceanographic research vessels with sophisticated sampling gear and research submersibles are being used to further explore this deep sea biodiversity in a variety of geological features, such as canyons, seamounts, hydrothermal vents and cold seeps (Gage & Tyler 1991; UNEP 2007) that is now acknowledged as playing a crucial role for the health and sustainability of all the ocean’s ecosystems (Smith & Hughes 2008).
The tridimensional environment of the oceans exhibits several gradients of abiotic factors such as: pressure, temperature, salinity, oxygen, sediment type, organic matter,
seasonality, disturbance and bottom currents. Hydrostatic pressure is one of the most predictable gradients; 1 atmosphere increase per 10 m depth (Gage & Tyler 1991). The temperature at the deep seafloor usually varies from ca. -1° to 4°C, but in the Antarctic waters it may reach -1.9°C (Sverdrup et al. 1942). In most oceans the temperature reach ~ 0.8°C at 1300m, although in North Atlantic ocean the 4°C isotherm is located at about 4000m, owing to the influence of the Mediterranean outflow (Gage & Tyler 1991). At depths greater than 2000m the salinity is ca. 34.8psu ±0.3 reaching 34.65psu in deeper regions (Sverdrup et al. 1942). Oxygen concentration is usually near saturation but may reach minimum values at ca. 500 to 600m in certain geographical regions (Gage & Tyler 1991). The sediment type in the deep sea is predominantly characterized by very fine grain sizes but other sediments such as coarse sediments of terriginous origin, mud from submarine volcanoes, rocky outcrops at the oceanic ridges and seamounts, deposits around hydrothermal vents and others play an important role in creating heterogeneous habitats inhabited by different organisms.
Considering that deep-sea organisms live in the absence of sunlight, the biodiversity of the assemblages depends on factors other than the photosynthetic primary production, such as the input of material from the photic zone and localised sources of chemosynthetic production. According to Brunel (2006) benthic animals, seaweeds and protists account for 98% of marine species biodiversity, the remaining 2% being pelagic. The deep sea prevailing heterotrophic benthic assemblages depends on autotrophic production from the photic zone to obtain organic matter. The exceptions are the areas where chemoautotrophic bacteria on the base of the trophic chains in
hydrothermal vents and cold seeps, biosynthesize organic carbon compounds from CO2,
using sulfide (H2S) and methane(CH4) as energy sources (Dubilier et al. 2008). Ecosystem
functioning in the deep sea is related with production, consumption and transfer of organic matter from the basis of food chain to the higher throphic levels, decomposition of organic matter and nutrient regeneration are processes of utmost importance to understand benthic biodiversity (Danovaro et al. 2008). Microbial processes involved in nutrient regeneration, are essential to sustain primary and secondary production and are a major player in global nutrient cycles. The microbial assemblages can limit rates of
biological production and are therefore important structural drivers in these marine ecosystems (Gage &Tyler 1991; Arrigo 2005). Interactions between species, such as predation, competition (Gage & Tyler 1991; Gage 1995) and symbiosis (Dubilier et al. 2008) are other biological factors that influence biodiversity.
Blooms of phytoplankton, the falls of dead animals and plants contribute greatly to the input of organic matter in the deep sea. Particulate organic matter (POM) or dissolved organic matter (DOM), can reach the seabed as “marine snow” and “feed” the benthic assemblages. This main source of energy to the deep sea fauna can accumulate, can be redistributed by bottom currents or create patches with high concentrations of resources from drifting organic matter related to small-scale natural physical disturbances (Thistle 1981; Gage & Tyler 1991). According to Rowe (1991) the biomass (organic carbon) of benthic animals is more correlated to the particulate organic matter flux than directly to the depth gradient. Epifauna (mostly scavengers but also detritivores) can efficiently remove the food that reaches the deep sea floor (Smith 1986) and therefore most of the organic matter is consumed at the sediment surface.
Inputs of seasonal fluxes of material through the water column can reach the seabed as phytodetritus deposits inducing a temporal variability in the benthic community response. This is well-established for bacteria and protozoa but studies on metazoans (meio, macro or megafauna) are less common and confined to continental margins (Gooday 2002). Temporal variation at tidal rhythm scales may be induced by bottom currents that control sediment deposition and the concentration of organic matter; when currents exceed 7cm.s-1 the materials at the seafloor are resuspended (Row & Menzies 1969; Lampit et al. 1985) with important implications for the distribution of suspension feeders that can be favoured in some specific regions by the abundant suspend organic matter (Row & Menzies 1969).
At a high taxonomic level, biodiversity is much greater in the sea than in terrestrial and freshwater ecosystems (Brunel 2006). The depth gradient is probably the best known biodiversity pattern, where species diversity generally appears to show a peak at middle slope depths (Rex 1981; Paterson & Lambshead 1995; Levin et al. 2001). This unimodal
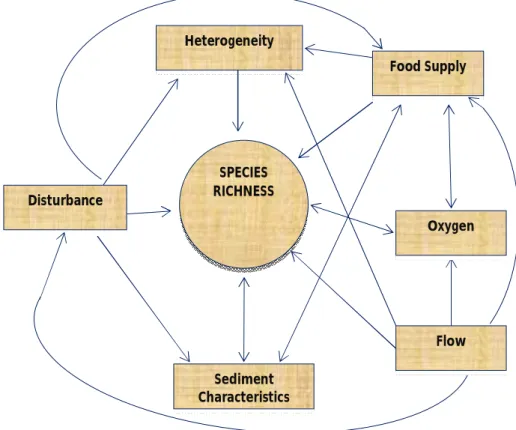
pattern, parabolic distribution with depth, has been explained by production, predation and competition based hypotheses (Rex 1981). However, regional deep sea diversity patterns are linked to several environmental factors and unimodal patterns do not appear to be universal (Levin et al. 2001). Boundary constrains and species ranges, sediment heterogeneity, productivity and food supply, bottom-water oxygen concentration, deep sea currents and catastrophic disturbance are processes and factors that can regulate species diversity and are subjected to a spatiotemporal variation in deep sea at local, regional and global scales. A conceptual model by Levin et al. (2001) shows the direct and indirect effects of various environmental factors on species richness of local communities (Fig. 1).
Figure 1: Conceptual model indicating direct and indirect effects of various environmental factors on species richness of local communities (adapted from Levin et al. 2001).
SPECIES RICHNESS Heterogeneity Food Supply Oxygen Flow Sediment Characteristics Disturbance
1.2 West Iberian Margin
The Iberian Peninsula is the south-westernmost region of the Eurasian Plate with an origin placed at the Cretaceous, Middle Cenomanian (late aptian, 117-94Ma.). It is an example of a rifted and non-volcanic continental margin (Arzola et al. 2008; Lastras et al. 2009).
The West Iberian Margin is characterized by a continental shelf with a gently sloping, thin shelf of 10 to 65km wide (Weaver & Canals 2003; Lastras 2009). This margin is incised, from north to south, by a number of submarine canyons, with a northeast– southwest trend (Arzola et al. 2008; Lastras et al. 2009). There are three large abyssal plains: Iberia, Tagus and Horseshoe, from north to south, and located at c.a. 4500m water depth. The first two abyssal plains are separated by Estremadura Spur (Lastras et al. 2009) and by the major canyons: Nazaré, Setubal and São Vincente into three distinct sections (Vanney & Mougenot 1981; Mougenot 1988).
1.2.1 North Atlantic Oceanography
The oceanography of west Iberian margin is complex. Analysing the depth variations, near the 50m and near the thermocline zone the salinity decreases from 35.8 or 36.0psu to a minimum of 35.6psu at 450-500m of depth. Here the North Atlantic Central Water is predominant (Van Aken 2000). From 500-800m to 1400m the salinity increases to 36.19psu due to the Mediterranean Water (MW) (McCave & Hall 2002). Beneath this lies the North Atlantic Deep Water Current (NADWC) that reaches ~2.5°C (Fiúza et al. 1998). The NADWC formed in the Norwegian Sea and traveling southwards, and the MW are of extreme importance for the faunal distributional patterns in the west Iberian marginrents (Gage & Tyler 1991).
Vitorino (2002) and Oliveira (2007) documented the influence of the seasonal upwelling in summer and the downwelling in winter as prevailing meteorological factors for the current patterns in the west Iberian margin.
1.2.2 Submarine Canyons
Canyons are common geological features along most ocean margins (Vetter & Dayton 1998; Weering & Stiger 2002; Stiger 2007), varying in shape and size from shallow systems to deeply incised sinuous valleys. In the past, when the sea level was lower, they were probably more active, but at the present time canyons are mostly sites of sedimentation (Weering & Stiger 2002). Canyons show a morphological similarity with erosional landforms (Stiger et al. 2007) and act as conduits of land and coastal materials to the deep sea floor. Canyons are preferential sinks for organic matter, and their biological activity indicate an input of fresh organic matter (Vetter & Dayton 1998; Duineveld et al. 1997). Due to this fact, these topographical features are thought to play an important role for the secondary production and may enhance benthic abundance and/or biodiversity in the deep sea (Vetter & Dayton 1998).
The main Portuguese canyons are gouf type with a deeply incised narrow, V-shaped thalweg flanked by small gullies and terraces, where landslides and rockfalls occur (Arzola et al. 2008). Morphologically canyons can be divided in three sections: the upper, middle and lower parts (Weering & Stiger 2002; Stiger et al. 2007; Arzola et al. 2008). Because they are complex systems in terms of hydrography, sedimentology, biogeochemistry and biology they present great variability within or between canyons. Turbidity currents are the dominant process of sediment transport, erosion and deposition in Nazaré and Setúbal canyons, due to the dominance of gravity flow deposits and erosive episodes. Probably the origin of terriginous sediments is the continental shelf. There are two types of turbidity currents: first, small volume, high frequency, carbonaceous and enriched in mica minerals, which deposit in shallower intra canyon terraces; second type, large volume, low frequency, canyon flushing turbidity currents that deposit mainly in the deeper parts of the canyon and in the abyssal plains (Arzola et
1.3 Crustacean Fauna
The crustaceans exhibit a huge diversity in morphology, adaptation, development and strategies of feeding. They live in all marine habitats, from supralitoral to the deeper parts of the oceans, but can also be found in terrestial habitats. Crustaceans range in size from less than 0.5mm to more than 1m. Their morphological diversity and all adaptative features make them a difficult phylum to define satisfactorily (Hayward & Ryland 1996). Above all, they have an important ecological role as they constitute a major food source to many marine invertebrates, vertebrates and mammals (Rehm 2007).
1.3.1 Systematics and Morphology
Eucarids are malacostraceans that always have a carapace covering the entire thorax usually dorsally fused. The representatives of this group do not possess oostegites nor a brood pouch to incubate the eggs. The reproduction strategy consists in the dispersion of eggs directly to the environment. The eggs can also be maintained in the thoracic appendices, or adherent to the ventral part or to the abdomen. Juveniles hatch and have a larval stage before reaching the adult stage (Hessler & Watling 1999).
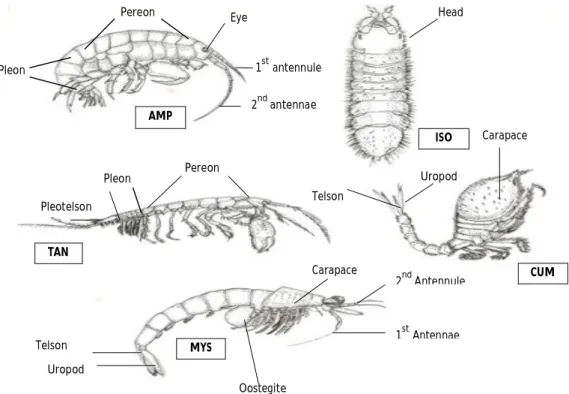
Peracarids are malacostracan crustaceans known from many habitats: land, freshwater, brackish and marine waters. They have a wide world distribution and exhibit all sorts of feeding strategies (Hessler & Watling 1999; Brusca & Brusca 2003). They are frequently detritus feeders with a free living epibenthic or bathypelagic lifestyle but may also burrow in the sediment or be tube dwellers (Gage & Tyler 1991). Peracarids range in size from a few millimetres to 500 mm in length and some are capable to live in hot springs, at 30-50°C. Morphologically they are characterized by the possession of a telson without rami; one or rarely 2-3 pairs of maxilipeds; mandibles with an articulated tooth (lacinia mobilis); carapace small and not fused with the posterior pereonites (once present); the gills are thoracic or abdominal; they possess oostegites, that form the marsupium (except in the Order Thermosbaenacea) (Fig. 2). Frequently juveniles hatch as mancas and do not have free living larval stages (Hessler & Watling 1999; Gutu & Sieg 1999; Brusca & Brusca 2003).
Figure 2: Anatomy and diversity in some peracarid crustaceans, AMP=amphipods, ISO=isopods, TAN=tanaids, CUM=cumaceans and MYS=mysids (adapted from Brusca & Brusca 2003).
Figure 3: Anatomy and diversity in Isopoda. A 1st =first antennae; A 2nd =second antennule; E=eye; H=head; M=marsupium; PE=pereon; PL=pleon; T=telson and U=urosome.
H E M PE PL A 2nd A 1st PL PE U H AMP ISO TAN CUM MYS Oostegite Carapace Carapace 2nd Antennule 1st Antennae Uropod Telson Telson Uropod Eye Head Pereon Pleon 1st antennule 2nd antennae Pereon Pleon Pleotelson U A 1st PE
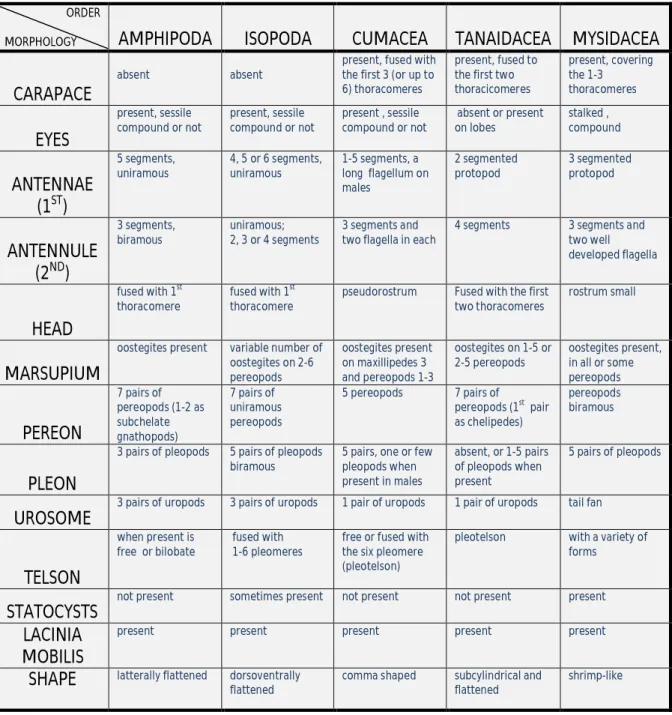
Table 1 summarizes the principal morphological features of five peracaridan orders. In deep sea samples peracarida crustacean fauna represent between 31%-51% of all macrobenthic species (Gage & Tyler 1991).
Table 1: Main morphological features of five peracarida orders (adapted from: Shram 1983; Bacescu & Petrescu 1999; Gutu & Sieg 1999; Nouvel, Casanova & Lagardere, 1999; Roman & Dalens 1999 and Santinni 1999).
ORDER
MORPHOLOGY AMPHIPODA ISOPODA CUMACEA TANAIDACEA MYSIDACEA
CARAPACE
absent absent
present, fused with the first 3 (or up to 6) thoracomeres
present, fused to the first two thoracicomeres present, covering the 1-3 thoracomeres EYES present, sessile compound or not present, sessile compound or not present , sessile compound or not absent or present on lobes stalked , compound ANTENNAE (1ST) 5 segments, uniramous 4, 5 or 6 segments, uniramous 1-5 segments, a long flagellum on males 2 segmented protopod 3 segmented protopod ANTENNULE (2ND) 3 segments, biramous uniramous; 2, 3 or 4 segments 3 segments and two flagella in each
4 segments 3 segments and two well developed flagella HEAD fused with 1st thoracomere fused with 1st thoracomere
pseudorostrum Fused with the first two thoracomeres
rostrum small
MARSUPIUM
oostegites present variable number of oostegites on 2-6 pereopods oostegites present on maxillipedes 3 and pereopods 1-3 oostegites on 1-5 or 2-5 pereopods oostegites present, in all or some pereopods PEREON 7 pairs of pereopods (1-2 as subchelate gnathopods) 7 pairs of uniramous pereopods 5 pereopods 7 pairs of pereopods (1st pair as chelipedes) pereopods biramous PLEON
3 pairs of pleopods 5 pairs of pleopods biramous
5 pairs, one or few pleopods when present in males absent, or 1-5 pairs of pleopods when present 5 pairs of pleopods UROSOME
3 pairs of uropods 3 pairs of uropods 1 pair of uropods 1 pair of uropods tail fan
TELSON
when present is free or bilobate
fused with 1-6 pleomeres
free or fused with the six pleomere (pleotelson)
pleotelson with a variety of forms
STATOCYSTS
not present sometimes present not present not present present
LACINIA MOBILIS
present present present present present
SHAPE latterally flattened dorsoventrally flattened
comma shaped subcylindrical and flattened
1.4 Study Context
This work is integrated in the 6th Framework Programme and EU-funded project
HERMES - Hotspot Ecosystem Research on the Margins of European Seas - that aims to
provide scientific knowledge about the biodiversity and community structure, the deep sea floor geology, physical and chemical aspects, microbiology and biogeochemistry, in deep-sea ecosystems along the European margins (Atlantic Ocean, Mediterranean and Black Seas).
On the Portuguese margin, Nazaré, Cascais and Setúbal canyons were selected as target areas for the study of biodiversity and ecosystem functioning of submarine canyons as these geological features are amongst the most important in Europe and even worldwide.
1.4.1 Aims of the Study
The benthic assemblages in the upper, middle and lower sections of Nazaré, Cascais and Setúbal canyons and slopes were sampled during three main cruises carried out in 2005 and 2006. The present work focuses on the crustacean fauna and investigates the variability in the composition and structure of the assemblages. The specific objectives include the study of:
- the vertical distribution within the sediment (upper 20cm) - the differences between canyon and open slopes;
- the changes along the depth gradient within canyons - the variability between canyons
Methodology
2.1 Study Area
The study area compromises the section of the Portuguese Atlantic margin between 37°49.98’N to 39°35.02’N latitude and 9°06.00’W to 10°20.06’W longitude, where three major canyons are located: Nazaré, Cascais and Setúbal.
The Nazaré canyon is one of the largest submarine canyon of the world (Vitorino et
al. 2005) and the northernmost of the central Portuguese canyons. Located at c.a. 39°45′N, it dissects the west Iberian margin, from east to west, starting at 50m water depth, and extending through almost 210km, to the Iberian abyssal plain at depths exceeding 4900 m (Arzola et al. 2008; Lastras et al. 2009). De Stiger et al. (2007) separate the canyon in upper, middle and lower sections: the first section ranges from 50 to 2700m, with a V shaped valley; the second from 2700 to 4000m, with a broad meandering valley, with terraces and V shaped valley axial channel and the last at depths greater than 4000m, with a flat valley. The Nazaré canyon is not connected to a major river, or drainage system on land. Despite this fact it still acts as a major conduit for sediment (Arzola et al. 2008; Lastras et al. 2009).
The Cascais canyon is the shortest, the steepest (›10°gradient) and the most central of the central Portuguese canyons. Located at latitudes of ca.38°25′N, it starts in the shelf at depths of ~175m and runs to the abyssal plain, at more than 4600m depth. This complex canyon in the vicinity the mouth of Tagus estuary and it sinuous (index=1.44) traject takes ca. 90km in an open U valley, and then continues 62km more as a single broader channel. Cascais canyon does probably receive its main input of organic matter from the Tagus River (Lastras et al. 2009).
The Setúbal Canyon is linked with Lisbon canyon, located at 37N°, is a more complex system and the southernmost of Central Portuguese Canyons. It also cuts the continental shelf starting at 150m water depth until the abyssal plain, to more than 4800m depths. The Setúbal branch starts in the mouth of Sado River and is 175km in length; Lisbon
branch is 167km long. Setúbal canyon is linked to Tagus and Sado rivers that are the two major source of organic matter (Lastras et al. 2009).
The open slopes of the West Portuguese margin are subjected to different environmental factors, such as landslides, current flow, sediment instability, constant flux and are considered in this study as control areas for the investigation on the canyon assemblages.
2.2 Sample Collection and Processing
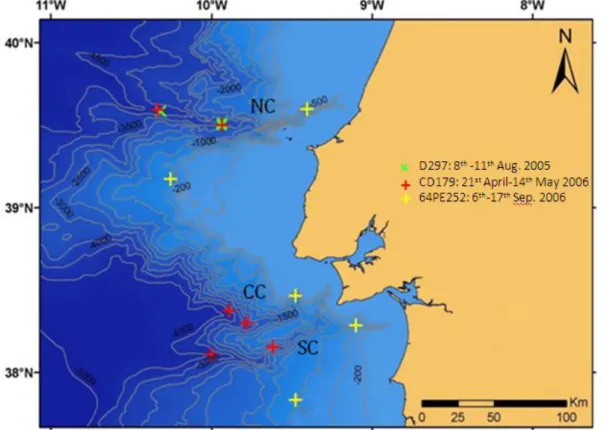
The sampling of the benthic assemblages was carried out from 8th to 11th August 2005, on board of RRS Discovery (D297 cruise, NOCS); 21st April to 14th May 2006, on board RRS Charles Darwin (CD179 cruise, NOCS) and 6th 17th September 2006, on board RV Pelagia (64PE252 cruise, NIOZ) cruises, as we can sea in figure 2.1. A total of eleven stations, nine in the canyons and two in the open slopes were considered (Fig. 4).
Figure 4: Bathymetric map of the 11 sampling stations, from central Portuguese canyons (NC-Nazaré Canyon, CC-Cascais Canyon and SC-Setúbal Canyon), during 2005 (D297) and 2006 (CD179 and 64PE252).
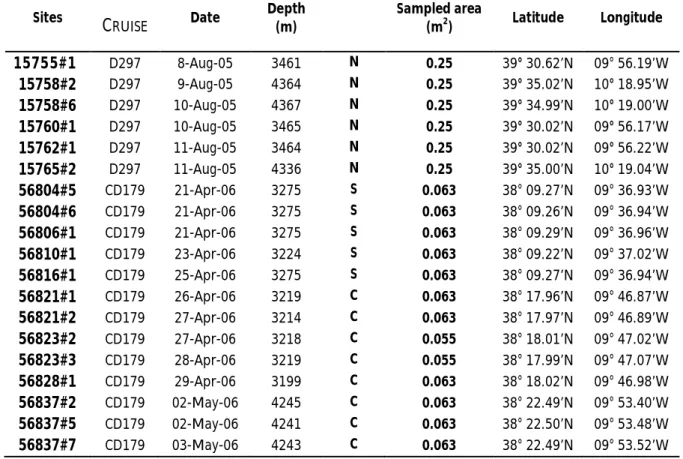
In 2005, (D297) only Nazaré canyon was sampled. Samples (three replicates each) were taken on the middle canyon terrace (ca. 3400m) and on the lower canyon floor adjacent to the thalweg (ca. 4300m), using a USNEL-box corer (area=0.25m2) (Weaver 2005). In 2006, two cruises were carried out. During CD179, samples were taken from Nazaré, Setúbal and Cascais canyons, using a UKORS megacorer (multiple cylindrical cores of 0,00785m2 internal area). In each canyon two depths (ca. 3400 and ca. 4300m) were sampled, with 4 to 5 replicates at each station (a total of 27 megacore replicates) (Billet 2006). During 64PE252 cruise, samples were taken from the three canyons and two open slope sites, one adjacent to Nazaré canyon (OS South) and one adjacent to Setúbal canyon (OS Sines) all at ca. 1000m. These 5 stations were sampled with the NIOZ circular box corer (Area=0.196m2) (Stiger 2006).The metadata of the 45 samples considered in this study are presented in Table 2.
Table 2 - List of the samples taken for crustacean fauna in the Portuguese canyons during HERMES cruises: RSS Discovery (D297-2005), RSS Charles Darwin (CD179-2006) and RV Pelagia (64PE252-2006), using USNEL box core, UKORS megacore and NIOZ box core, respectively. Samples were taken in Nazaré (N), Cascais (C) and Setúbal (S) canyons and open slopes (OSO South of Nazaré, OSI off Sines).
Sites CRUISE Date Depth (m) Sampled area (m2) Latitude Longitude 15755#1 D297 8-Aug-05 3461 N 0.25 39° 30.62’N 09° 56.19’W 15758#2 D297 9-Aug-05 4364 N 0.25 39° 35.02’N 10° 18.95’W 15758#6 D297 10-Aug-05 4367 N 0.25 39° 34.99’N 10° 19.00’W 15760#1 D297 10-Aug-05 3465 N 0.25 39° 30.02’N 09° 56.17’W 15762#1 D297 11-Aug-05 3464 N 0.25 39° 30.02’N 09° 56.22’W 15765#2 D297 11-Aug-05 4336 N 0.25 39° 35.00’N 10° 19.04’W 56804#5 CD179 21-Apr-06 3275 S 0.063 38° 09.27’N 09° 36.93’W 56804#6 CD179 21-Apr-06 3275 S 0.063 38° 09.26’N 09° 36.94’W 56806#1 CD179 21-Apr-06 3275 S 0.063 38° 09.29’N 09° 36.96’W 56810#1 CD179 23-Apr-06 3224 S 0.063 38° 09.22’N 09° 37.02’W 56816#1 CD179 25-Apr-06 3275 S 0.063 38° 09.27’N 09° 36.94’W 56821#1 CD179 26-Apr-06 3219 C 0.063 38° 17.96’N 09° 46.87’W 56821#2 CD179 27-Apr-06 3214 C 0.063 38° 17.97’N 09° 46.89’W 56823#2 CD179 27-Apr-06 3218 C 0.055 38° 18.01’N 09° 47.02’W 56823#3 CD179 28-Apr-06 3219 C 0.055 38° 17.99’N 09° 47.07’W 56828#1 CD179 29-Apr-06 3199 C 0.063 38° 18.02’N 09° 46.98’W 56837#2 CD179 02-May-06 4245 C 0.063 38° 22.49’N 09° 53.40’W 56837#5 CD179 02-May-06 4241 C 0.063 38° 22.50’N 09° 53.48’W 56837#7 CD179 03-May-06 4243 C 0.063 38° 22.49’N 09° 53.52’W
Sites CRUISE Date Depth (m) Sampled area (m2) Latitude Longitude 56837#8 CD179 03-May-06 4244 C 0.063 38° 22.49’N 09° 53.52’W 56838#2 CD179 03-May-06 4482 S 0.063 38° 06.50’N 09° 59.98’W 56838#3 CD179 04-May-06 4482 S 0.063 38° 06.49’N 09° 59.94’W 56838#4 CD179 04-May-06 4485 S 0.055 38° 06.52’N 09° 59.99’W 56842#1 CD179 05-May-06 4482 S 0.063 38° 06.45’N 09° 59.94’W 56842#2 CD179 05-May-06 4485 S 0.063 38° 06.49’N 09° 59.97’W 56851#1 CD179 09-May-06 3517 N 0.063 39° 29.99’N 09° 55.97’W 56851#2 CD179 09-May-06 3517 N 0.063 39° 29.99’N 09° 56.01’W 56856#1 CD179 11-May-06 3519 N 0.039 39° 29.95’N 09° 56.00’W 56856#2 CD179 11-May-06 3522 N 0.055 39° 30.00’N 09° 55.98’W 56847#6 CD179 08-May-06 4403 N 0.063 39° 35.57’N 10° 19.99’W 56847#7 CD179 08-May-06 4404 N 0.055 39° 35.55’N 10° 20.06’W 56859#1 CD179 12-May-06 4418 N 0.055 39° 35.58’N 10° 20.00’W 56861#1 CD179 14-May-06 4404 N 0.047 39° 35.57’N 10° 20.02’W
27BC1 64PE252 06-Sep-06 1030 OSSO 0.196 39° 10.36’N 10° 15.23’W
27BC2 64PE252 06-Sep-06 1030 OSSO 0.196 39° 10.36’N 10° 15.23’W
36BC2 64PE252 18-Sep-06 935 C 0.196 38° 27.89’N 09° 28.51’W
36BC3 64PE252 18-Sep-06 1014 C 0.196 38° 27.86’N 09° 28.49’W
36BC4 64PE252 18-Sep-06 1020 C 0.196 38° 27.90’N 09° 28.50’W
43BC1 64PE252 11-Sep-06 897 N 0.196 39° 35.80’N 09° 24.25’W
43BC3 64PE252 11-Sep-06 897 N 0.196 39° 35.80’N 09° 24.24’W
56BC1 64PE252 16-Sep-06 1001 OSSI 0.196 37° 49.99’N 09° 28.50’W
56BC2 64PE252 16-Sep-06 1001 OSSI 0.196 37° 49.95’N 09° 28.49’W
56BC3 64PE252 16-Sep-06 1001 OSSI 0.196 37° 49.98’N 09° 28.49’W
61BC1 64PE252 17-Sep-06 970 S 0.196 38° 17.10’N 09° 05.98’W
61BC2 64PE252 17-Sep-06 970 S 0.196 38° 17.10’N 09° 06.01’W
61BC3 64PE252 17-Sep-06 970 S 0.196 38° 17.10’N 09° 06.00’W
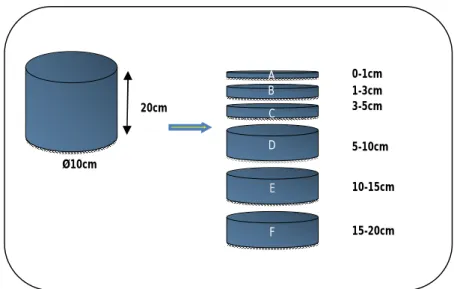
For the biological analyses, the upper 20cm of the sediment cores were sliced in to six different layers, whenever possible: A: 0-1cm; B: 1-3cm; C: 3-5cm; D: 5-10cm; E: 10-15cm and F: 15-20cm (Fig. 4). This methodology follows the standard techniques discussed in the Census of Marine Life workshop on the study of “Biodiversity of Deep-sea Sediments” and adopted as general practice in HERMES. In some sites, only the 10cm of the sediment were sampled, and the sediments with more than 10cm, that were not sieved, were only examined for larger fauna. Prior to sieving, the sediment layers 0-1 and 1-3cm where placed at once in formalin. All material from the six layers including the overlying water in the 0-1cm sample, were carefully washed with seawater through 500µm and 300µm sieves. The sieved material was fixed in 10% buffered formalin in
seawater, or in 96% ethanol (in the case of the cruise 64PE252). Than the material was stored and brought to the laboratory on land where the material was sieved.
Figure 5: Procedure adopted on the three cruises, resulting: A=0-1cm, B=1-3cm, C=3-5cm, D=5-10cm, E=10-15cm and F=15-20cm sediment layers.
Crustacean specimens were identified to the lowest possible taxonomic level and counted under a stereoscope microscope. All Amphipoda and Isopoda species were photographed using Nikon NIS-Elements digital system and software. The taxonomic list of the collected species is in the Appendix 1 and the Amphipoda and Isopoda species photos are in the Appendix 2 and Appendix 3 respectively. As many species could not match the descriptions found in the available literatures many of them were identified by a unique code (eg. AMPSP077).
2.3 Data Analysis
2.3.1 Univariate and Distributional Analyses
The data were built in a species vs station abundance matrix integrating all sediment layers, in order to investigate the variability of the crustacean assemblages from the Portuguese canyons.
C Ø10cm B D 0-1cm 1-3cm 3-5cm 5-10cm 10-15cm 15-20cm 20cm E F C B A
Univariate measures such as: Shannon-Wiener diversity index (H’) and Pielou’s evenness index (J’) were estimated using the software PRIMER v6 (Clarke & Warwick 1994) Distributional analysis was carried out using K-dominance curves. K-dominance curves consist of plotting the cumulative ranked abundances (y-axis) against species (x-axis) that are ordered by decreasing abundances, in a logarithmic scale. The shape of the curve and the Y intersection allow some interpretation of community structure. Communities dominated by a small number of species have a high value of y-axis intersection point. Curves with a long “tail” indicate a large quantity of rare species in the community.
2.3.2 Multivariate Analysis
Multivariate analysis was performed using the statistical package PRIMER v6. Non-metric MDS ordination was performed using the Bray-Curtis similarity measure, after fourth root transformation of the data. An analysis of similarities by permutation tests (ANOSIM) was performed on each MDS results.
Because different sampling gears were used in different cruises the data were analyzed according to the following objectives and test designs:
One-way ANOSIM was performed to assess the significance of differences between
canyons and open slopes using the data (obtained in two open slope sites and three canyon sites at ca. 1000m depth during 64PE252.
A two-way crossed layout ANOSIM was performed to assess the significance of differences between depths (3400m vs 4300m) and between canyons (Nazaré, Cascais and Setúbal) using the data obtained during CD179.
A two-way crossed layout ANOSIM was performed to assess dissimilarities between
different samplers (box core vs megacore) and between different depths (3400m vs 4300m) using the data obtained for Nazaré canyon during D297 and CD179.
Results
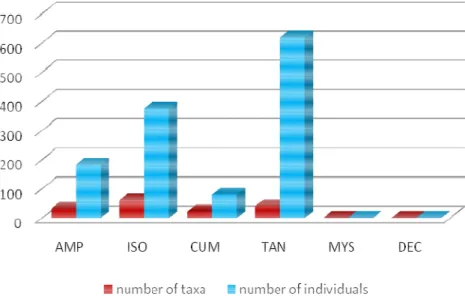
A total of 1260 specimens were counted and ascribed to 157 nominal taxa, in 47 families and six crustacean orders in the material gathered from Nazaré, Cascais and Setúbal Canyons and Open slopes of central West Iberian margin, between 2005 and 2006. The Tanaidacea were represented by 619 specimens in 40 nominal taxa and were the most abundant group, followed by the most speciose group, the Isopoda with 376 specimens in 61 nominal taxa, and then the Amphipoda with 183 specimens in 32 nominal taxa, Cumacea with 80 specimens with 22 nominal taxa and finally Decapoda and Mysidacea with only one specimen in one taxa each (Fig. 6).
Figure 6: Crustacean specimen examined showing a total of 1260 individuals, data collected during D297, CD179 and 64PE252 cruises, between 2005 and 2006. AMP (Amphipoda), ISO (Isopoda), CUM (Cumacea), TAN (Tanaidacea), MYS (Mysidacea) and DEC (Decapoda).
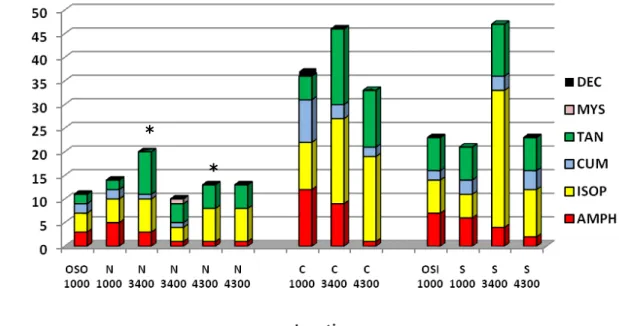
The lowest species richness (Fig. 7) was observed in Nazaré at 3400m in 2006 (20 taxa) and the highest in Setúbal canyon at 3400m in 2006 (47 taxa). Globally the taxa richness was consistently higher in Cascais and Setúbal than in Nazaré canyon at all depths. Amphipoda and Cumacea showed the highest diversity at lower depths, while Isopoda and Tanaidacea revealed the opposite trend.
Figure 7: Species richness in the different sampling station from the Portuguese Canyons. The values are pooled from all replicates in one site. Samples taken in the same site at consecutive years (Nazaré 3400m and 4300m) were kept separate.*Samples taken during D297 in 2005.
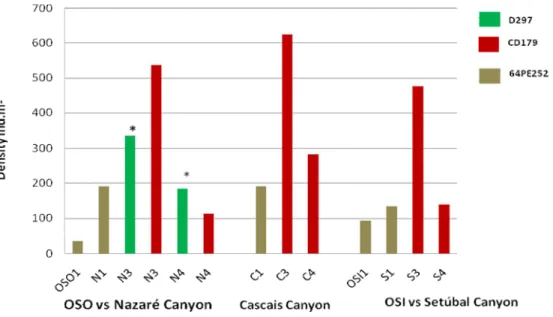
The crustacean abundance (Fig. 8) showed the lowest values in open slopes (OSO: 36ind.m -², OSI: 93ind.m-²) and high variability within and between canyons although the highest values were found consistently at 3400m in all canyons (Nazaré: 537 ind.m-²; Cascais Canyon: 624 ind.m-²; Setúbal Canyon: 477 ind.m-²).
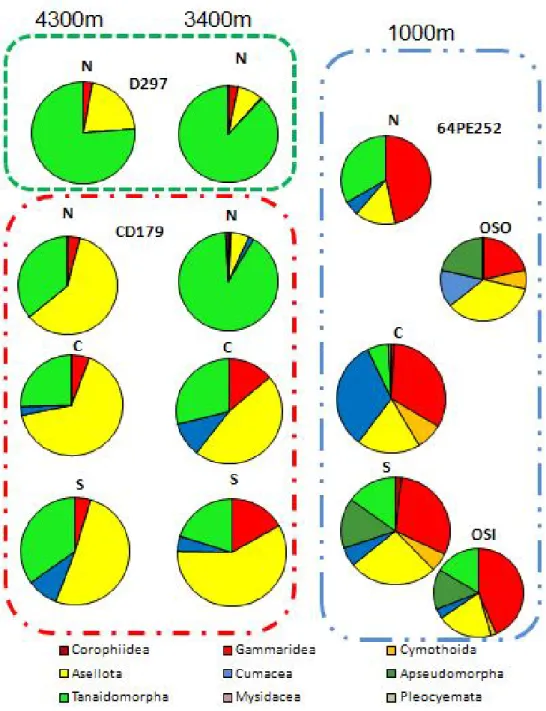
The composition and structure of the assemblages also showed important differences either within and between canyons or between open slopes and canyons (Fig. 9). Some crustacean groups were dominant (eg. Gammaridea and Cumacea) and sometimes almost restricted to the shallower depths (eg. Apseudomorpha, Cymothoida and Corophiidea) while others were dominant at greater depths (eg. Tanaidomorpha); Asellota was the most speciose group and could be found at all locations and depths, nervetheless with high consistently higher abundance at greater depths.
The estimated indices of diversity and evenness (Table 3) reflect some of the features in the structure of the assemblages such as the high dominance (low evenness and diversity) in Nazaré canyon at 3400m and the consistently highly diverse crustacean assemblage at Cascais canyons.
*
Figure 8: Crustacean abundance in the different studied sites, during D297, CD179 and 64PE252 cruises. The values are averages from the replicates taken in each site expressed as ind.m-². Samples taken in the same site at consecutive years (Nazaré 3400m and 4300m) were kept separate. *Samples taken during D297 in 2005.
Table 3: Univariate biodiversity indices for each station sampled during D297, CD179 and 64PE252 cruises. Values are average from replicates in each station: n= number of replicates; S: number of species; N: densities (ind.m-²); J’: Pielou’s evenness index and H’ (log e) Shannon-Wiener diversity index. n S N J' H'(loge) OSO 2 11 35.7 0.961 2.30 N1 2 14 191.3 0.689 1.82 N3D 3 20 336.0 0.289 0.87 N4D 3 20 185.3 0.743 2.22 N3C 4 10 533.5 0.392 0.90 N4C 4 13 112.7 0.914 2.34 C1 3 37 192.2 0.872 3.15 C3 5 46 510.7 0.898 3.44 C4 4 33 281.7 0.940 3.29 OSI 3 23 93.5 0.883 2.77 S1 2 21 135.2 0.896 2.73 S3 5 47 476.2 0.881 3.39 S4 5 23 139.3 0.950 2.98
Figure 9: Composition and structure of the crustacean assemblages from the study sites in the Portuguese canyons: Nazaré (N), Cascais (C), and Setúbal (S) and Open slope South Nazaré (OSO) and Open slope Sines (OSO) at 1000, 3400 and 4300m of depth, until subOrder taxonomic level.
The variability in the composition and structure of the crustacean assemblages will be further discussed in relation to the results of the multivariate analyses.
3.1 Vertical Distribution Within the Sediment
The results on the vertical distribution of the crustacean fauna within the sediment layers (first 20 cm) are presented in figures 10 (cruise D297), 11 (cruise CD179), and 12 (cruise 64PE252).
The assemblages sampled during 2005 in Nazaré canyon (2005) at 3400m and 4300m (Fig.10) reveal similar trends with crustacean densities decreasing with sediment layer although at 3400m the maximum density is observed at subsurface (1-3cm).
Figure 10: Vertical distribution of crustacean fauna within the sediment (ind.m-2). Data from Nazaré canyon at 3400m and 4300m depths, obtained during D297 cruise, in 2005.
Figure 11: Vertical distribution of crustacean fauna within the sediment (ind.m-²). Data from Nazaré, Cascais and Setúbal canyons at 3400m and 4300m depths, obtained during CD179 cruise, in 2006.
The trends in the vertical distribution observed in the samples collected during the cruise CD179 (2006) indicate generally that there is a decrease in density, from 0-1 to 5-10cm (Fig. 11). The only exception is Nazaré canyon at 4300m where a slight increase at the subsurface (1-3cm) is recorded. Cumaceans are only recorded at the surface of the sediments while Isopoda and Tanaidacea usually also reach high densities deeper in the sediment.
Figure 12: Vertical distribution of crustacean fauna within the sediment (ind.m-²). Data from Nazaré, Cascais and Setúbal canyons and Slopes (OSO; OSI) at 1000m depth, obtained during 64PE252 cruise, in 2006.
The analysis of the data from 64PE252 cruise at 1000m depths in canyons and slopes shows heterogeneous results. Nazaré and Setúbal show an increase in the density of crustaceans at the subsurface (1-3cm). The maximum density is reached at 3-5cm sediment layer In Cascais and at 5-10 cm in OSI. A decreasing trend in the vertical distribution of crustaceans at the stations located at 1000m is only observed in OSO (Fig. 12). At 1000m depths the amphipods and cumaceans are found burrowing deeper in the sediment than in the stations sampled at greater depths.
3.2 Canyons vs Open Slopes (cruise 64PE252)
A total of 310 specimens were sampled in Pelagia cruise, from the five stations sample at 1000m depth. Amphipoda was the most abundant order (117 ind.) followed by Isopoda (76 ind.) and then Tanaidacea and Cumacea (69 and 48 ind., respectively). The Decapoda order is represent only by one specimen. To assess differences between canyons and slopes the data was subjected to multivariate analysis. The MDS plot (Fig. 13) shows a clear segregation of the two groups of samples. The one way ANOSIM results confirm the significance of differences between canyons and slopes (R: 0.473; significance level: 0.1%)
Except for the lower densities observed in the open slopes (Fig. 8) there is no clear trend in the composition and structure of the crustacean assemblages at 1000m. The assemblages are very heterogeneous: the species richness in OSO and OSI (Fig. 7) were similar to the adjacent canyons (Nazaré and Cascais, respectively). Cumacea show a high species richness and density in Cascais canyon but also occur in the other stations; Apseudomorpha are abundant in the open slopes but also in Setúbal while Cymothoidae occur in Cascais and Setúbal canyons but are also present in OSO (Figs 8 and 9).
Transform: Square root
Resemblance: S17 Bray Curtis similarity
Local O C 56BC1 56BC2 56BC3 61BC1 61BC3 36BC2 36BC3 36BC4 43BC1 43BC3 27BC1 27BC2 2D Stress: 0.07
Figure 13: MDS plot of the analysis performed on the crustacean data from samples collected during 64PE252 cruise. Labels of sampling station as in Table 2.
The k-dominance curves (Fig. 14) show that the assemblages of Cascais and Setúbal canyons are slightly less dominated than the open slope assemblages but the lowest diversity and evenness occurs in Nazaré canyon (Fig. 14 and Table 4). In fact, diversity indices are higher for Cascais and Setúbal (Table 4) but the highest evenness occurs at OSO.
The analysis of the most dominant species (Table 5) also illustrates the high heterogeneity in the crustacean assemblages at 1000m. The amphipod Carangoliopsis
spinulosa (in Nazaré, Setúbal and OSI) and the tanaid Apseudidae SP044 (in OSO, OSI and
Setúbal) are the only species that rank amongst the six dominant in three sites. From the Amphipoda two Phoxocephalidae (Metaphoxus SP050 and Harpinia spp.065) and one Ampeliscidae (Haploops cf. setosa) species were dominant in Cascais and OSI, respectively and from the Tanaidacea a few other species are ranked among the dominant in all sites except Cascais. There were several dominant Isopoda, namely some Desmosomatidae (eg. Chelator cf. verecundis in Setúbal and OSI, Chelator cf. insignis in Nazaré; Eugerda
tetarta in OSI and Cascais), Anthuridea (Bullowanthura cf. aquitanica OSO; Paranthura
SP066 in Cascais) and Munnopsidae (Ilyarachna SP078 in Setúbal OSO).
Figure 14: k –dominance curves for the five 64PE252 cruise sampling sites.
Table 4: Univariate biodiversity indices for the five stations sampled during 64PE252 cruise. Values are average from replicates in each station: n= number of replicates; S= number of species; N= densities (ind.m-²); J’= Pielou’s evenness index and H’ (log e)= Shannon-Wiener diversity index.
Site n S N J' H'(loge) N 2 9.5 191.3 0.710 1.59 C 3 18.7 192.2 0.917 2.67 S 2 14.0 135.2 0.930 2.44 OSO 2 6.0 35.7 0.975 1.60 OSI 3 11.0 93.5 0.923 2.20
Among the Cumacea two species of Leucon SP004 are dominant in Cascais and Nazaré; Nannastacidae SP013 and Diastylidae SP014 also rank as dominant in OSO. Although Nazaré canyon and the adjacent open slope (OSO) show highly divergent assemblages, Setúbal Canyon shares three dominant species with its adjacent open slope (Carangoliopisis spinulosa, Apseudidae SP044 and Chelator cf. verecundis).
Table 5: Six dominant crustacean species for each studied site and depth (canyons and slopes; 1000 m, 3400 m and 4300 m) expressed in percentage.*Dominant species obtained during D297 cruise were kept separate.
1000 m %CUM 3400 m %CUM 4300 m %CUM
OSS Bullowanthura cf. aquitanica 21.43
Apseudidae SP044 35.71
Sphyrapus malleolus 42.86
Nannastacidae SP013 50.00
Diastylidae SP014 57.14
Ilyarachna SP078 64.29
OSI Carangoliopsis spinulosa 21.82
TANSP037 32.73 Apseudidae SP044 41.82 Haploops cf. setosa 49.09 Chelator cf. verecundis 54.55 Eugerda tetarta 60.00 N* Pseudotanaidae SP051 83.33 TANSP066 31.65 Chauliodoniscus SP046 88.10 TANSP052 48.92 Harpinia spp. SP065 90.48 Pseudotanaidae SP051 65.47 TANSP068 92.06 Desmosomatidae spp. 70.50 Desmosomatidae spp. 93.25 Anarthuridae SP013 75.54 Eugerda tetarta 94.05 Macrostylis aff. subinermis 79.86 N Carangoliopsis spinulosa 38.67 Pseudotanaidae SP051 78.73 Pseudotanaidae SP051 19.14
TANSP046 69.33 TANSP064 87.76 Momedossa SP089 35.96
Chelator cf. insignis 74.67 lyarachna SP077 90.73 Chelator cf. insignis 51.59
Leucon SP004 78.67 Pseudotanaidae SP041 92.68 Macrostylis aff. longiremis 60.34
Desmosomatidae spp. 82.67 Eudorella SP017 94.62 Eugerdella SP091 67.89
cf.Tanaellidae SP040 85.33 Eugerda tetarta 96.57 Thambematidae SP098 72.62
C Leucon SP004 11.50 Macrostylis cf. abyssicola 11.90 Rapaniscus SP095 11.27
Metaphoxus SP050 20.35 Lampropidae SP018 21.38 Chelator cf. insignis 18.31
Harpinia spp. SP065 29.20 Chelator cf. insignis 26.57 Harpinia spp. SP065 23.94
Eugerda tetarta 37.17 TANSP057 31.40 Haploniscus aff. antarticus 29.58
Leucon SP005 44.25 cf.Agathotanaidae SP048 35.96 Macrostylis magnifica 35.21
cf. Paranthura SP066 50.44 cf. Thambema SP093 39.99 Eurycope SP079 39.44
S Carangoliopsis spinulosa 16.98 Haploniscus cf. charcoti 12.00 Pseudotanaidae SP051 11.73
Apseudidae SP044 30.19 Harpinia spp. SP065 20.00 Ischnomesus cf.
norvegicus
21.18
cf. Tanaellidae SP040 37.74 Macrostylis cf. abyssicola 27.33 Chelator cf. insignis 30.29
Desmosomatidae spp. 45.28 AMPSP072 34.67 Desmosomatidae spp. 37.46
Chelator cf. verecundis 52.83 Haploniscus cf. foresti 40.67 TANSP052 42.69
Ilyarachna SP078 60.38 Mirabilicoxa sp. SP037 45.33 TANSP063 47.24
3.3. Variability Within and Between Canyons (CD179 cruise)
A total of 559 specimens (101 taxa) were sampled in CD179 cruise, from Nazaré, Cascais and Setúbal canyons at 3400 and 4300m depths. Isopoda was the most abundant order, with 250 individuals (49 taxa) fallowed by Tanaidacea with 223 individuals (27 taxa)
and then Amphipoda and Cumacea, with 54 (14 taxa) and 31 (10 taxa) individuals respectively. The Mysidacea order is represent only by one specimen.
The MDS plot in Figure 15 shows the variability between and within the three canyons samples. Along the horizontal axis there is a clear separation of the three canyons (Nazaré, Setúbal and Cascais, from left to right) while the vertical axis separated samples according depths (Cascais and Setúbal at 3400m and Nazaré at 4300m in the bottom and the remaining in the top). The samples from Cascais and Setúbal at 3400m show a low dispersion indicating a high similarity of these assemblages.
Transform: Fourth root
Resemblance: S17 Bray Curtis similarity
CanyonDepth N3400 N4300 C3400 C4300 S3400 S4300 C51.1 C51.2 C56.1C56.2 C47.6 C47.7 C59.1 C61.1 C21.1 C21.2 C23.2 C23.3 C28.1 C37.2 C37.5 C37.7 C37.8 C04.5 C04.6 C06.1 C10.1 C16.1 C38.2 C38.3 C38.4 C42.1 C42.2 2D Stress: 0.19
Figure 15: MDS plot of the analysis performed on the crustacean data from samples collected during CD179 cruise. Labels of sampling station as in Table 2.
The two-way crossed ANOSIM results show that the differences between canyons and between depths are both highly significant with a slight predominance of depth differences (R: 0.79) over canyon differences. Pairwise tests confirm the significant differences between canyons pointing out to a higher dissimilarity between Nazaré and Cascais or Nazaré and Setúbal than between Cascais and Setúbal (Table 6).
Table 6: Results of the ANOSIM global and pairwise tests for the MDS performed for the samples collected during CD179 cruise. Two-way crossed analysis; Factors: depth (3400 and 4300m); site N (Nazaré), S (Setúbal) and C (Cascais).
Sample statistic (Global R) Permutations used Significant statistics Significance level % Global test Depth 0.79 999 0 0.1*** Canyon 0.72 999 0 0.1*** Pairwise tests N, C 0.869 999 0 0.1*** N, S 0.711 999 0 0.1*** C, S 0.561 999 1 0.2**
In terms of species richness the crustacean assemblages in Nazaré canyon show much lower values than Cascais and Setúbal (Fig. 7) but the difference in densities is not so remarkable. In fact the major differences in densities are related to the depth gradient with the deeper assemblages showing lower densities in all canyons (Fig. 8). The composition and structure of the assemblages (Fig. 9) in Cascais and Setúbal is dominated by Asellota and Tanaidomorpha with also an important contribution of Gammaridea at 3400m; in Nazaré the assemblage is highly dominated by Tanaidomorpha at 3400m while at 4300m the structure of the assemblage at the sub-order level is closer to the other canyons.
The higher dominance of the Nazaré assemblages is reflected by the elevated k-dominance curves (Fig. 16); in the other two canyons at both depths, the k-k-dominance curves are low and almost overlapping. These features are confirmed by the univariate diversity and evenness indices with globally higher values in Cascais and Setúbal and rather low values in Nazaré. The depth trend is towards a decrease in diversity and increase in evenness at the deeper stations in Cascais and Setúbal while in Nazaré both the diversity and the evenness are higher at 4300m (Table 7).
Table 7: Univariate biodiversity indices for the 27 stations sampled during 27 CD179 cruise. Values are average from replicates in each station: n= number of replicates; S= number of species; N= densities (ind.m-2); J’= Pielou’s evenness index and H’(log e)= Shannon-Wiener diversity index.
n S N J' H'(loge) N3400 4 10 533.5 0.392 0.90 N4300 4 13 112.7 0.914 2.34 C3400 5 46 510.7 0.898 3.44 C4300 4 33 281.7 0.940 3.29 S3400 5 47 476.2 0.881 3.39 S4300 5 23 139.3 0.950 2.98
Figure 16: k –dominance curves for the twenty seven CD179 cruise sampling sites.
Although the crustacean assemblages in the three canyons are dominated by Tanaidomorpha and Asellota only one tanaid and one isopod are common to more than two stations in the listing of dominant taxa (Table 5; Pseudotanaidae SP051 in Nazaré 3400, Nazaré 4300m and Setúbal 4300m and Chelator cf. insignis in Nazaré 4300m, Cascais 3400m, Cascais 4300m and Setúbal 4300m). Several other species of Tanaidomorpha are among the dominant in Nazaré 3400m, Cascais 3400m and Setúbal 4300m and other different species of Desmosomatidae in Nazaré and Setúbal at both
C u m u la ti ve % 0 10 20 30 40 50 60 70 80 90 100 1 10 100 Species rank
depths. Other dominant isopods include Macrostylidae (4 species in Nazaré 4300m, Setúbal 3400m and Cascais at both depths), Haploniscidae (3 species in Setúbal 3400m and Cascais 4300m), Munnopsidae (2 species), Thambematidae (2 species), Nannoniscidae (1 species) and Ischnomesidae (1 species). Amphipoda (Phoxocephalidae) and Cumacea rank among the dominant only in Setúbal 3400m and Cascais 4300m and in Nazaré 3400m and Cascais 3400m, respectively (Table 5).
3.4 Variability Between Sampling Gears / years (D297 vs CD197)
Samples from the Nazaré canyon at 3400 and 4300m were collected in 2005 (D297) and in 2006 (CD179) using different sampling gears (USNEL box core vs UKORS megacore) and covering different sampling areas (see Table 2). The change in methodology may influence the biological collection and difficults the interpretation of putative interannual variability in the composition and structure of the assemblages. The MDS plot of the Nazaré samples (Fig. 17) show a clear segregation of the 3400m and 4300m samples along the horizontal axis and of the sampling gear/year along the vertical axis.
Transfo rm: Fo urth ro ot
Resemblance: S17 Bray Curtis similarity
SamplerDepth Box-core3400 Box-core4300 Megacore3400 Megacore4300 D55.1 D60.1 D62.1 D58.2 D58.6 D65.2 C51.1 C51.2 C56.1 C56.2 C47.6 C47.7 C59.1 C61.1 2D Stress: 0.08
Figure 17: MDS plot of the analysis performed on the crustacean data from samples collected in Nazaré canyon during D297 and CD179 cruises. Labels of sampling station as in Table 2.
