www.elsevier.com / locate / chroma
Determination of clonixin in plasma and urine by reversed-phase
high-performance liquid chromatography
a a ,
*
b c,d˜
´
´
Antonio Bica , Ascensao Farinha
, Henning Blume , Carlos Maurıcio Barbosa
a
´ ˆ
Laboratorio de Estudos Farmaceuticos, Rua Alto do Duque 67, 1400 Lisbon, Portugal
b
¨
Johann Wolfgang Goethe-Universitat, Frankfurt am Main, Germany
c
´
CTMUP, Faculdade de Farmacia da Universidade do Porto, Porto, Portugal
d
´
CETMED, Centro Tecnologico do Medicamento, Porto, Portugal
Abstract
A reversed-phase high-performance liquid chromatographic method that enables the determination of clonixin in human plasma and urine samples is described. Recovery of the drug was over 87.6 and 80.7% for plasma and urine, respectively. The limit of quantitation of the method was established as 10 ng / ml in plasma and 20 ng / ml in urine samples, with RSDs of less than 11.1%. The applicability of the method was further assessed by determining the plasma concentrations time course of clonixin in six healthy volunteers after single oral dose administration of 150 and 300 mg of clonixin and Clonix.
2000 Elsevier Science B.V. All rights reserved.
Keywords: Validation; Clonixin; Nonsteroidal anti-inflammatory drugs
1. Introduction activity in laboratory animals [1]. Analgesic
prop-erties have been shown in monkeys [2] and in
Clonixin, 2-(3-chloro-o-toluidino) nicotinic acid is humans [3–10]. Clonixin showed a good safety
a nonsteroidal anti-inflammatory drug (Fig. 1) dis- profile, with analgesic efficacy, following oral
ad-playing anti-inflammatory, analgesic and antipyretic ministration of a 600-mg dose, comparable to
mor-phine sulphate 10 mg parenterally [9]. The drug’s solubility in aqueous media is very low, with a high trend for partitioning into organic solvents, as re-vealed by its high octanol / water partition coeffi-cients (unpublished data).
Few methods for the assay of clonixin in bio-logical samples have been reported. Katchen and co-workers [11,12] developed a thin-layer chromato-graphic method following UV spectrophotometry to study the metabolism and pharmacokinetics of
Fig. 1. Clonixin chemical structure. clonixin in rats, dogs and monkeys and in humans, following i.v. and oral administration of 23250 mg gelatine capsules. Clonixin was found to be rapidly
*Corresponding author.
E-mail address: [email protected] (A. Farinha). absorbed and excreted by humans. The excretion
0021-9673 / 00 / $ – see front matter 2000 Elsevier Science B.V. All rights reserved. P I I : S 0 0 2 1 - 9 6 7 3 ( 0 0 ) 0 0 3 4 8 - 4
patterns of the parent compound and the urine 2.3. Plasma sample preparation metabolites were very similar between rhesus
mon-keys and humans. A 1-ml plasma sample, thawed at room
tempera-´
Gonzalez-Martin et al. [13], reported a study of ture, was spiked with 50 ml of a 21.4-mg / ml I.S and
the pharmacokinetics of the lysine salt of clonixin in mixed with 50 ml of 6 M hydrochloric acid in a glass
10 children in postoperative care, aged 4–10 years screw-capped tube. To each sample, 4 ml of a
old. Serum clonixin concentrations were determined mixture of chloroform–methanol (99.5:0.5) were
by a revered-phase high-pressure liquid chromato- added and the tubes thoroughly mixed for 15 min.
graphic method with a limit of quantitation (LOQ) of After centrifugation at 4500 rpm for 5 min, the
100 ng / ml, although further details were not pro- organic layer was transferred to a clean glass tube.
vided. The pharmacokinetic parameters determined The remaining aqueous layer was again extracted
were different from those previously reported in with additional 4 ml of the chloroform–methanol
adult humans and experimental animals. solution. The organic layer was transferred to the
We report here a new specific and sensitive tube containing the first 4 ml organic phase from the
method for the determination of clonixin in human previous extraction step. The pooled organic layers
plasma and urine samples. The method was applied were evaporated to dryness at 458C under a stream of
to a pilot bioavailability study of clonixin in six nitrogen. The dry residue was reconstituted with 100
healthy volunteers. ml of methanol. Twenty-ml samples were injected
into the HPLC apparatus. 2.4. Urine sample preparation
2. Experimental
Frozen urine was allowed to thaw at room tem-perature. The internal standard ( p-chlorowarfarin 2.1. Materials
solution at 21.4 mg / ml), 50 ml of 6 M hydrochloric acid, 50 mg of sodium chloride and 4 ml of a Clonixin was a generous gift of Janssen-Cilag
mixture of chloroform–methanol (99.5:0.5) were
(Amadora, Portugal). p-Chlorowarfarin (internal
added to a 1.0-ml urine aliquot in a screw-capped standard, I.S.) was supplied by Aldrich (Madrid,
glass tube. The tubes were thoroughly mixed for 15 Spain). All solvents were HPLC grade from E.
min. After centrifugation at 4500 rpm for 5 min, the Merck (Darmstadt, Germany). Other reagents were
organic layer was transferred to a clean glass tube of analytical-reagent grade, also from E. Merck.
and evaporated to dryness under a stream of nitrogen at 458C. The residue was reconstituted with 100 ml
2.2. High-performance liquid chromatography of methanol and 20 ml were injected into the HPLC
(HPLC) apparatus.
The HPLC pumping system used in this study was 2.5. Validation study
a Merck–Hitachi L-6000A pump. The mobile phase
was 28% acetonitrile, 36% methanol and 36% of To assess linearity in plasma samples, two
cali-0.3% acetic acid solution at a flow-rate of 1.0 ml / bration curves were prepared. A lower calibration
min. Sample injection was performed with a Waters curve ranging from 0.010 to 2.0 mg / ml and a upper
717 Plus autosampler. The HPLC column (25034.0 calibration curve ranging from 0.10 to 26.6 mg / ml.
mm I.D.) was a Nucleosil-100, 5-mm C18 column, A single calibration range was prepared in urine
coupled to a mBondapak C18 guard-column. A from 0.020 to 2.0 mg / ml. Standard samples were
Waters 486 UV detector set at 290 nm (0.005 AUFS) prepared by spiking drug-free plasma and urine with
was used to monitor the column effluent. A Merck– clonixin and the internal standard following
extrac-Hitachi D-2500 Chromato-Integrator was used to tion and analysis as described above. The peak
measured and the calibration curves were obtained had the approval of the clinical unit Ethics
Commit-2
by least-squares weighted (1 / conc ) linear regres- tee.
sion. Regression lines were used to determine
clonix-in concentrations clonix-in the test samples. 2.7. Pharmacokinetic analysis
The absolute recovery of clonixin extracted from
urine and plasma samples was assessed by compar- All pharmacokinetic parameters were determined
ing the peak heights of extracted plasma and urine by non-compartmental models. The slope of the
samples, containing known amounts of drug, with terminal log–linear portion of the clonixin
concen-those obtained from standard solutions of clonixin, tration versus time profiles was determined by the
prepared in methanol–water (1:1), at the same best fit least-squares regression analysis and used as
concentration levels. The concentrations of clonixin the elimination rate constant (K ). The apparente
tested in plasma samples were 0.010, 0.020, 0.40 and elimination half-life (t1 / 2) was determined as ln 2 /
2.0 mg / ml, while in urine samples the concentration K . The area under the concentration versus timee
levels were 0.020, 0.40 and 2.0 mg / ml. curve of clonixin in plasma from time zero to the last
Intra- and inter-assay RSDs and relative errors quantifiable point (AUC02t) was calculated by the
(REs) were used to assess the precision and accuracy linear trapezoidal rule, from time zero to tmax, and by
of the methods. In plasma samples these concen- the log-linear trapezoidal rule, beyond tmax until the
tration levels were 0.010, 0.020, 0.40, 2.0 and 8.5 last quantifiable point (C ). Extrapolated area undert
mg / ml. Additional evaluation for precision and the curve, from C to infinity (AUCt t 2inf) was
de-accuracy was performed at 15.9 and 26.6 mg / ml. In termined as C /K . Total area under the curvet e
urine samples the tested levels were those used for (AUC02inf) was the sum of AUC02t and AUCt – inf.
assessing absolute recovery. The maximum plasma concentration (Cmax) and the
Validation studies also included specificity tests in time to reach Cmax (tmax) were taken directly from
six individual plasma and urine samples, room the observed concentration versus time data.
temperature stability, long-term stability and freeze– thaw stability.
3. Results and discussion
2.6. Application of the plasma method
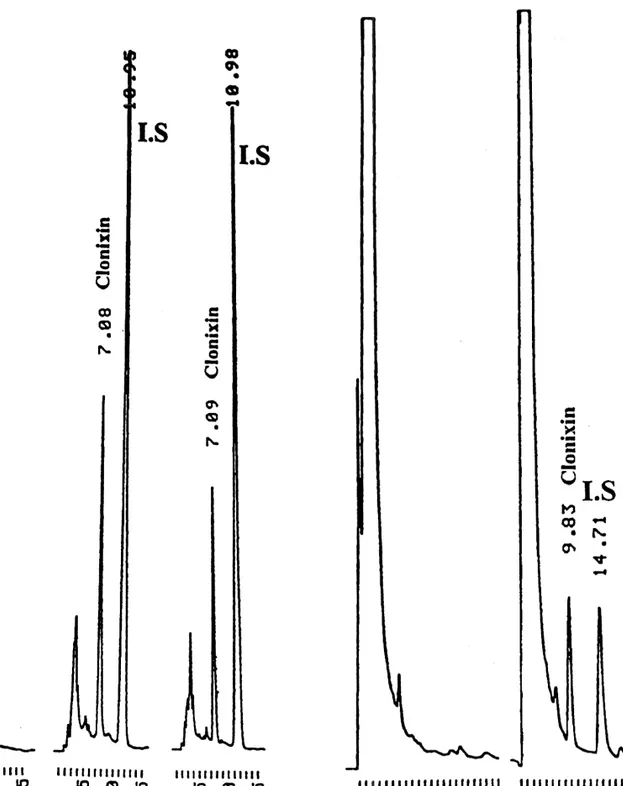
The chromatograms of blank plasma, spiked
plas-The analytical procedure was applied to the analy- ma with clonixin and internal standard and plasma
sis of plasma samples from a pilot pharmacokinetic from a subject dosed with Clonix, are shown in Fig.
and bioavailability study of clonixin, following the 2a–c, respectively. Chromatograms of blank urine
administration of Clonix (Janssen-Cilag) 300-mg and urine spiked with clonixin and internal standard
immediate release gelatine capsules, from a commer- are shown in Fig. 3a,b. No interfering peaks were
cially available batch (no. 7G128A; expiry date, July observed at the clonixin retention times.
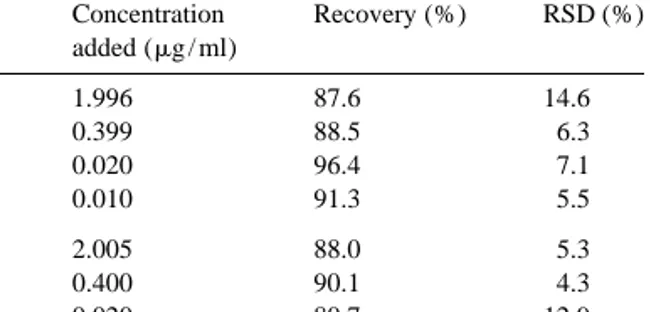
2000) and two, 150 and 300 mg, in house-prepared The absolute recovery of clonixin from plasma
oral aqueous solutions. Six healthy male volunteers, and urine samples (Table 1) ranged from 87.6 to
aged 22–31 years, participated in the clinical in- 96.4% and 80.7 to 90.1%, respectively. All
cali-vestigations. None of the subjects had any relevant bration lines showed to be linear over the
con-medical history or was on any other medication. centrations range examined with a r .0.9953.
Subjects fasted overnight prior to the administration Tables 2 and 3 include the data obtained for the
at 08:00 h. Blood samples were withdrawn until 14 h precision and accuracy. Maximum intra- and
inter-post-administration and transferred to lithium heparin day precision was 11.06 and 8.07% for plasma and
Luer Monovette tubes (Sarstedt, Portugal). The urine, respectively. The accuracy observed for
plas-resulting plasma (2500 rpm for 10 min, 58C) was ma and urine samples, ranged from 21.67 to
stored frozen below 2208C in polypropylene tubes, 10.70% and from 21.90 to 7.68%, respectively.
pending analysis. All the subjects gave informed Additional data obtained during the analysis of
Fig. 2. Typical chromatograms of a blank plasma sample (a), a
plasma spiked with clonixin and I.S. (b) and a sample from a Fig. 3. Typical chromatograms of a blank urine sample (a) and a subject dosed with Clonix (c). urine sample spiked with clonixin and I.S. (b).
Table 1 times lower than that reported by Gonzales-Martin et´ Recovery of clonixin from plasma and urine al. [13], for serum samples.
Concentration Recovery (%) RSD (%) Clonixin proved to be stable under different
added (mg / ml) conditions. After three freeze–thaw stability cycles Plasma 1.996 87.6 14.6 of samples spiked with 0.4 mg / ml of clonixin (n 5
(n 56) 0.399 88.5 6.3 6), a negligible difference was observed from time 0.020 96.4 7.1 zero to the last cycle. At room temperature, clonixin
0.010 91.3 5.5
showed to be stable for at least 24 h, both in plasma
Urine 2.005 88.0 5.3 and urine samples at 0.4 mg / ml (n 56), with 23.3
(n 56) 0.400 90.1 4.3
and 24.6% differences observed from time zero to
0.020 80.7 12.9
24 h after sample preparation.
Long-term stability of stored samples at or below 2208C was assessed by analysing six replicate
of 3.22% (n 56) and 6.79% (n 58), at 16.0 and 26.6 stability samples at a nominal concentration of 0.4
mg / ml, respectively, while accuracy was 1.29% and mg / ml in comparison with daily prepared samples at 20.06%, respectively. The LOQ was defined as the the same concentration level. Plasma samples proved
minimum determinable concentration with a relative to be stable for at least 14 weeks (23.4%), while
error below 20% [14]. This was 10 ng / ml (RE, urine samples were stable for at least 4 weeks
21.67%) and 20 ng / ml (RE, 21.90%), respectively, ( 13.5%). These results indicate a good stability of
in plasma and urine. This limit of quantification is 10 clonixin in both types of biological matrix. So far, no
Table 2
Within and between-day precision and accuracy for plasma samples
Concentration Concentration found RSD (%) RE (%)
added (mg / ml) (mg / ml) Within-day 8.506 9.41660.6343 6.74 10.70 (n 56) 1.996 2.07160.0390 1.88 3.74 0.399 0.42560.0138 3.26 6.40 0.020 0.019860.0010 5.18 21.25 0.010 0.009860.0011 11.06 21.67 Between-day 8.506 8.61960.5351 6.21 1.33 (n 512) 1.996 2.08660.1441 6.91 4.52 0.399 0.40360.0379 9.40 1.11 0.020 0.019760.0013 6.47 21.63 0.010 0.009860.0008 8.32 21.58 Table 3
Within and between-day precision and accuracy for urine samples
Concentration Concentration found RSD (%) RE (%)
added (mg / ml) (mg / ml) Within-day 2.005 2.02160.0218 1.08 0.77 (n 56) 0.400 0.41460.0203 4.89 3.48 0.020 0.019660.0015 7.72 21.90 Between-day 2.005 2.11860.0933 4.40 5.64 (n 518) 0.400 0.43160.0237 5.50 7.68 0.020 0.020260.0016 8.07 1.15
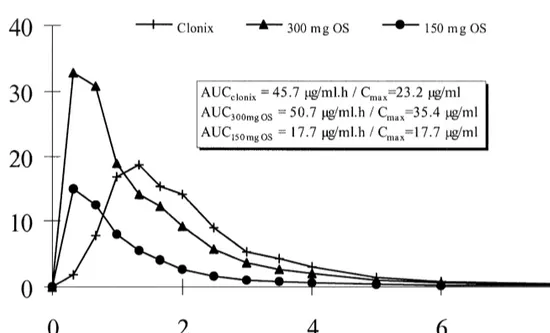
Fig. 4. Mean plasma levels of clonixin with AUC and Cmaxresults (n 56).
information regarding clonixin stability in biological AUC and Cmax. Similar results were obtained from
samples has been published. the analysis of both oral solutions, with ANOVAlog
Fig. 4 shows the mean plasma profiles of clonixin intra-subject RSDs of 15.5 and 18.8%, respectively,
(n 56) following administration of the three study for AUC02inf and Cmax.
formulations. Geometric mean AUC02inf values (n 5 The results reported clearly show that the
val-6) represent essentially true experimental values, as idated HPLC method for plasma samples is
applic-the mean extrapolated AUCt 2inf, was 0.01% for both able for the determination of clonixin in human
Clonix and the 300 mg oral solution and 0.03% for plasma samples from pharmacokinetic studies.
the 150 mg oral solution. As indicated by the Cmax
values, clonixin absorption was considerably
re-tarded after administration of the solid oral formula- References
tion, when compared with the oral solutions.
How-ever, the rate of absorption remained unchanged [1] A.S. Watnick, R.I. Taber, I.I. Tabachnick, Arch. Int.
Phar-when the same formulation was given at two differ- macodyn. 190 (1971) 78.
ent dose levels. [2] V.B. Ciofalo, J. Patel, R.I. Taber, Jpn. J. Pharmacol. 22
21 (1972) 749.
The plasma elimination rate constant (0.45 h )
[3] H. Frerick, Zahnarztliche Praxis 10 (1994) 342.
was very similar for all three formulations and in
´
[4] M.L. Marti, C. Fraga, J.A. Pezza, Prensa Med. Argentina S8
accordance with that previously reported [11], fol- (1993) 695.
lowing single oral dose administration of a solid [5] G. Nassoweter, Presented at the 1st International Conference
preparation. The apparent elimination half-lives were on Pain, Buenos Aires, 19–20 April.
[6] M. Osswald, H. Frerick, J. Maisenbacher, N. Schenk, P.
1.6, 1.7 and 1.5 h, respectively, for Clonix, the
Grabner, ZWR 103 (1994) 381.
300-mg and the 150-mg oral solutions.
[7] H. Paredes, M. Camus, G. Ballesteros, C. Rondon, Presented
Analysis of variance (ANOVAlog) intra-subject at the 7th World Congress on Pain, Paris, 22–27 August.
RSDs for the comparison of Clonix versus. the 300 [8] K. Schaffer, C.H. Wauschkuhn, Presented at the 7th World
[9] J.S. Finch, T.J. DeKornefeld, J. Clin. Pharmacol. 15 (1971) [12] B. Katchen, S. Buxbaum, J. Ning, J. Pharmacol. Exp. Ther.
371. 187 (1973) 152.
˜ ´
[10] J.M.G. Santos Bessa, J.M. Silva e Costa, Rev. Portuguesa [13] G. Gonzalez-Martin, C. Cattan, S. Zuniga, Int. J. Clin. ´
Clın. Ter. 9 (1985) 1. Pharmacol. Ther. 34 (1996) 396.
[11] B. Katchen, S. Buxbaum, J. Meyer, J. Ning, J. Pharamacol. [14] V.P. Shah et al., J. Pharm. Sci. 81 (1992) 309. Exp. Ther. 184 (1973) 453.