For Review Only
Forest fires in Mediterranean countries: CO2 emissions and mitigation possibilities through prescribed burning
Journal: Environmental Management Manuscript ID: ENM-10-0321.R1
Journal Article: Research
Keywords: Forest fires, Prescribed burning, CO2 emissions, Kyoto Protocol
Abstract:
Forest fires are an integral part of the ecology of the Mediterranean Basin; however, fire incidence has increased dramatically during the past decades and fire is expected to become more prevalent in the future due to climate change. Fuel modification by prescribed burning reduces the spread and intensity potential of subsequent wildfires. We used the most recently published data to calculate the average annual wildfire CO2 emissions in France, Greece, Italy, Portugal and Spain following the IPCC guidelines. The effect of prescribed burning on emissions was calculated for four scenarios of prescribed burning effectiveness based on data from Portugal. Results show that prescribed burning could have a considerable effect on the carbon balance of the Land Use, Land-Use Change and Forestry (LULUCF) sector in Mediterranean countries. However, uncertainty in emission estimates remains large, and more accurate data is needed, especially regarding fuel load and fuel consumption in different vegetation types and fuel layers and the total area protected from wildfire per unit area treated by prescribed burning, i.e. the leverage of prescribed burning.
For Review Only
Forest fires in Mediterranean countries: CO2 emissions and mitigation possibilities
1
through prescribed burning 2 3 4 5 6 3 4 5 6 7 8 9 10 11 12 13 14 15 16 17 18 19 20 21 22 23 24 25 26 27 28 29 30 31 32 33 34 35 36 37 38 39 40 41 42 43 44 45 46 47 48 49 50 51 52 53 54 55 56 57 58 59 60
For Review Only
1
Introduction 2
Fire is a fundamental disturbance in the Mediterranean region. Paleoecological studies 3
show that fires were common during the late Quarternary and many species are adapted 4
to frequent fire events (Carrión and others 2003, Pausas and others 2008). Although fire 5
is intrinsic to Mediterranean ecosystems, the number of fires has increased dramatically 6
during the recent decades, mostly due to changes in land use (Pausas 2004, Pausas and 7
others 2008). From 1996 to 2005 the annual average number of fires in Southern Europe 8
exceeded 61 000, which is 34% more than recorded during 1986-1995 (Miranda and 9
others 2009), and currently 0.5 million hectares are burned every year in the five 10
southern EU member states (Portugal, Spain, Greece, Italy, France) (EC 2009). As a 11
result of more frequent and more severe fires, Mediterranean ecosystems can experience 12
loss of biodiversity and soil erosion and desertification (Pausas and others 2008). Fires 13
also cause large economic losses and threaten human lives. In addition, forest fires are a 14
remarkable source of greenhouse gases (GHG). In Portugal the exceptionally large 15
forest area burned in 2003 turned the land use, land-use change and forestry (LULUCF) 16
sector from a net sink into a carbon source of 7 076 Gg CO2 (FCCC 2006).
17
Climate and weather are major factors influencing fire incidence. Summer drought and 18
area burned are strongly linked (Camia and Amatulli 2010, Carvalho and others 2010, 19
Flannigan and Harrington 1988, Pausas 2004, Pinol and others 1998). Over the next 100 20
years, climate change is expected to result in summer temperature increases of 4-5 °C 21
throughout Southern Europe and up to 50% decreases in rainfall during summer, which 22
means more extended hot periods and droughts and hence increased fire risk (Lindner 23
and others 2010). In Portugal, dramatic increases in fire occurrence and area burned of 24 3 4 5 6 7 8 9 10 11 12 13 14 15 16 17 18 19 20 21 22 23 24 25 26 27 28 29 30 31 32 33 34 35 36 37 38 39 40 41 42 43 44 45 46 47 48 49 50 51 52 53 54 55 56 57 58 59 60
For Review Only
respectively 279% and 478% are predicted for 2071-2100 in comparison with the 1980-1
1990 period (Carvalho and others 2010). 2
Prescribed burning can be used to manage forest fuels to reduce fire risk (e.g. Fernandes 3
and Botelho 2004, Fernandes and others 2004). Prescribed burning decreases the 4
intensity of wildfires by decreasing fuel loads and by disrupting the horizontal and 5
vertical continuity of the fuel complex (Fernandes and Botelho 2003). Prescribed 6
burning has been shown to substantially decrease potential or actual fire intensity in 7
western USA forests (Arno and Brown 1989, Ager and others 2010, Finney and others 8
2005, Stephens and Moghaddas 2005) and in European pine stands (Fernandes and 9
Botelho 2004, Fernandes and others 2004, Fernandes 2009). The objective of prescribed 10
burning is not to exclude unplanned fires from the landscape, but to decrease their 11
intensity and damage caused thus preventing large and catastrophic fires (Fernandes and 12
Botelho 2003, Loehle 2004). However, fire management in Europe relies heavily on fire 13
suppression and disregards fuel treatments, e.g. Fernandes (2008), and prescribed 14
burning is either not used or remains underdeveloped (Lázaro 2010). 15
As a by-product, prescribed burning could also result in a net reduction of CO2
16
emissions from forest fires. Fire emissions have been thoroughly studied in different 17
parts of the world, but few studies have considered prescribed burning in the context of 18
carbon emissions mitigation. Wiedinmyer and Hurteau (2010) found that wide-scale 19
prescribed fire application in the western USA could reduce CO2 emissions from forest
20
fires by 18-25% and as much as by 60% in specific forest systems. Narayan and others 21
(2007) studied the effects of prescribed burning on GHG emissions for 33 European 22
countries. Their results indicated that the potential of prescribed burning as an emission 23
mitigation technique is rather low for most European countries, albeit prescribed 24
burning could be used to mitigate emissions in Southern Europe where wildfire 25 3 4 5 6 7 8 9 10 11 12 13 14 15 16 17 18 19 20 21 22 23 24 25 26 27 28 29 30 31 32 33 34 35 36 37 38 39 40 41 42 43 44 45 46 47 48 49 50 51 52 53 54 55 56 57 58 59 60
For Review Only
incidence is high. Defossé and others (2011) evaluated the potential of prescribed 1
burning for reducing greenhouse gas emissions in pine afforestations in the Andean 2
region of Patagonia, Argentina. Their results suggest that prescribed burning would 3
reduce CO2 emissions by 44% compared to the situation without prescribed fire and the
4
avoided wildfires would allow an additional 78% GHG emission mitigation due to extra 5
biomass growth. Using prescribed burning and other fuel treatments to increase the 6
resistance of fire-prone forests to wildfire should improve their long-term carbon 7
storage (North and others 2009, Stephens and others 2009), although the conclusion is 8
affected by the carbon accounting system used (Sorensen and others 2011). Whether or 9
not prescribed burning can contribute to carbon sequestration depends on how it 10
changes the fire regime, especially in respect to the overall area burned and fire 11
intensity (Bradstock and Williams 2009). 12
Our aim is to calculate average CO2 emissions from wildfires in the Mediterranean
13
countries and then estimate the potential of prescribed burning to mitigate emissions, by 14
following the IPCC guidelines and using the most recent data available. We also assess 15
the effectiveness of prescribed burning in the Kyoto Protocol context. 16
17
Data and methods 18
19
Approach 20
The total amount of burned biomass was calculated as per Seiler and Crutzen (1980): 21
M=A × B × CF [g dry matter per year (g dm/yr)], 22 3 4 5 6 7 8 9 10 11 12 13 14 15 16 17 18 19 20 21 22 23 24 25 26 27 28 29 30 31 32 33 34 35 36 37 38 39 40 41 42 43 44 45 46 47 48 49 50 51 52 53 54 55 56 57 58 59 60
For Review Only
where A is the total land area burned annually [m2/yr], B is the the average organic 1
matter per unit area [g dm/m2], and CF is the biomass burning efficiency. Burned 2
biomass was then converted into CO2 emissions, Ec, using the equation:
3
Ec=M × Efc
4
where Efc is the emission factor, as the weight of released CO2 per weight of dry matter
5
burned. 6
We followed the IPCC guidelines (IPCC 2006) and differentiated three fuel 7
components: aboveground tree biomass (further separated into foliage and branches), 8
deadwood, and litter. 9
10
Area burned and biomass
11
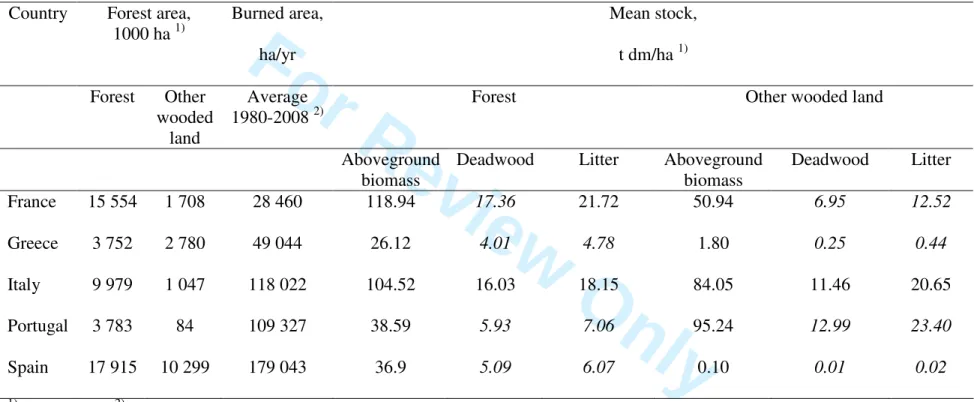
Because the aim was to calculate average annual emissions, the long-term (1980-2008) 12
annual average burned area (European Commission 2009) was used in the calculations 13
(Table 1). To estimate biomass in the burned area, first the mean biomass stock (t/ha) 14
for each fuel compartment (aboveground biomass, deadwood and litter) was calculated 15
using average data of forest and other wooded land from the Global Forest Resources 16
Assessment (FAO 2005). Since the burned area includes both forest and other wooded 17
land, we calculated biomass in the burned area using average values of forest and other 18
wooded land. Biomass allocation (Vilén and others 2005) was then used to calculate the 19
share of foliage and branches biomass from the total aboveground biomass. Deadwood 20
data were available for France and Italy only, and litter data was available just for Italy. 21
Therefore, we calculated the share of deadwood and litter from aboveground biomass 22
based on the data for Italy and France and used these proportions to estimate the carbon 23 3 4 5 6 7 8 9 10 11 12 13 14 15 16 17 18 19 20 21 22 23 24 25 26 27 28 29 30 31 32 33 34 35 36 37 38 39 40 41 42 43 44 45 46 47 48 49 50 51 52 53 54 55 56 57 58 59 60
For Review Only
stock of these compartments for the other countries (Table 1). The Global Forest 1
Resources Assessment data (FAO 2005) for deadwood and litter are given as carbon 2
stocks only, and the values were converted back to dry mass by assuming factors of 0.5 3
carbon units per fuel weight unit for deadwood (IPCC 2006) and 0.37 for litter (Smith 4
and Heath 2002). The total biomass in the burned area was then calculated by 5
multiplying burned area and the calculated mean biomass stocks of different biomass 6
compartments (foliage, branches, deadwood and litter). 7 8 TABLE 1. 9 Combustion factors (CF) 10
Usually only a fraction of the aboveground biomass burns, and most standing biomass 11
remains in the stand as living trees, dead organic matter or charcoal. The combustion 12
factor (CF) is the fraction of biomass exposed to fire that is actually consumed (Ito and 13
Penner 2003). In Mediterranean conditions, the mean combustion factor of aboveground 14
tree biomass was assumed to be 1 for foliage and 0.1 for branches in a crown fire 15
(Reinhardt 1997). These factors were adjusted by 0.75 assuming that 75% of the burned 16
area is the resultant of a crown fire. Belowground biomass was assumed to be left 17
unburned. A combustion factor of 0.9 was used for both litter and deadwood, which 18
corresponds to the customary near-complete removal by fire under the Mediterranean 19
dry summer conditions (e.g. Fernandes and others 2004). 20 21 Emission factors (Efc) 22 23 3 4 5 6 7 8 9 10 11 12 13 14 15 16 17 18 19 20 21 22 23 24 25 26 27 28 29 30 31 32 33 34 35 36 37 38 39 40 41 42 43 44 45 46 47 48 49 50 51 52 53 54 55 56 57 58 59 60
For Review Only
The emission factor is defined as the amount of a released compound per amount of dry 1
fuel consumed, expressed in units of g/kg (Andreae and Merlet 2001). The emission 2
factors from Carvalho and others (2007) for Mediterranean conditions were used. Since 3
CO2 emission factors are given separately for coniferous and broadleaved trees with
4
1627 g/kg and 1393 g/kg, respectively, we divided the burned forest area into 5
predominantly conifers, predominantly broadleaved and mixed forests on the basis of 6
forest data from MCPFE 2007. An emission factor was not available for mixed forests, 7
which were attributed with the average value of coniferous and broadleaved fuels, i.e. 8
1510 g/kg. The mixed forest value was also used for deadwood and litter in the absence 9
of more adequate data. 10
11
Effect of prescribed burning 12
13
Prescribed burning will not benefit the carbon balance unless it succeeds in decreasing 14
the area burned by wildfire. This effect is directly quantifiable by determining the 15
leverage (Loehle 2004) or return for effort (Price and Bradstock 2011) of prescribed 16
burning, i.e. the area protected (saved) from wildfire per unit area treated by prescribed 17
fire. In Europe, this analysis is precluded by the absence of long-term prescribed 18
burning programs. However, analysis of past wildfire data can be used to uncover the 19
general effect of fuel reduction (as opposed to weather) on future area burned. We 20
determined burning leverage using data from Portugal, which is characterized by wide 21
regional variation in fire incidence and variety in land use and land cover (Nunes and 22
others 2005). 23
We divided Portugal (≈ 89 x 103 km2) into its 12 ecoregions (Albuquerque 1961). For 24
each ecoregion and year (1998 to 2010) we used official Forest Service data to 25 3 4 5 6 7 8 9 10 11 12 13 14 15 16 17 18 19 20 21 22 23 24 25 26 27 28 29 30 31 32 33 34 35 36 37 38 39 40 41 42 43 44 45 46 47 48 49 50 51 52 53 54 55 56 57 58 59 60
For Review Only
determine: (i) wildfire incidence as the percentage area of forest and shrubland burned; 1
(ii) cumulative wildfire incidence in the preceding two to eight years; and (iii) the 50th, 2
90th and 95th percentiles of the Canadian Fire Weather Index (FWI) (Van Wagner 1987), 3
used in Portugal for fire danger rating. 4
The variables within groups (ii) and (iii) were assessed for their ability to explain 5
variation in fire incidence. The selected variables and ecoregion were used as 6
independent variables to model wildfire incidence; we used linear mixed modelling 7
(with year as the random variable) to account for the lack of independence between 8
cumulative fire incidences within each ecoregion. Burn leverage should vary with fire 9
incidence. To identify extremes in burn leverage that could be used in emissions 10
scenarios, we distinguished between ecoregions displaying low (mean annual burned 11
area <2%) and high (mean annual burned area ≥5%) incidence of fire, and fitted 12
separate models to the respective sub-sets of data. Burn leverage was interpreted as the 13
slope of the equation relating wildfire incidence and past fire incidence, multiplied by 14
the time period (Boer and others 2009, Price and Bradstock 2011). The burn leverage 15
estimates were compared with those calculated from the output of the BehavePlus fire 16
modelling system (Andrews and others 2008). 17
Estimation of the prescribed burning effect considered two levels in treatment effort, 18
respectively 2% and 20% of the mean annual area burned by wildfire, and reflecting the 19
current degree of prescribed fire development in Portugal [http://www.afn.min-20
agricultura.pt] and in France (Lázaro 2010). While the treatment effort in Spain is 21
comparable to Portugal, prescribed fire programs are absent from Greece and Italy. The 22
two levels in treatment effort were combined with the two burn leverage extremes, 23
hence resulting in four emission scenarios for prescribed burning. 24 3 4 5 6 7 8 9 10 11 12 13 14 15 16 17 18 19 20 21 22 23 24 25 26 27 28 29 30 31 32 33 34 35 36 37 38 39 40 41 42 43 44 45 46 47 48 49 50 51 52 53 54 55 56 57 58 59 60
For Review Only
Combustion factors for prescribed burning were assumed to be 0.5 for litter and 0.2 for 1
deadwood. Although prescribed burning should not damage overstory trees, a 2
combustion factor of 0.05 was used for foliage biomass to avoid overestimating the 3
mitigation effect of prescribed burning. These combustion factors were based on an 4
extensive database of experimental fires (Fernandes and others 2009). The mitigation 5
effect of each scenario was then calculated by comparing emissions with and without 6 prescribed burning. 7 8 Kyoto Protocol 9 10
To evaluate the effectiveness of prescribed burning in the Kyoto Protocol context, we 11
compared the emissions mitigation with the year 2007 carbon stock losses of the 12
LULUCF sector, as reported in the 2009 National Inventory submissions for UNFCCC 13
(UNFCCC 2009). There the gains and losses of living biomass and net carbon stock 14
change of dead organic matter are reported. Under Article 3.4 of the Kyoto Protocol, 15
Parties may elect additional human-induced activities related to LULUCF specifically, 16
forest management, cropland management, grazing land management and revegetation, 17
to be included in their accounting of anthropogenic GHG emissions and removals for 18
the first commitment period. Upon election, this decision by a Party is fixed for the first 19
commitment period. When LULUCF activities under Article 3.4 result in a net removal 20
of GHGs, an Annex I Party can issue removal units (RMUs) on the basis of these 21
activities as part of meeting its commitments. Thus we considered the mitigation effect 22
also in regards to the Article 3.4 of the Kyoto Protocol, comparing the mitigated 23
wildfire emissions with the Article 3.4 maximum eligible sink in the countries studied. 24 25 3 4 5 6 7 8 9 10 11 12 13 14 15 16 17 18 19 20 21 22 23 24 25 26 27 28 29 30 31 32 33 34 35 36 37 38 39 40 41 42 43 44 45 46 47 48 49 50 51 52 53 54 55 56 57 58 59 60
For Review Only
Uncertainty analysis 1
To get an estimate of the overall uncertainty in wildfire emission estimates, we 2
combined the uncertainty of different factors using the error propagation equation 3 (IPCC 2006) 4 2 2 2 2 1 ... n total U U U U = + + + 5
where Utotal is the percentage uncertainty in the product of the quantities and Ui are the 6
percentage uncertainties associated with each quantity. 7
In error propagation, we used uncertainty estimates from Andreae and Merlet (2001): 8
50% uncertainty for burned biomass, mainly attributable to the biomass estimate in the 9
burned area and the biomass consumption by fire, and 30% uncertainty for the emission 10 factor. 11 12 Results 13 14 Wildfire emissions 15 16
Estimated annual average fire emissions in the Mediterranean countries ranged from 17
5816 Gg CO2 in Italy to 359 Gg CO2 in Greece (Table 2). Litter produced most of the
18
emissions, around 49%, and deadwood and aboveground biomass represented around 19
36% and 15% of emissions in all countries, respectively. Lack of data precluded 20
consideration of the emissions coming from soil. Average fire emissions were largest in 21
Italy (Table 2) although Spain registers the highest average burned area (Table 1), 22
because the mean aboveground biomass stock (average of forest and other wooded land) 23 3 4 5 6 7 8 9 10 11 12 13 14 15 16 17 18 19 20 21 22 23 24 25 26 27 28 29 30 31 32 33 34 35 36 37 38 39 40 41 42 43 44 45 46 47 48 49 50 51 52 53 54 55 56 57 58 59 60
For Review Only
in Italy is 94.3 t/ha whereas in Spain it is 18.5 t/ha only, based on FRA 2005 data (FAO 1
2005). High fuel loads in France also lead to quite high emissions although the annually 2
burned area is the lowest of the studied countries. 3
4
TABLE 2. 5
6
Prescribed burning leverage 7
8
Mean annual wildfire incidence over the 13-year period varied from 0.66% to 6.81% 9
across the Portuguese ecoregions, with an overall mean of 3.62% and means of 0.94% 10
and 5.96% for the ecoregions with low and high fire incidence. The variables selected 11
for inclusion in the fire incidence model were the FWI 95th percentile and the % area 12
burned in the past 6 years. Both variables, as well as ecoregion, were statistically 13
significant at the p<0.05 level (Table 3). 14
15
TABLE 3. 16
17
The regression coefficients for 6-year fire incidence imply burn leverages of 1.0 and 18
1.8, respectively when wildfire incidence is low and high. The extent and spatial 19
organization of fuel treatments affect how landscape fire spread is disturbed. If the 20
treatment effect persists for 6 years and an annual treatment rate of 5% is assumed, then 21
fire spread will be disrupted or delayed over 30% of the landscape at any given time. 22
The corresponding BehavePlus simulation indicates burn leverages of 1.5 and 2.9, 23
respectively when prescribed burning placement is random or strategic. Based on these 24
results, emissions are calculated for two extremes in prescribed burning leverage: a 1 ha 25
decrease in the area burned by wildfire for each treated ha, where low wildfire incidence 26 3 4 5 6 7 8 9 10 11 12 13 14 15 16 17 18 19 20 21 22 23 24 25 26 27 28 29 30 31 32 33 34 35 36 37 38 39 40 41 42 43 44 45 46 47 48 49 50 51 52 53 54 55 56 57 58 59 60
For Review Only
determines that the chance of a wildfire encountering a previously burned area is low; 1
and a 3-ha wildfire area decrease per ha treated, where wildfire incidence is high and the 2
spatial pattern of prescribed burning is optimized. 3
4
Mitigation of emissions by prescribed burning 5
6
The effect of prescribed burning is based on four scenarios for treatment effort and 7
impact on wildfire area: 8
I) 2% of the annually burned area treated by prescribed fire, assuming 1 ha 9
decrease in the area burned by wildfire for each treated ha 10
II) 2% of the annually burned area treated by prescribed fire, assuming 3 ha 11
decrease in the area burned by wildfire for each treated ha 12
III) 20% of the annually burned area treated by prescribed fire, assuming 1 ha 13
decrease in the area burned by wildfire for each treated ha 14
IV) 20% of the annually burned area treated by prescribed fire, assuming 3 ha 15
decrease in the area burned by wildfire for each treated ha
16
Figure 1 compares CO2 emissions for the four prescribed burning scenarios and the
17
situation without prescribed burning (baseline). Figure 1 shows that a small treated area 18
corresponds to minor decreases in emissions, even for the highest prescribed burning 19
leverage. Prescribed burning over an area equal to 2% of the average annually burned 20
area would lead to a reduction in emissions of only 1-5%, depending on the assumed 21
leverage of the treatment (Scenarios I and II). Conversely, the mitigation effect of the 22
other two prescribed burning scenarios both resulted in a substantial decrease in 23
emissions; fire emissions are around 13% lower with Scenario III and around 52% 24
lower with Scenario IV. 25 3 4 5 6 7 8 9 10 11 12 13 14 15 16 17 18 19 20 21 22 23 24 25 26 27 28 29 30 31 32 33 34 35 36 37 38 39 40 41 42 43 44 45 46 47 48 49 50 51 52 53 54 55 56 57 58 59 60
For Review Only
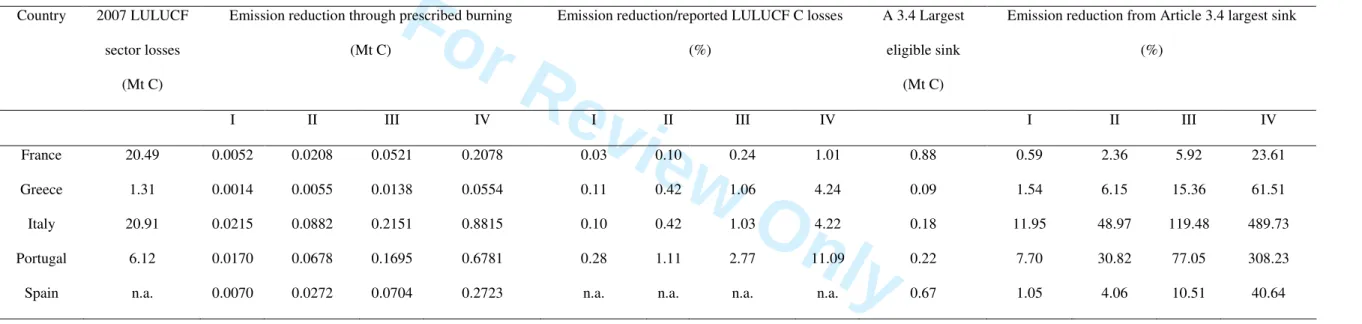
In the Kyoto Protocol, emissions from forest fires are part of the LULUCF sector 1
balance and are calculated as losses from forest carbon stocks. Therefore we compared 2
our results with the LULUCF data from the UNFCCC National Inventory Submissions 3
2009 to assess the magnitude of the mitigation effect accomplished by prescribed 4
burning. In addition, we compared the emissions reduction with the Article 3.4 largest 5
eligible sink (Table 4). Here we present the results as carbon, because sinks and losses 6
as well as Article 3.4 largest eligible sinks are presented as carbon (Mt C) in the Kyoto 7 Protocol. 8 9 FIGURE 1. 10 11 TABLE 4. 12
Table 4 shows that the decrease in emissions resulting from prescribed burning scenario 13
IV is also substantial in the context of the Kyoto Protocol. Compared to the LULUCF 14
sector reported losses in 2009, the decrease in carbon stock losses were 1-11%, 15
depending on the country (Table 4). If prescribed burning would be accounted for as an 16
Article 3.4 forest management activity, even Scenarios I and II would lead to a 0.6-31% 17
reduction in emissions of the Article 3.4 largest eligible sink, depending on country. For 18
Scenarios III and IV, the largest eligible sink would be achieved in Italy and Portugal. 19
Thus, prescribed burning could have a considerable effect on the carbon balance of the 20 LULUCF sector. 21 22 Discussion 23 3 4 5 6 7 8 9 10 11 12 13 14 15 16 17 18 19 20 21 22 23 24 25 26 27 28 29 30 31 32 33 34 35 36 37 38 39 40 41 42 43 44 45 46 47 48 49 50 51 52 53 54 55 56 57 58 59 60
For Review Only
1
Uncertainties 2
3
The annually burned area used in the calculations was the annual average for the period 4
1980-2008 based on official statistics (European Commission 2009) including both 5
forests and other wooded lands. To estimate the biomass in the burned area, we 6
calculated the average biomass of the forest and other wooded land based on the FAO 7
Forest Resource Assessment data (FAO 2005). Because data for all fuel compartments 8
was not available for all of the studied countries, we had to estimate the missing values 9
based on existing data. Furthermore, we excluded understorey vegetation from the 10
calculations due to lack of data. Understorey vegetation can be an important fuel 11
compartment, especially in open Mediterranean forests, and its exclusion 12
underestimates CO2 emissions. However, because understorey vegetation is burned in
13
both wildfires and prescribed fires, its absence from the calculations has only a minor 14
effect on the results when comparing wildfire and prescribed burning emissions. 15
The combustion factor used in the calculations has a large impact on the results. Since 16
only a fraction of the aboveground biomass is consumed by fire, usually the foliage and 17
the finer branches, we used biomass allocation shares (Vilén and others 2005) to 18
estimate the aboveground biomass fractions of foliage and branches. Then separate 19
combustion factors were used for foliage and branches instead of applying a single 20
combustion factor to the whole aboveground biomass. Emission factors used in this 21
study were suited for Mediterranean ecosystems (Carvalho and others 2007). 22 3 4 5 6 7 8 9 10 11 12 13 14 15 16 17 18 19 20 21 22 23 24 25 26 27 28 29 30 31 32 33 34 35 36 37 38 39 40 41 42 43 44 45 46 47 48 49 50 51 52 53 54 55 56 57 58 59 60
For Review Only
The results reliability is thus affected by multiple factors. To get a rough estimate of the 1
overall level of uncertainty in our results, we estimated total uncertainty by using 2
published estimates of uncertainty for the burned biomass and emission factor. The 3
results indicate that the degree of uncertainty in our fire emission estimates is very high, 4
the error propagation calculation resulting in a total uncertainty of ±58%. 5
6
Wildfire emissions 7
8
Wildfire emissions in the Mediterranean countries have been previously studied. 9
Narayan and others (2007) estimated emissions in 33 European countries when 10
investigating the potential for CO2 emissions mitigation through prescribed burning.
11
Miranda and others (2005) used models NFDRS and EMISPREAD to estimate the 12
emissions for the 2001 Southern European forest fires. A comparison of the results 13
(Table 5) shows that our study yields the highest country level estimates for all 14
countries but Greece. Different reference periods explain part of the differences; our 15
results are based on the long-term average burned area, while the others are either for a 16
single year (Miranda and others 2005) or a shorter time period average (Narayan and 17
others 2007). Individual years can deviate substantially from the long-term average. 18
Miranda and others (2005) studied the year 2001, when the burned area was quite low 19
compared to the term average, e.g. in Spain 93 297 ha burned compared to a long-20
term average of 179 043 ha (European Commission 2009). Furthermore, the use of 21
country level average biomass in the calculations presumably lead to an overestimation 22
of emissions, at least in Italy, where the highest incidence of fire (in the South) is not 23
coincident with the highest biomass stocks (in the North). 24 3 4 5 6 7 8 9 10 11 12 13 14 15 16 17 18 19 20 21 22 23 24 25 26 27 28 29 30 31 32 33 34 35 36 37 38 39 40 41 42 43 44 45 46 47 48 49 50 51 52 53 54 55 56 57 58 59 60
For Review Only
The differences between this study results and those of Narayan and others (2007) are 1
explainable by differences in methodology. Narayan and others (2007) converted the 2
combusted biomass into carbon before multiplying the values by the emission factor. 3
However, since the emission factor is the amount of a compound released per amount of 4
dry fuel consumed (Andreae and Merlet 2001), multiplying the consumed dry mass by 5
the carbon content leads to incorrect results. Furthermore, we took into account the 6
combustion of deadwood and litter instead of just estimating the emissions from 7
aboveground tree biomass. 8
9
TABLE 5. 10
11
Effectiveness of prescribed burning 12
13
Prescribed burning creates fuel-modified areas where the intensity of subsequent 14
wildfires is decreased, increasing the likelihood of fire suppression and leading to a 15
decrease in the number and size of large wildfires. Although many study cases are 16
available on the effects of prescribed burning on wildfire intensity and severity (e.g. 17
Fernandes and Botelho 2003, Finney and others 2005) it is difficult to assess the overall 18
effect of prescribed burning on wildfire incidence at the country level. Prescribed 19
burning effectiveness is not easy to estimate since it varies between ecosystems and is 20
affected by the overall fire management process (Fernandes and Botelho 2003). The 21
highest return for effort of prescribed burning is expected in litter-dominated systems 22
(e.g. Collins and others 2009) as opposed to shrub-dominated systems (e.g. Keeley 23
2002). Pinol and others (2005, 2007) used a simple simulation model to investigate 24 3 4 5 6 7 8 9 10 11 12 13 14 15 16 17 18 19 20 21 22 23 24 25 26 27 28 29 30 31 32 33 34 35 36 37 38 39 40 41 42 43 44 45 46 47 48 49 50 51 52 53 54 55 56 57 58 59 60
For Review Only
whether large wildfires in the Mediterranean region are a result of extreme weather 1
conditions or the cumulative effect of a policy of fire suppression over time. Their 2
results suggest that the total area burned is much the same regardless of fire suppression 3
and prescribed burning efforts; however, prescribed burning reduced fire intensity over 4
the landscape. Boer and others (2009) studied a 52-year fire history from a eucalypt 5
forest region in southwestern Australia to quantify the impact of prescribed burning on 6
the occurrence, extent and size distribution of wildfires. Their results indicate that 7
prescribed burning has significantly reduced the incidence and extent of unplanned 8
large fires, hence providing strong empirical evidence for its effectiveness in the 9
mitigation of wildfire hazard. However, because of differences in the fire environment, 10
ignition density and fire suppression, their results cannot be extrapolated to forests 11
elsewhere. 12
Narayan and others (2007) based their assumptions about prescribed burning 13
effectiveness on landscape fire spread modelling (Finney 2001, 2003), where a 14
prescribed burning effort around 10% of the annual wildfire area would decrease 15
wildfire incidence by 50%. Defossé and others (2011) studied the prescribed burning 16
effect in Patagonia and followed the assumptions adopted by Narayan and others 17
(2007). Finney and others (2007) worked with four case study areas in the western USA 18
and found that strategically placing fuel treatments reduces modelled landscape fire 19
growth rates under severe weather conditions more effectively than the random 20
allocation of fuel treatments. In fact, random fuel treatments had to be implemented at 21
about twice the treatment rate of optimally placed fuel treatments to achieve the same 22
reduction in fire growth rates. Our adopted scenarios are consistent with these findings. 23
It is reasonable to expect that strategically placed prescribed burning treatments will 24 3 4 5 6 7 8 9 10 11 12 13 14 15 16 17 18 19 20 21 22 23 24 25 26 27 28 29 30 31 32 33 34 35 36 37 38 39 40 41 42 43 44 45 46 47 48 49 50 51 52 53 54 55 56 57 58 59 60
For Review Only
perform better than random treatments, namely in the heterogeneous and fragmented 1
Mediterranean Basin landscapes (Fernandes and Botelho 2003). 2
There are also contradictory views about how reasonable it is to use prescribed burning 3
as a tool to maximize forest carbon stocks. Mitchell and others (2009) found that fuel 4
treatments can be effective in decreasing fire severity, but fuel removal almost always 5
reduces C storage more than the additional C that a stand is able to store when made 6
more resistant to wildfire. North and others (2009) studied the carbon released by 7
different fuel treatments in the western United States and suggest modifying current 8
treatments to focus on reducing surface fuels, actively thinning most small trees and 9
removing only fire-sensitive species in the merchantable, intermediate size-class. That 10
would result in the development of large, fire resistant trees and reduce emissions from 11
potential future wildfire. 12
Climate change is expected to result in more extensive and severe wildfires throughout 13
southern Europe (Carvalho and others 2009, Lindner and others 2010). Consequently 14
there is a pressing need for landscape-level fuel treatments, including prescribed 15
burning, which has been recognized by the IPPC (2007). The potential of prescribed 16
burning to manage forests and wildlands in Europe remains largely unfulfilled. Future 17
development of prescribed burning will require higher awareness of the role of fire on 18
ecosystems, changes in fire management policies, and acceptance by stakeholders and 19
the general public (Galiana and Lázaro 2010). 20
This study analysed the potential of prescribed burning to mitigate CO2 emissions in the
21
Mediterranean countries by taking into account its impact on the area burned by 22
wildfire. Results indicate that an increase in the use of prescribed burning would limit 23
wildfires more effectively than in other Mediterranean ecosystems (Boer and others 24
2009, Price and Bradstock 2011). However, our estimates of prescribed burning 25 3 4 5 6 7 8 9 10 11 12 13 14 15 16 17 18 19 20 21 22 23 24 25 26 27 28 29 30 31 32 33 34 35 36 37 38 39 40 41 42 43 44 45 46 47 48 49 50 51 52 53 54 55 56 57 58 59 60
For Review Only
leverage (the total area protected from wildfire per unit area treated) were based on 1
wildfire data. Accurate estimation of the mitigation effect would need long-term data on 2
prescribed burning leverage. In the absence of such data, research should strive to 3
quantify to what extent vegetation and fuel accumulation and connectivity contribute to 4
large fire spread in Europe. 5
Uncertainties related to fire emission estimates remain large and more data on fuel load 6
and fuel consumption in different fuel layers are needed. So far, most of the studies 7
have taken into account only the aboveground tree biomass although understorey 8
vegetation, litter and soil remarkably contribute to emissions. Estimating the forest floor 9
emissions is the most uncertain component when modelling carbon emissions from 10
forest fires, since its consumption can range from near zero to 100% (de Groot and 11
others 2007). This should be a minor source of uncertainty in the Mediterranean, where 12
fire activity largely coincides with the summer drought period when the forest floor is 13
totally available to burn (Camia and Amatulli 2009). Explicitly accounting for 14
emissions from soil and understorey vegetation would improve our estimates of both 15
wildfire emissions and the effect of prescribed burning. However, the current data and 16
understanding already allows concluding that prescribed burning can have a 17
considerable effect on the carbon balance of the LULUCF sector. More accurate 18
assessments would require partitioning area burned by vegetation type and appraising 19
fuel loading and consumption by vegetation type. 20
21
Acknowledgements 22
This study is part of the project ‘FIRE PARADOX - an Innovative Approach to 23
Integrated Wildland Fire Management Regulating the Wildfire Problem by the Wise 24 3 4 5 6 7 8 9 10 11 12 13 14 15 16 17 18 19 20 21 22 23 24 25 26 27 28 29 30 31 32 33 34 35 36 37 38 39 40 41 42 43 44 45 46 47 48 49 50 51 52 53 54 55 56 57 58 59 60
For Review Only
Use of Fire: Solving the Fire Paradox’, funded by the European Commission (contract 1
FP6-018505). The reviewing process brought significant improvements to this paper. 2 3 3 4 5 6 7 8 9 10 11 12 13 14 15 16 17 18 19 20 21 22 23 24 25 26 27 28 29 30 31 32 33 34 35 36 37 38 39 40 41 42 43 44 45 46 47 48 49 50 51 52 53 54 55 56 57 58 59 60
For Review Only
References 1
2
Ager AA, Vaillant NM, Finney, MA (2010) A comparison of landscape fuel treatment 3
strategies to mitigate wildland fire risk in the urban interface and preserve old forest 4
structure. Forest Ecology and Management 259:1556-1570 5
Albuquerque JPM (1961) Divisão regional do Continente Português. Agricultura 9:1-11 6
Andreae MO, Merlet P (2001) Emission of trace gases and aerosols from biomass 7
burning. Global Biogeochemical Cycles 15(4):955-966 8
Andrews PL, Bevins CD, Seli RC (2008) BehavePlus Fire Modeling System, version 9
4.0: User's Guide. USDA Forest Service, Rocky Mountain Research Station, General 10
Technical Report RMRS-GTR-106WWW Revised. Ogden, UT. 11
Arno SF, Brown JK (1989) Managing fire in our forests - time for a new initiative. 12
Journal of Forestry 87(12):44-46. 13
Boer MM, Sadler RJ, Wittkuhn RS, McCaw L, Grierson PF (2009) Long-term impacts 14
of prescribed burning on regional extent and incidence of wildfires--Evidence from 50 15
years of active fire management in SW Australian forests. Forest Ecology and 16
Management 259(1): 132-142. 17
Bradstock RA, Williams RJ (2009) Can Australian fire regimes be managed for carbon 18
benefits? New Phytologist 183:931-934. 19
Camia A, Amatulli G (2009) Weather factors and fire danger in the Mediterranean. In 20
Chuvieco E (Ed.) Earth Observation of Wildland Fires in Mediterranean Ecosystems. 21 Springer-Verlag: Berlin. Pp. 71-82. 22 3 4 5 6 7 8 9 10 11 12 13 14 15 16 17 18 19 20 21 22 23 24 25 26 27 28 29 30 31 32 33 34 35 36 37 38 39 40 41 42 43 44 45 46 47 48 49 50 51 52 53 54 55 56 57 58 59 60
For Review Only
Carvalho A, Monteiro A, Flannigan M, Solman S, Miranda A, Borrego C (2007) Forest 1
fire emissions under climate change: impact on air quality. Seventh Symposium on Fire 2
and Forest Meteorology, Extended abstract.
3
http://ams.confex.com/ams/7firenortheast/techprogram/paper_126854.htm 4
Carvalho A, Flannigan M, Logan K, Gowman L, Miranda A, Borrego C (2010) The
5
impact of spatial resolution on area burned and fire occurrence projections in Portugal
6
under climate change. Climatic Change 98:177–197
7
Carrión JS, Sánches-Gómez P, Mota JF, Yll J, Chaín C (2003) Holocene vegetation
8
dynamics, fire and grazing in the Sierra de Gádor, Southern Spain. The Holocene 13
9
(6): 839-849
10
Collins BM, Miller JM, Thode AE, Kelly M, van Wagtendonk JW, Stephen SL (2009)
11
Interactions among wildland fires in a long-established Sierra Nevada natural fire area. 12
Ecosystems 12: 114-128 13
Defossé GE, Loguercio G, Oddi FJ, Molina, JC, Kraus PD (2011) Potential CO2
14
emissions mitigation through forest prescribed burning: A case study in Patagonia,
15
Argentina. Forest Ecology and Management. doi:10.1016/j.foreco.2010.11.021 16
De Groot WJ, Landry R, Kurz WA, Anderson KR, Englefield P, Frase RH, Hall RJ, 17
Banfield E, Raymond DA, Decker V, Lynham TJ, Pritchard JM (2007) Estimating 18
direct carbon emissions from Canadian wildland fires. International Journal of Wildland 19
Fire 16: 593-606 20
European Commission (2009) Forest Fires in Europe 2008. JRC Scientific and 21 Technical Reports No 9. 22 3 4 5 6 7 8 9 10 11 12 13 14 15 16 17 18 19 20 21 22 23 24 25 26 27 28 29 30 31 32 33 34 35 36 37 38 39 40 41 42 43 44 45 46 47 48 49 50 51 52 53 54 55 56 57 58 59 60
For Review Only
FAO (2005) Global Forest Resources Assessment (FRA) 2005. 1
[http://www.fao.org/forestry/fra/fra2005/en/] 2
FCCC (2006) Report of the individual review of the greenhouse gas inventory of 3
Portugal submitted in 2005. FCCC/ARR/2005/PRT. 4
[http://unfccc.int/resource/docs/2006/arr/prt.pdf] 5
Fernandes PM (2008) Forest fires in Galicia (Spain): the outcome of unbalanced fire 6
management. Journal of Forest Economics 14:155-157. 7
Fernandes PM (2009) Examining fuel treatment longevity through experimental and 8
simulated surface fire behaviour: a maritime pine case study. Canadian Journal of Forest 9
Research 39:2529-2535. 10
Fernandes P, Botelho H (2003) A review of prescribed burning effectiveness in fire 11
hazard reduction. International Journal of Wildland Fire 12:117-128 12
Fernandes P, Botelho H (2004) Analysis of prescribed burning practice in the pine 13
forest of northwestern Portugal. Journal of Environmental Management 70:15-26 14
Fernandes P, Loureiro C, Botelho H (2004) Fire behavior and severity in a maritime 15
pine stand under differing fuel conditions. Annals of Forest Science 61:537-544 16
Fernandes P, Botelho H, Rego F. Loureiro C (2009) Empirical modelling of surface fire 17
behaviour in maritime pine stands. International Journal of Wildland Fire 18:698-710 18
Finney MA, McHugh CW, Grenfell IC (2005) Stand- and landscape-level effects of 19
prescribed burning on two Arizona wildfires. Canadian Journal of Forest Research 20 35:1714–22 21 3 4 5 6 7 8 9 10 11 12 13 14 15 16 17 18 19 20 21 22 23 24 25 26 27 28 29 30 31 32 33 34 35 36 37 38 39 40 41 42 43 44 45 46 47 48 49 50 51 52 53 54 55 56 57 58 59 60
For Review Only
Finney MA, Seli RC, McHugh CW, Ager AA, Bahro B, Agee JK (2007) Simulation of 1
long-term landscape-level fuel treatment effects on large wildfires. International Journal 2
of Wildland Fires 16:712-727 3
Finney MA (2003) Calculation of fire spread rates across random landscapes. 4
International Journal of Wildland Fire 12:167-174 5
Finney MA (2001) Design of regular landscape fuel treatment patterns for modifying 6
fire growth and behavior. Forest Science 47(2):219-228 7
Flannigan MD, Harrington JB (1988) A study of the relation of meteorological variables 8
to monthly provincial area burned by wildfire in Canada 1953-80. Journal of Applied 9
Meteorology 27:441-452 10
Galiana L, Lázaro A (2010) Potential barriers and factors for success. In Montiel C, 11
Kraus D (Eds.) Best Practices of Fire Use – Prescribed Burning and Suppression Fire 12
Programmes in Selected Case-study Regions in Europe. European Forest Institute 13
Research Report 24. Joensuu. Pp. 155-162. 14
IPCC (2006) Guidelines for National Greenhouse Gas Inventories Volume 4 15
Agriculture, Forestry and Other Land Use. 16
IPCC (2007) Contribution of Working Group II to the Fourth Assessment Report of the 17
Intergovernmental Panel on Climate Change. Parry ML, Canziani OF, Palutikof JP van 18
der Linden PJ and Hanson CE (Eds.), Cambridge University Press, Cambridge, United 19
Kingdom and New York, NY, USA. 20
Ito A, Penner JE (2004) Global estimates of biomass burning based on satellite imagery 21
for the year 2000. Journal of Geophysical Research 109, D14S05 22 3 4 5 6 7 8 9 10 11 12 13 14 15 16 17 18 19 20 21 22 23 24 25 26 27 28 29 30 31 32 33 34 35 36 37 38 39 40 41 42 43 44 45 46 47 48 49 50 51 52 53 54 55 56 57 58 59 60
For Review Only
Keeley JE (2002) Fire management of California shrubland landscapes. Environmental 1
Management 29: 395-408 2
Lázaro A (2010) Development of prescribed burning and suppression fire in Europe. In 3
Montiel C, Kraus D (Eds.) Best Practices of Fire Use – Prescribed Burning and 4
Suppression Fire Programmes in Selected Case-study Regions in Europe. European 5
Forest Institute Research Report 24. Joensuu. Pp. 17-31. 6
Lindner M, Maroschek M, Netherer S, Kremer A, Barbati A., Garcia-Gonzalo J, Seidl 7
R, Delzon S, Corona P, Kolström M, Lexer MJ, Marchetti M (2010) Climate change 8
impacts, adaptive capacity, and vulnerability of European forest ecosystems. Forest 9
Ecology and Management 259:698-709 10
Loehle C (2004) Applying landscape principles to fire hazard reduction. Forest Ecology 11
and Management 198:261-267 12
MCPFE (2007) State of Europe´s Forests 2007. The MCPFE Report on Sustainable 13
Forest Management in Europe 2007. 14
Miranda AI, Borrego C, Sousa M, Valente J, Barbosa P, Carvalho A (2005) Model of 15
Forest Fire Emissions to the Atmosphere. Deliverable D252 of SPREAD Project 16
(EVG1-CT-2001-00043). Department of Environment and Planning, University of 17
Aveiro AMB-QA-07/2005, Aveiro, Portugal 18
Miranda AI, Marchi E, Ferretti M, Millán MM (2009) Forest fires and air quality issues 19
in Southern Europe. In Bytnerowicz A, Arbaugh M, Riebau A, Andersen C (Eds.). 20
Wildland Fires and Air Pollution, Developments in Environmental Science 8. 21 Amesterdam, Elsevier. Pp. 209-232. 22 3 4 5 6 7 8 9 10 11 12 13 14 15 16 17 18 19 20 21 22 23 24 25 26 27 28 29 30 31 32 33 34 35 36 37 38 39 40 41 42 43 44 45 46 47 48 49 50 51 52 53 54 55 56 57 58 59 60
For Review Only
Mitchell SR, Harmon ME, O´Connell KEB (2009) Forest fuel reduction alters fire 1
severity and long-term carbon storage in three Pacific Northwest ecosystems. 2
Ecological Applications 19(3):643-655 3
Narayan C, Fernandes P, van Brusselen J, Schuck A (2007) Potential for CO2 emissions
4
mitigation in Europe through prescribed burning in the context of the Kyoto Protocol. 5
Forest Ecology and Management 251:164-173 6
North M, Hurteau M, Innes J (2009) Fire suppression and fuels treatment effects on 7
mixed-conifer carbon stocks and emissions. Ecological Applications 19 (6):1385-1396 8
Nunes MCS, Vasconcelos MJ, Pereira JMC, Dasgupta N, Alldredge RJ, Rego FC 9
(2005) Land cover type and fire in Portugal: do fires burn land cover selectively? 10
Landscape Ecology 20:661-673 11
Pausas J (2004) Changes in fire and climate in the Eastern Iberian Peninsula 12
(Mediterranean Basin). Climatic Change 63:337-350 13
Pausas J, Llovet J, Rodrigo A, Vallejo R (2008) Are wildfires a disaster in the 14
Mediterranean basin? A review. International Journal of Wildland Fire 17:713–723 15
Pinol J, Terradas J, LLoret F (1998) Climate warming, wildfire hazard, and wildfire 16
occurrence in coastal Eastern Spain. Climatic Change 38: 345–357 17
Pinol J, Beven K, Viegas DX (2005) Modelling the effect of fire-exclusion and 18
prescribed fire on wildfire size in Mediterranean ecosystems. Ecological Modelling 19
183:397-409 20
Pinol J, Castellnou M, Beven KJ (2007) Conditioning uncertainty in ecological models: 21
assessing the impact of fire management strategies. Ecological Modelling 207:34-44 22 3 4 5 6 7 8 9 10 11 12 13 14 15 16 17 18 19 20 21 22 23 24 25 26 27 28 29 30 31 32 33 34 35 36 37 38 39 40 41 42 43 44 45 46 47 48 49 50 51 52 53 54 55 56 57 58 59 60
For Review Only
Price O, Bradstock R (2011) Quantifying the influence of fuel-age and weather on the 1
annual extent of unplanned fires in the Sydney region of Australia. International Journal 2
of Wildland Fire 20:142-151 3
Reinhard ED, Keane RE, Brown JK (1997) First Order Fire Effects Model: FOFEM 4.0 4
User´s Guide. USDA Forest Service General Technical Report INT-GTR-344. 5
Seiler W, Crutzen PJ (1980) Estimates of gross and net fluxes of carbon between the 6
biosphere and the atmosphere from biomass burning. Climatic Change 2:207-247 7
Smith JE, Heath LS (2002) A model of forest floor carbon mass for United States forest 8
types. USDA Forest Service Research Paper NE-722. 9
Sorensen CD, Finkral AJ, Kolb TE, Huang CH (2011) Short- and long-term effects of 10
thinning and prescribed fire on carbon stocks in ponderosa pine stands in northern 11
Arizona. Forest Ecology and Management 261:460-472. 12
Stephens SL, Moghaddas JJ (2005) Experimental fuel treatment impacts on forest 13
structure, potential fire behavior, and predicted tree mortality in a California mixed 14
conifer forest. Forest Ecology and Management 215:21-36 15
Stephens SL, Moghaddas JJ, Hartsough BR, Moghaddas E, Clinton NE (2009) Fuel 16
treatment effects on stand-level carbon pools, treatment-related emissions, and fire risk 17
in a Sierra Nevada mixed-conifer forest. Canadian Journal of Forest Research 39:1538-18
1547. 19
UNFCCC National Inventory Submissions 2009.
20 http://unfccc.int/national_reports/annex_i_ghg_inventories/national_inventories_submis 21 sions/items/4771.php 22 3 4 5 6 7 8 9 10 11 12 13 14 15 16 17 18 19 20 21 22 23 24 25 26 27 28 29 30 31 32 33 34 35 36 37 38 39 40 41 42 43 44 45 46 47 48 49 50 51 52 53 54 55 56 57 58 59 60
For Review Only
Van Wagner C (1987) Development and structure of the Canadian Forest Fire Weather 1
Index System. Canadian Forestry Service, Forestry Technical Report 35, Otawa. 2
Vilén T, Meyer J, Thürig E, Lindner M, Green T (2005) Improved regional and national 3
level estimates of the carbon stock and stock change of tree biomass for six European 4
countries (Deliverable 6.1 of the CarboInvent Project). CarboInvent Deliverable 6.2, 5
European Forest Institute, Joensuu, Finland, 31 pp. 6
Wiedinmyer C, Hurteau MD (2010) Prescribed fire as a means of reducing forest carbon 7
emissions in the Western United States. Environmental Science and Technology 8 44:1926-1932 9 10 3 4 5 6 7 8 9 10 11 12 13 14 15 16 17 18 19 20 21 22 23 24 25 26 27 28 29 30 31 32 33 34 35 36 37 38 39 40 41 42 43 44 45 46 47 48 49 50 51 52 53 54 55 56 57 58 59 60
For Review Only
1
Table 1 Forest area, average burned area and mean biomass stocks in different compartments. Values in italics are estimated based on
data from other Mediterranean countries
Country Forest area,
1000 ha 1) Burned area, ha/yr Mean stock, t dm/ha 1) Forest Other wooded land Average 1980-2008 2)
Forest Other wooded land
Aboveground biomass
Deadwood Litter Aboveground
biomass Deadwood Litter France 15 554 1 708 28 460 118.94 17.36 21.72 50.94 6.95 12.52 Greece 3 752 2 780 49 044 26.12 4.01 4.78 1.80 0.25 0.44 Italy 9 979 1 047 118 022 104.52 16.03 18.15 84.05 11.46 20.65 Portugal 3 783 84 109 327 38.59 5.93 7.06 95.24 12.99 23.40 Spain 17 915 10 299 179 043 36.9 5.09 6.07 0.10 0.01 0.02 1)
FAO (2005) 2) European Commission (2009)
3 4 5 6 7 8 9 10 11 12 13 14 15 16 17 18 19 20 21 22 23 24 25 26 27 28 29 30 31 32 33 34 35 36 37 38 39 40 41 42 43 44 45 46 47 48 49 50 51 52 53 54 55 56 57
For Review Only
2
Table 2 Annual average burned biomass, carbon stock losses and CO2 emissions in wildfires
Country Burned biomass, Mg C stock
losses
CO2 emissions
foliage branches deadwood litter total Mg C Mg CO2
France 112 588 29 878 311 466 438 207 892 140 389 103 1 340 682 Greece 16 328 12 133 93 576 115 717 237 754 103 834 358 509 Italy 147 720 199 714 1 459 460 2 061 238 3 868 13 1 666 105 5 816 367 Portugal 368 163 134 152 930 810 1 499 848 2 932 974 1 271 507 4 408 808 Spain 174 859 57 972 412 515 492 126 1 137 472 504 759 1 719 108 3 4 5 6 7 8 9 10 11 12 13 14 15 16 17 18 19 20 21 22 23 24 25 26 27 28 29 30 31 32 33 34 35 36 37 38 39 40 41 42 43 44 45 46 47 48 49 50 51 52 53 54 55 56 57 58
For Review Only
Table 3 Fire incidence models: significance (p-values) of the independent variables effects and regression coefficients (± std. error) for past fire incidence
Variable Fire incidence
models Ecoregion FWI 95
th
perc. 6-year wildfire incidence Low (n=39, R2=0.37) 0.004 0.004 0.048 -0.167 ± 0.078 High (n=52, R2=0.74) 0.001 <0.001 <0.001 -0.306 ± 0.077 3 4 5 6 7 8 9 10 11 12 13 14 15 16 17 18 19 20 21 22 23 24 25 26 27 28 29 30 31 32 33 34 35 36 37 38 39 40 41 42 43 44 45 46 47 48 49 50 51 52 53 54 55 56 57 58 59 60
For Review Only
4
Table 4 Comparison of the effectiveness of prescribed burning in the context of the Kyoto Protocol. Reported 2007 LULUCF sector carbon losses (Mt C), estimated emission
reduction through prescribed burning, emission reduction compared with LULUCF sector losses (%), Article 3.4 largest eligible C sink (Mt C) and emission reduction compared with Article 3.4 largest eligible sink (%). n.a = Spain has reported only net change, not losses separately (UNFCCC National Inventory Submissions 2009). Numbers I-IV refer to the prescribed burning scenarios
Country 2007 LULUCF
sector losses (Mt C)
Emission reduction through prescribed burning (Mt C)
Emission reduction/reported LULUCF C losses (%)
A 3.4 Largest eligible sink
(Mt C)
Emission reduction from Article 3.4 largest sink (%)
I II III IV I II III IV I II III IV
France 20.49 0.0052 0.0208 0.0521 0.2078 0.03 0.10 0.24 1.01 0.88 0.59 2.36 5.92 23.61
Greece 1.31 0.0014 0.0055 0.0138 0.0554 0.11 0.42 1.06 4.24 0.09 1.54 6.15 15.36 61.51
Italy 20.91 0.0215 0.0882 0.2151 0.8815 0.10 0.42 1.03 4.22 0.18 11.95 48.97 119.48 489.73
Portugal 6.12 0.0170 0.0678 0.1695 0.6781 0.28 1.11 2.77 11.09 0.22 7.70 30.82 77.05 308.23
Spain n.a. 0.0070 0.0272 0.0704 0.2723 n.a. n.a. n.a. n.a. 0.67 1.05 4.06 10.51 40.64
3 4 5 6 7 8 9 10 11 12 13 14 15 16 17 18 19 20 21 22 23 24 25 26 27 28 29 30 31 32 33 34 35 36 37 38 39 40 41 42 43 44 45 46 47 48 49 50 51 52 53 54 55 56 57 58
For Review Only
Table 5. Comparison of wildfire emission (Gg CO2) results of different studies. NFDRS and
EMISPREAD refers to the results of the two fire emission models used by Miranda and others (2005).
Country This study NFDRS EMISPREAD Narayan et al.
France 1 341 415 211 995 Greece 359 466 230 319 Italy 5 816 1 236 951 2 009 Portugal 4 409 2 712 2 596 2 025 Spain 1 719 1 555 1 225 1 006 3 4 5 6 7 8 9 10 11 12 13 14 15 16 17 18 19 20 21 22 23 24 25 26 27 28 29 30 31 32 33 34 35 36 37 38 39 40 41 42 43 44 45 46 47 48 49 50 51 52 53 54 55 56 57 58
For Review Only
Fig. 1 CO2 emissions (Gg CO2) in the five investigated countries under different scenario assumptions. Baseline refers to the situation without prescribed burning and Scenario I-IV to the prescribed burning scenarios. Error bars represent the standard error (±58%) of the wildfire emission estimates.
3 4 5 6 7 8 9 10 11 12 13 14 15 16 17 18 19 20 21 22 23 24 25 26 27 28 29 30 31 32 33 34 35 36 37 38 39 40 41 42 43 44 45 46 47 48 49 50 51 52 53 54 55 56 57 58
For Review Only
0 1000 2000 3000 4000 5000 6000 7000 8000 9000 10000 b a se li n e S c e n a ri o I S c e n a ri o II S c e n a ri o II I S c e n a ri o IV b a se li n e S c e n a ri o I S c e n a ri o II S c e n a ri o II I S c e n a ri o IV b a se li n e S c e n a ri o I S c e n a ri o II S c e n a ri o II I S c e n a ri o IV b a se li n e S c e n a ri o I S c e n a ri o II S c e n a ri o II I S c e n a ri o IV b a se li n e S c e n a ri o I S c e n a ri o II S c e n a ri o II I S c e n a ri o IVFrance Greece Italy Portugal Spain
E m is si o n s, G g C O 2 prescribed burning wildfire 3 4 5 6 7 8 9 10 11 12 13 14 15 16 17 18 19 20 21 22 23 24 25 26 27 28 29 30 31 32 33 34 35 36 37 38 39 40 41 42 43 44 45 46 47 48 49 50 51 52 53 54 55 56 57