ACPD
8, 11519–11566, 2008Tempo-spatial variation of anthropogenic NMVOCs emissions
Y. Bo et al.
Title Page
Abstract Introduction
Conclusions References
Tables Figures
◭ ◮
◭ ◮
Back Close
Full Screen / Esc
Printer-friendly Version
Interactive Discussion
Atmos. Chem. Phys. Discuss., 8, 11519–11566, 2008 www.atmos-chem-phys-discuss.net/8/11519/2008/ © Author(s) 2008. This work is distributed under the Creative Commons Attribution 3.0 License.
Atmospheric Chemistry and Physics Discussions
Spatial and temporal variation of
emission inventories for historical
anthropogenic NMVOCs in China
Y. Bo, H. Cai, and S. D. Xie
College of Environmental Sciences and Engineering, State Key Joint Laboratory of Environmental Simulation and Pollution Control, Peking University, Beijing, P. R. China Received: 7 April 2008 – Accepted: 17 May 2008 – Published: 11 June 2008
Correspondence to: S. D. Xie (sdxie@pku.edu.cn)
ACPD
8, 11519–11566, 2008Tempo-spatial variation of anthropogenic NMVOCs emissions
Y. Bo et al.
Title Page
Abstract Introduction
Conclusions References
Tables Figures
◭ ◮
◭ ◮
Back Close
Full Screen / Esc
Printer-friendly Version
Interactive Discussion
Abstract
Multiyear emission inventories of anthropogenic NMVOCs in China for 1980–2005 were compiled based on time-varying statistical data, literature surveyed and model calcu-lated emission factors, and were gridded at a high spatial resolution of 40 km×40 km using the GIS methodology. Chinese NMVOCs emissions had increased by 4.3 times 5
at an annual average rate of 10.7% from 3.92 Tg in 1980 to 16.5 Tg in 2005. Vehi-cles, biomass burning, industrial processes, fossil fuel combustion, solvent utilization, and storage and transport generated 5.49 Tg, 3.91 Tg, 2.76 Tg, 1.98 Tg, 1.87 Tg, and 0.55 Tg of NMVOCs, respectively. Motorcycles, biofuel burning, heavy-duty vehicles, synthetic fibre production, biomass open burning, and industrial and commercial con-10
sumption were primary emission sources. Besides, from 1980 to 2005, vehicle emis-sion increased notably from 6% to 33%, along with a slight increase for fossil fuel com-bustion from 9% to 12% and for industrial processes from 11% to 17%. Meanwhile, biomass burning emission decreased from 41% to 23%, along with the decrease of storage and transport and solvent utilization from 9% to 3% and from 28% to 11%, 15
respectively. Varieties of NMVOCs emissions coincided well with China’s economic growth. Conversions in economic structure and adjustment of fuel consumption struc-ture in China during the period were the reasons for conspicuous variation of source contributions. The developed eastern and coastal regions produced more emissions than the relatively underdeveloped western and inland regions. Particularly, southeast-20
ern, northern, and central China covering 35% of China’s territory, generated 59% of the total emissions, while the populous capital cities covering merely 4.5% of China’s territory, accounted for 25% of the national emissions. Moreover, rural areas also expe-rienced emission growth during the past two and a half decades, the reason of which was transfer of emission-intensive plants from city to county, inefficient fuel utilization, 25
ACPD
8, 11519–11566, 2008Tempo-spatial variation of anthropogenic NMVOCs emissions
Y. Bo et al.
Title Page
Abstract Introduction
Conclusions References
Tables Figures
◭ ◮
◭ ◮
Back Close
Full Screen / Esc
Printer-friendly Version
Interactive Discussion
1 Introduction
Nonmethane volatile organic compounds (NMVOCs) are a large number of different chemical species that have different physico-chemical properties, can contribute to the formation of secondary pollutants with different efficiencies, and affect climate through direct and indirect mechanisms (Constable et al., 1999). Research on the impact of 5
NMVOCs’ toxicology on insect eggs was reported early in 1918 (Moore and Graham, 1918). Furthermore, the strong correlations between NMVOCs emissions and cancers of the brain and nervous system, thyroid and the endocrine system, and skin were revealed in recent years (Boeglin et al., 2006). Therefore, NMVOCs would hazard human health with their toxicity, teratogenicity and mutagenesis.
10
As an important precursor of ozone, NMVOCs are emitted from both biogenic and anthropogenic sources (Altshuller, 1991; Field et al., 1992). The former had an out-standing contribution to the global emission level, while the latter had more direct af-fects to human being on regional and urban levels (Guenther et al., 1995). Thus, research on anthropogenic NMVOCs was essential to evaluate their effect on ozone 15
formation and assess human health risks.
China had enjoyed an economy boom since the reform and opening-up in 1978, with GDP increasing by 40 times from 56.8 billion dollars in 1980 to 2288.6 billion dollars in 2005. However, China encountered more complex enviromental issues than western countries in the process of industrialization (Tang et al., 2005). Currently, more than 20
three-quarters of the urban population are exposed to air quality that does not meet the national ambient air quality standards of China. Furthermore, this pollution is charac-terized by high concentrations of both primary and secondary pollutants (Shao et al., 2006). Serious secondary pollution arose due to the sharp increase in ambient con-centrations of ozone and fine particulate matter. Beijing, as a typical case, had suffered 25
ACPD
8, 11519–11566, 2008Tempo-spatial variation of anthropogenic NMVOCs emissions
Y. Bo et al.
Title Page
Abstract Introduction
Conclusions References
Tables Figures
◭ ◮
◭ ◮
Back Close
Full Screen / Esc
Printer-friendly Version
Interactive Discussion
role and importance of anthropogenic NMVOCs in forming smog was recognized fifty years ago (Haagen-smit et al., 1953), NMVOCs emissions and control in China had not attracted enough attention until 2001, when a few studies on the estimation of China’s specific NMVOCs emission inventories had been conducted (Tonooka et al., 2001; Klimont et al., 2002). However, these emission inventories were estimated by limited 5
sources of Chinese data and revealed little information of spatial and temporal varia-tion of NMVOCs emissions. Taking into account of the importance of understanding annual variations in past air quality (Ohara et al., 2007), information on China’s his-torical emissions of NMVOCs is urgently needed for estimating NMVOCs fluxes to the environment and for interpreting regional contamination patterns. Therefore, anthro-10
pogenic NMVOCs emission inventories covering six major sources of vehicle, fossile fuel combustion, biomass burning, storage and transport, solvent utilization, and in-dustrial processes were developed spanning the period of 1980 to 2005, based on the emission factor databases developed by European countries, USA, Australia, and other developed countries (Lubkert and Detilly, 1989; Piccot et al., 1992; Loibl et al., 1993), 15
and relevant Chinese statistical data for activity levels of each source. Furthermore, the emission inventories were gridded at a high resolution of 40 km×40 km based on the GIS methodology. Particularly, the spatial and temporal variations of the emission inventories were discussed.
2 Methodology
20
2.1 Estimation and allocation of emission
2.1.1 Emission estimation
ACPD
8, 11519–11566, 2008Tempo-spatial variation of anthropogenic NMVOCs emissions
Y. Bo et al.
Title Page
Abstract Introduction
Conclusions References
Tables Figures
◭ ◮
◭ ◮
Back Close
Full Screen / Esc
Printer-friendly Version
Interactive Discussion
and solvent utilization in detail. Vehicle emissions were calculated based on the emis-sion factor, the population of vehicle, and the corresponding mileage traveled for each vehicle category. The estimations of other sources were based on annual rates of emission related activities, detailed emission factors, and removal efficiency for each source. The total NMVOCs emissions were estimated by Eq. (1).
5
Qm=X Pm,n×Mn,j ×E Fn,j
+XAm,i ×E Fi ×(1−Ri) (1)
Where:Qm is the emission (Mg) of NMVOCs in province m, for vehicle emission,Pm,n
is the population of vehicles in category nin province m,Mn,j is the annual mileage (kilometers) for vehicles in categorynunder driving cyclej, andEFn,j is the emission factor (g/km) of vehicles in categorynunder driving cyclej,i for other sources exclud-10
ing the vehicle, Am,i is the activity rate of sourceiin province m, EFi is the emission factor of sourcei, andRi is the removal efficiency of sourcei.
Activity data and the population of vehicles were obtained from Chinese authoritative data covering 31 provinces excluding Taiwan, Hongkong, and Macao, and for the period of 1980–2005 with five-year intervals. Emission factors in 2005 were obtained by re-15
ferring to native research and literatures, and the Compilation of Air Pollutant Emission Factors, usually called the AP-42 Report (EPA, 1995). In particular, the determination of the adopted emission factors from the AP-42 Report was according to comparative energy consumption between China in 2005 and U.S. in 1995. Moreover, it was nec-essary to modify annual emission factors for the years before 2005, due to the lack of 20
substantially historical emission factors. Thus, it was assumed that the emissions of NMVOCs per unit of fuel consumed were stable, and the variance of emission factor for each sector was correlative with the change of the annual energy consumption per production. Thus, emission factors for industrial processes and fossil fuel combustion before 2005 were estimated using Eq. (2).
25
E F′= Ca
ACPD
8, 11519–11566, 2008Tempo-spatial variation of anthropogenic NMVOCs emissions
Y. Bo et al.
Title Page
Abstract Introduction
Conclusions References
Tables Figures
◭ ◮
◭ ◮
Back Close
Full Screen / Esc
Printer-friendly Version
Interactive Discussion
Where: EF′ is the modified emission factor of each subsector in year a, C
a is the annual energy consumption per production of each subsector in yeara,C0 is energy consumption per production of each subsector in 2005,EF0is emission factor of each subsector in 2005.
Regarding the source of solvent utilization, it was assumed that the emission factors 5
were correlative with annual income per capital. Thus, emission factors for this source before 2005 were estimated using Eq. (3).
E F′′ = Ib I′
0 ×E F
′
0 (3)
Where: E F′′ is the modified emission factor of each subsector of solvent utilization in yearb,Ibis the annual income per captia in yearb,I0′is the annual income per captia 10
in 2005,E F0′is the emission factor of each subsector in 2005.
Emission factors of biomass open burning, and storage and transport were assumed to remain constant over the years, and particularly, emission factors for vehicles were calculated by COPERT III programme.
2.1.2 Emission allocation 15
The final step in the development of China’s NMVOCs inventories was to geographi-cally distribute the national emissions. Upon compilation of the national emission in-ventories based on provincial calculations, county emission data was calculated by al-locating provincial inventories with proxy variables of GDP, population, and crop seeded area using Eq. (4):
20
Ei ,m,n = PTn
n=1
Tn ×Ei ,m (4)
ACPD
8, 11519–11566, 2008Tempo-spatial variation of anthropogenic NMVOCs emissions
Y. Bo et al.
Title Page
Abstract Introduction
Conclusions References
Tables Figures
◭ ◮
◭ ◮
Back Close
Full Screen / Esc
Printer-friendly Version
Interactive Discussion
area in county n. The relationship between emission sources and proxy variables is shown in Table 1.
2.2 Compilation of emission factors and activity data for each source
2.2.1 Vehicle
Emission factor of each vehicle category was calculated by using COPERT III pro-5
gramme, a widely used tool for estimation of emission factors at European level for on-road transportation (EEA, 2000). It was suitable for estimating China’s vehicle emis-sions because the dominant vehicle manufacturing technologies in China originated from European technologies and vehicle emission regulations implemented in China had been almost the same as those performed in Europe (Xie et al., 2006). In addition, 10
compared with MOBILE models, COPERT fitted better in different emission regulations and deficient transportation data country, and it was well used to develop high spatial and temporal resolution emission database (Zachariadis and Samaras, 1999). There-fore, COPERT III programme was used to calculate the emission factors of NMVOCs emission in each province of China, where measured emission factors were insufficient 15
for estimating vehicular emissions.
Specific parameters required by COPERT III to calculate the NMVOCs emission factors of various vehicle categories at the provincial level include the ambient tem-perature, the Reid vapor pressure (RVP) of fuel, average driving speeds, mileages of various vehicle categories under conditions of rural, urban, and freeway, and the 20
provincial population of various vehicle categories. Except for the mileages traveled by vehicle categories, data for other required parameters were compiled according to the established methodology (Cai and Xie, 2007).
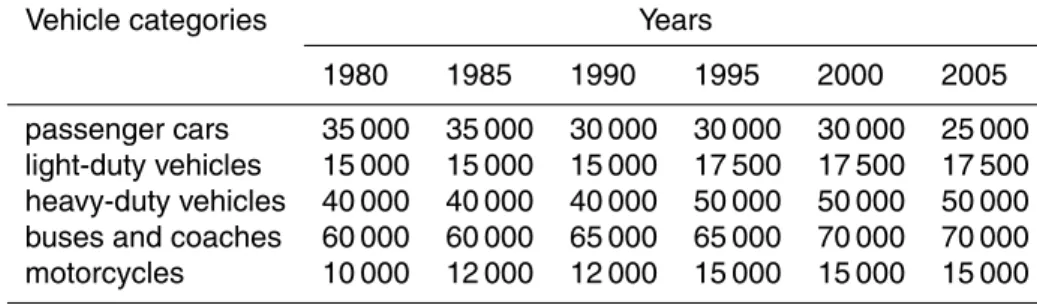
Regarding the mileages, they were estimated based on relevant literatures and sev-eral hypotheses, due to the lack of official statistical data. 25 000, 17 500, 30 000, 25
ACPD
8, 11519–11566, 2008Tempo-spatial variation of anthropogenic NMVOCs emissions
Y. Bo et al.
Title Page
Abstract Introduction
Conclusions References
Tables Figures
◭ ◮
◭ ◮
Back Close
Full Screen / Esc
Printer-friendly Version
Interactive Discussion
data released by the Transportation Sector of Beijing and relevant investigation reports. However, mileages of each vehicle categories varied with the transportation develop-ment in China during the past two and a half decades. Song and Xie (2006) indicated that the mileage in some of China’s major cities had been increasing, leading to a series of changing mileage data for each vehicle category. Meanwhile, the consump-5
tion pattern for passenger cars had changed remarkably: the proportion of taxies and business cars used to travel high mileages decreased, while mileages of private cars increased rapidly. Therefore, the average mileages of total passenger cars came down slowly. On the contrary, mileages of other vehicles have been increasing over the years due to the growing demand for vehicle use stimulated by economic activity expansion. 10
Based on the data in 1995 (Zhang et al., 2004) and 2005, and the situation mentioned above, the mileages traveled by each vehicle category in each of the studied years were finally estimated, as shown in Table 2.
2.2.2 Fossil fuel combustion
Source of fossil fuel combustion contained various stationary combustion facilities, 15
through which people obtained electricity and heat. The emission from this source was determined by fuel types and burning modes. Normally, burning gas and liquid fuel generates less NMVOCs emission than burning solid fuel like coal because solid fuel had lower level of combustion efficiency; and large combustion plants emit less NMVOCs than household boiler with the same energy consumption. Fossil fuel source 20
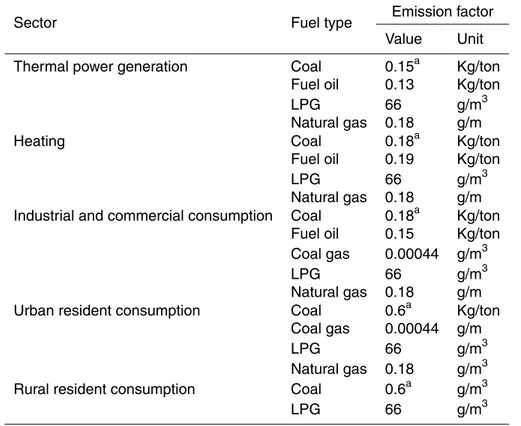
was divided into five subsources: thermal power generation, heating, industrial and commercial consumption, urban resident consumption, and rural resident consump-tion, based on various fuel consumption types. Table 3 presents NMVOCs emission factors for specific fossil fuel categories in 2005. Activity data of this source were collected from energy statistical yearbooks (1986–2006), rural statistical yearbooks of 25
ACPD
8, 11519–11566, 2008Tempo-spatial variation of anthropogenic NMVOCs emissions
Y. Bo et al.
Title Page
Abstract Introduction
Conclusions References
Tables Figures
◭ ◮
◭ ◮
Back Close
Full Screen / Esc
Printer-friendly Version
Interactive Discussion
2.2.3 Biomass burning
Two notable components of biomass burning are the incineration of wood, charcoal and agricultural waste as household fuel, and the combustion of crop residues in open fields (Yevich and Logan, 2003). In this study, biomass burning sources were divided into biofuel of biogas, agricultural waste, and firewood, and open burning of crop residues. 5
The quantity of open burning of crop residues in each province was calculated by Eq. (5).
Qm=Yk,m×Rk×Pm (5)
Qm is the quantity of crop residues for open burning, Yk,m is the yield of crop k in provincem,Rk is the production-to-residue ratio of cropk,Pm is the proportion of open 10
burning in provincem.
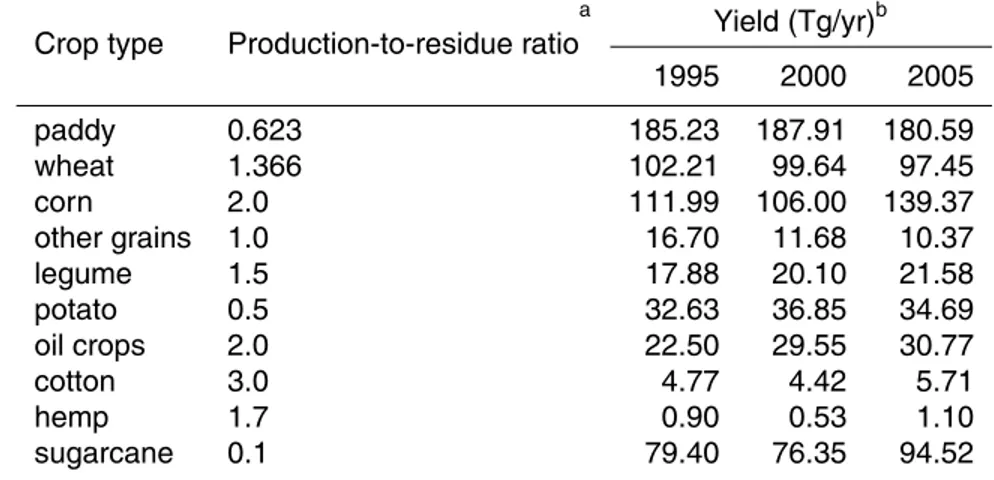
The data of production-to-residue ratio and crop yields were shown in Table 4. In addition, provincial proportion of open burning of crop residues was calculated by com-bining information including regional climate, rural standard of living, energy consump-tion modes, and control policies for open burning in each province. Emission factors 15
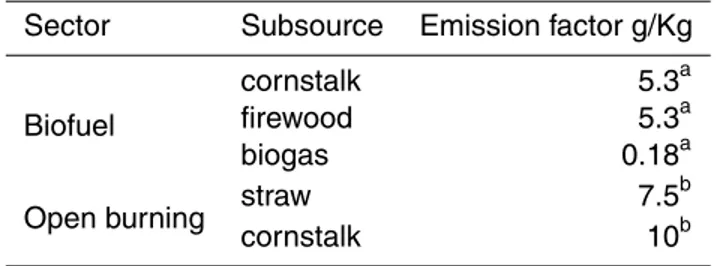
of China’s biofuel burning were referred to AP-42 due to information limitation, and the emission factors adopted are listed in Table 5. Activity data of biofuel, including the consumption of biogas, cornstalk, and firewood as household fuel, originated from China energy statistical yearbooks (1986–2006), rural statistical yearbooks of China (1985–2006), and statistical yearbooks of each province (1981–1984).
20
2.2.4 Storage and transport
Volatilization and leakage of organic solvents during the storage and transport process, including distribution and marketing of petroleum-derived products such as gasoline, crude oil and other volatile organic solvents used in daily life, is a potential source for NMVOCs emission. Therefore, gasoline service station, storage and transport of 25
ACPD
8, 11519–11566, 2008Tempo-spatial variation of anthropogenic NMVOCs emissions
Y. Bo et al.
Title Page
Abstract Introduction
Conclusions References
Tables Figures
◭ ◮
◭ ◮
Back Close
Full Screen / Esc
Printer-friendly Version
Interactive Discussion
NMVOCs emission from gas stations mainly involves with three aspects: liquid load-ing losses, tank breath losses, and vehicle refuelload-ing operations losses. In China, most gas stations adopted the way of immergence oil discharging and underground tank, and had no control in the process of vehicle refueling. Therefore, emission factors were selected through several approaches of storage and refueling from AP-42 as shown in 5
Table 6.
Emission factors for gasoline and crude oil could be obtained by calculating their hy-drocarbon dissipation coefficient. Reasonable hypotheses were assumed for emission factor calculation based on China’s actual situation: (1) raw materials and products were stored up only for one month; (2) only the evaporative emission during the stor-10
age of crude oil and gasoline was considered, and evaporative emissions of light fuel oil were negligible; (3) evaporative emissions from the storage of heavy fuel oil and pressure storage for high volatile oil were negligible; (4) gasoline, crude oil and fuel oil were stored up in floating roof tanks; (5) Densities of crude oil and gasoline from other oil fields were consistent with the oil standard for the same products from Da Qing oil 15
field. Estimated NMVOCs emission factors from storage evaporation for crude oil and gasoline were shown in Table 7.
The transport of petroleum liquids involved many distinct operations, each of which was a potential source of evaporation loss. For example, crude oil was transported from production plants to a refinery by tankers, barges, rail tank cars, tank trucks, or 20
pipelines and refined petroleum products were conveyed by tank trucks to service sta-tions, commercial supply stasta-tions, and local bulk storage plants. Besides, fuel oils and other petroleum products had similar transport paths. Taking into account of the na-tional standard of GB11085-89, the value of 1.6036 g/kg, the mean value of transport, loading and discharging losses, was adopted as the emission factor for oil transport. 25
ACPD
8, 11519–11566, 2008Tempo-spatial variation of anthropogenic NMVOCs emissions
Y. Bo et al.
Title Page
Abstract Introduction
Conclusions References
Tables Figures
◭ ◮
◭ ◮
Back Close
Full Screen / Esc
Printer-friendly Version
Interactive Discussion
China energy statistical yearbooks (1986–2006), while those in 1980 were estimated by allocating the national data in 1980 to the provincial levels based on the provincial proportion in 1985.
2.2.5 Solvent utilization
Solvent utilization, which had occupied approximately 25% of NMVOCs emission per 5
year in U.S. from 1991 to 2006 (EPA, 2007), was one important source of anthro-pogenic NMVOCs emissions. Emission factors of this source provided by AP-42 were adopted, due to the lack of appropriate emission factors in China. Major solvent cate-gories and emission factors were shown in Table 8.
Activity data, mainly including population, production outputs, number of plants and 10
production line, were obtained from China market yearbooks (1999–2006), China light industry yearbook 1949–1983, China light industry yearbooks (1985–2006), China in-dustrial economic statistic yearbooks (1988–2006), China statistical yearbooks (1981– 2006) for the period of 1995 to 2005. Data in 1980 and 1985 were collected from annual provincial yearbooks due to the lack of the information about commodity output 15
during that period.
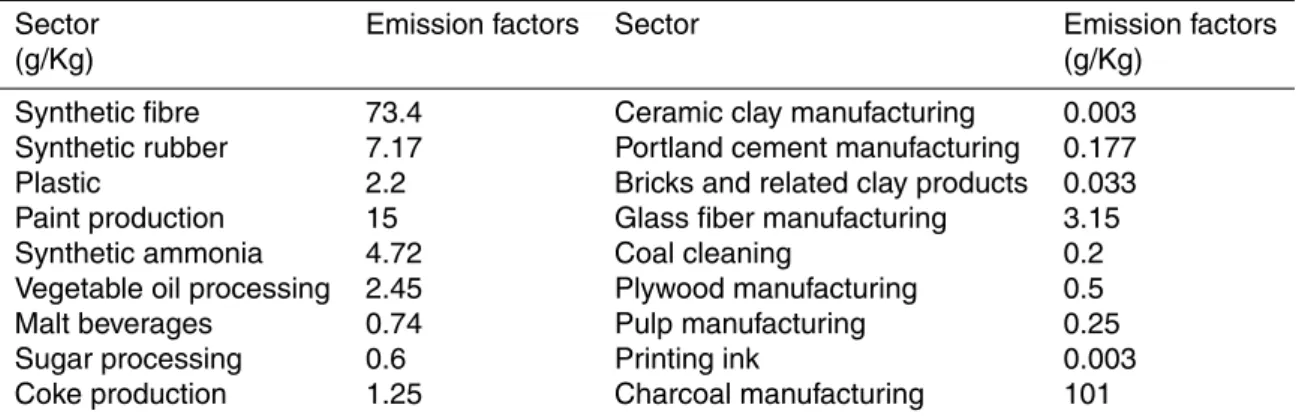
2.2.6 Industrial processes
Production processes of organic chemistry, inorganic chemistry, food, wood production and other industries are potential sources for NMVOCs emissions. Due to little infor-mation of NMVOCs emission factors in China, emission factors for these sources in 20
ACPD
8, 11519–11566, 2008Tempo-spatial variation of anthropogenic NMVOCs emissions
Y. Bo et al.
Title Page
Abstract Introduction
Conclusions References
Tables Figures
◭ ◮
◭ ◮
Back Close
Full Screen / Esc
Printer-friendly Version
Interactive Discussion
3 Results and discussion
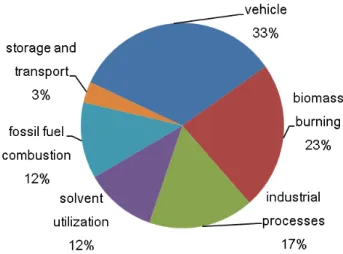
3.1 Emissions in 2005
Total NMVOCs emission in China was 16.5 Tg in 2005, including vehicle 5.5 Tg, biomass burning 3.8 Tg, industrial processes 2.8 Tg, fossil fuel combustion 2.0 Tg, sol-vent utilization 1.9 Tg, and storage and transport 0.5 Tg, respectively. The contribution 5
of each source to the total emission is shown in Fig. 1, which reveals that vehicle and biomass burning were the dominant sources on the national scale.
Detailed contribution of subsectors or subsources within the six main sources was shown in Fig. 2. Regarding vehicle emissions, motorcycles were the major subsource which occupied 55% of emissions in 2005, due to their much larger population and 10
much higher mileage traveled, followed by heavy duty vehicles, whose population and mileage had quickly increased with the fast economic growth recently. In addition, passenger cars occupied 16% of vehicle emissions, followed by buses and light duty vehicles which occupied 4% and 2%, respectively. Why were motorcycles still the most influential subsource over the years, since many cities had restricted the development 15
of motorcycles in urban area since 1990s? The huge rural consumer group accounting for 80% of the national motorcycle drivers was the answer. In rural areas, poor public transport systems, tanglesome road situation, and low price of motorcycles stimulated the blossom for motorcycles and the transfer of motorcycles from urban to rural areas. Therefore, improving public transport systems in rural regions would be one effective 20
way to reduce the vehicular NMVOCs emissions.
With respect of biomass burning, biofuel (cornstalk, firewood as household fuel, and biogas) had occupied 76% of the total emission of this source, and emission from cornstalk burning was twice more than that from firewood. Moreover, open burning contributed the remaining 24% of emission, with the burning of straw and cornstalk 25
ACPD
8, 11519–11566, 2008Tempo-spatial variation of anthropogenic NMVOCs emissions
Y. Bo et al.
Title Page
Abstract Introduction
Conclusions References
Tables Figures
◭ ◮
◭ ◮
Back Close
Full Screen / Esc
Printer-friendly Version
Interactive Discussion
structure which was dominated by burning biomass as the household fuel. Besides, cornstalk burning generated much more emission than firewood burning, primarily due to sharp decrease of consumption caused by the banning of chopping trees. Fur-thermore, open burning in the field still existed privately, which were discovered by national meteorological satellite monitoring of fires during harvest seasons, although 5
open burning was prohibited since the late 1990s. Therefore, it was necessary to exe-cute stringent policies for the control of biomass burning emissions.
The source of fossil fuel combustion including the industrial and commercial con-sumption, was the major contributor to NMVOCs emission, accounting for 43%, due to the growing demand for fossil fuel by the rapid development of industrialisation. 10
Another important contributor was urban consumption of residues. Urban residents, occupying 43% of total Chinese population, were responsible for three times more emissions than rural residents in 2005. Though emission factors for different types of fuel adopted for cities were lower than those for counties, the huge difference in consumption led to the emission discrepancy between urban and rural areas.
15
As for industrial processes, the subsectors as the major contributors to the NMVOCs emissions, were synthetic fibre, coke production, petroleum refining, and synthetic am-monia, accounting for 40%, 11%, 10%, and 8%, respectively.
Regarding solvent utilization emissions, surface coating, especially that for agricul-tural machines and plastic parts of business machines, was the most important sub-20
source responsible for dominant emissions, due to its high emission factor and wide use.
With respect of solvent storage and transport, transport contributed 78% of the total emission, of which the tansport of crude oil and gasoline were the dominant subsec-tors, responsible for 53% and 25%, respectively, much more than those from gasoline 25
service stations and oil storage.
ACPD
8, 11519–11566, 2008Tempo-spatial variation of anthropogenic NMVOCs emissions
Y. Bo et al.
Title Page
Abstract Introduction
Conclusions References
Tables Figures
◭ ◮
◭ ◮
Back Close
Full Screen / Esc
Printer-friendly Version
Interactive Discussion
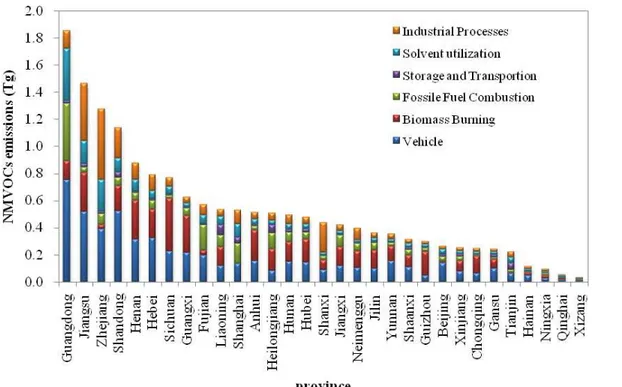
7.7%, 6.6%, 5.5%, 5.4% of the total emissions, respectively.
Provincial emissions were depicted in Fig. 3, with illustration of source contributions. The province producing most NMVOCs emission throughout China was Guangzhou, with a total NMVOCs emission of 1.85 Tg in 2005, which occupied 11.2% of the total emission in China, due to explosive increase of motorcycles, prosperous electric power 5
generation, and booming industrial and commercial market. Simultaneously, provinces of Jiangsu, Zhejiang, and Shandong generated 1.46 Tg, 1.28 Tg, and 1.14 Tg of the emissions, respectively. These four provinces located in eastern coastal areas were all developed regions with high GDP, high population density and modern farming. On the contrary, Xizang, Qinghai, and Ningxia, three provinces located in the vast western 10
inland areas with a sparse population and slowly economic growth, generated only 0.03 Tg, 0.05 Tg, and 0.09 Tg, respectively, in 2005.
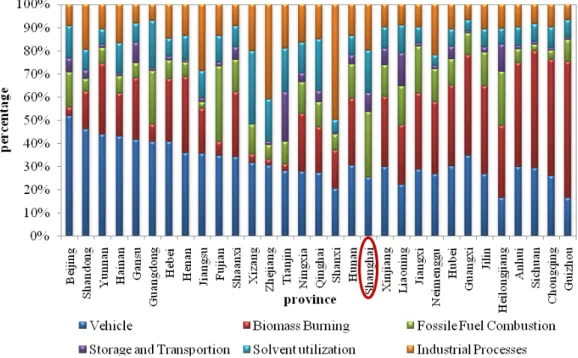
Percentages of NMVOCs emissions from different sources at the provincial level are depicted in Fig. 4, to distinguish the local discrepancy of source contribution to NMVOCs emission and find out the dominant sources responsible for local emissions. 15
It shows that source contributions were quite asymmetric among provinces all over China, and three provincial groups with typical contributions from vehicles, fossil fuel combustion, and biomass burning were distinguished: vehicle was the major source in 19 provinces on the left of Shanghai as illustrated in Fig. 4, and fossil fuel combustion was the dominant source in Shanghai only, with the remaining 12 provinces mainly 20
influenced by biomass burning. Taking Beijing, Shanghai, and Guizhou as illustrations for each group, fossil fuel combustion was the major source occupying 28% NMVOCs emissions in Shanghai, where industrial and commercial consumption, the subsource of fossil fuel combustion, accounted for 63% emissions. NMVOCs emissions in Bei-jing and Guizhou were 0.48 Tg and 0.42 Tg, respectively, but the contributions of each 25
ACPD
8, 11519–11566, 2008Tempo-spatial variation of anthropogenic NMVOCs emissions
Y. Bo et al.
Title Page
Abstract Introduction
Conclusions References
Tables Figures
◭ ◮
◭ ◮
Back Close
Full Screen / Esc
Printer-friendly Version
Interactive Discussion
residues and firewoods were popularly used for domestic cooking by rural households and open fires in the field often happened. Therefore, control of dominant emission sources in each province should be put in primary priority for reducing NMVOCs emis-sions in a cost-effective manner.
3.2 Historical emissions from 1980 to 2005 5
3.2.1 NMVOCs emissions
Historical emissions were estimated for the period of 1980 to 2005. China’s NMVOCs emissions had increased by 4.3 times at an annual average rate of 10.7% from 3.92 Tg in 1980 to 16.5 Tg in 2005, as shown in Table 10. Emissions from vehicle, industrial processes, fossil fuel, biomass burning, storage and transport, and solvent utilization 10
had risen by 25, 6.2, 6.0, 2.4, 2.3, and 1.7 times, respectively. A sharp increase of emissions occurred during the period 1990 to 1995, with the emission doubled from 5 Tg in 1990 to 10 Tg in 1995. Emissions of vehicle and biomass burning had increased by 2.6 and 2.5 times, respectively, the major reasons of which were the rapid growth of vehicle population, which had doubled in 1995 compared with that in 1990, and the 15
popular open burning of crop residues in the field since early 1990s, which accounted for 25% of NMVOCs emissions in 1995.
Figure 5 illustrates the annual emissions for the period of 1980 to 2005, which con-sisted of six major sources. Vehicle emissions had increased by 25 times from 1980 to 2005 at a steady and rapid rate, and had become the dominant contributor to NMVOCs 20
emissions, due to the growth of vehicle population in China which had increased by 60 times, from 1.8 million to 107 million during the period (China Automobile Industry As-sociation, 2006). As the biggest developing country, China had 57% rural population in 2005 (NBS, 2006), and it had a long history of using agricultural waste and firewood for satisfying energy demand. Thus, biomass burning was the largest emission source 25
ACPD
8, 11519–11566, 2008Tempo-spatial variation of anthropogenic NMVOCs emissions
Y. Bo et al.
Title Page
Abstract Introduction
Conclusions References
Tables Figures
◭ ◮
◭ ◮
Back Close
Full Screen / Esc
Printer-friendly Version
Interactive Discussion
different. Firewood and agricultural waste, which were widely used as household fuel in low-income households that lacked consumption capacity for commercial fuel, were the largest NMVOCs emission subsources in 1980. Open burning of crop residues in the field took place in the early 1990s, adding to a high level of biofuel consumption caused by insufficient supply of commercial fuel (Tian et al., 2002), and biomass burn-5
ing emission rose to a peak in 1995. The NMVOCs emission growth from open burning of crop residues was caused by the increase of farmers’ gross annual income, as it was found that when their income towered above 1500 Yuan, crop residues were burnt di-rectly in the open air instead of at home (Lu and Lu, 2006), since crop residues being fuel was replaced by commodity fuel consumed by richer farmers and crop residues 10
in the field were burnt directly to minimize the disposal cost of them. Therefore, the changing of economic situation was the primary reason for contribution changes of major subsources of biomass burning. To reduce biomass open burning emissions, a fundamental approach is to develop crop residues’ value so that people would reuse them rather than simply discard and burn them. Meanwhile, emissions from other four 15
sources were smoothly increasing, mainly due to the continuous population growth, the improved living standards, and the rapid industrial development.
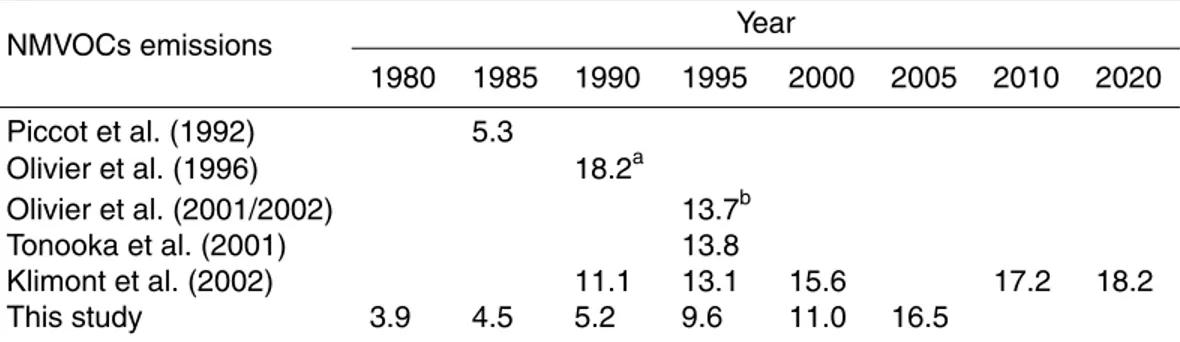
3.2.2 Comparisons of Chinese NMVOCs emissions
NMVOCs emissions in China estimated by Piccot et al. (1992), Olivier et al. (1996, 2001/2002), Tonooka et al. (2001), and Klimont et al. (2002) were compared with 20
our results as depicted in Table 10. Piccot’s result in 1985 was 5.3 Tg, a little more than our estimate of 4.5 Tg in the same year. Other estimations were all quite larger than ours, which was caused by differences in studied region, source categories and emission factors adopted. Emissions of China region which contained China, Hong Kong, Kampuchea, North Korea, Laos, Macau, Mongolia, and Vietnam was estimated 25
ACPD
8, 11519–11566, 2008Tempo-spatial variation of anthropogenic NMVOCs emissions
Y. Bo et al.
Title Page
Abstract Introduction
Conclusions References
Tables Figures
◭ ◮
◭ ◮
Back Close
Full Screen / Esc
Printer-friendly Version
Interactive Discussion
our estimate was 9.6 Tg. In Tonooka’s emission inventory for 1995, coal combustion was the largest source occupying approximately 40% of the total NMVOCs emission based on the emission factors for boilers of diverse sizes, while our results showed that biomass burning was still the dominant emission source in 1995 because biomass was widespread used as household fuel, due to the scarcity of commercial fuel for domes-5
tic use. In addition, similar monotonous rising trend was revealed by comparing our results with multiyear NMVOCs emission inventory carried out by Klimont et al. (2002). However, there was notable discrepancy in amount of NMVOCs emissions, especially for the year 1990, when etimation from Klimont et al. was about 2.1 times more than that in this study. The emission discrepancy was mainly ascribed to the differences 10
in the categorization of anthropogenic NMVOCs source categories, and the emission factors and activity data for the corresponding categories.
Figure 6 illustrated the annual comparisons of NMVOCs emissions in the U.S. and China. Though NMVOCs emission in the U.S. in 1980 was ten times more than that in China and had been decreasing ever since, the rapid growth of emission in China 15
had exceeded the durative decrease of NMVOCs emission in the U.S. up to 2005. In the U.S., the transportation sector was the dominant contributor of VOC emissions, but the lower volatility of motor fuel led to the decrease of vehicle emission from 12.6 Tg in 1980 to 3.68 Tg in 2005, and contributed to the sharp decline of NMVOCs emission since 1989 (Cilek and Kohout, 1992). However, vehicular emission had become the 20
largest emission source occupying 33% of the total NMVOCs emission, and vehicular pollution in China was still serious. Hence, city planners should develop more efficient public transportation, and encourage citizens to select more environmental-friendly trip modes, like riding bicycles instead of driving cars, and using electric bikes, buses, and cars; to reduce burgeoning traffic and air pollution problems; and to save energy (Zeng 25
ACPD
8, 11519–11566, 2008Tempo-spatial variation of anthropogenic NMVOCs emissions
Y. Bo et al.
Title Page
Abstract Introduction
Conclusions References
Tables Figures
◭ ◮
◭ ◮
Back Close
Full Screen / Esc
Printer-friendly Version
Interactive Discussion
3.2.3 Relativity between NMVOCs emission and economy
To find out the pivotal factors resulting in continuous growth of NMVOCs emission, demographic, socio-economic, and geoponic statistical data were widely investigated. Statistical results showed that the correlation coefficient between NMVOCs emissions and GDP was 0.99, as illustrated in Fig. 7, which demonstrated that the increase of 5
NMVOCs emissions was well positively correlated with the development of China’s economy.
The NMVOCs emission and GDP of counties, county-level cities, and cities were pre-sented in Fig. 8 to further investigate the influence of different economic development levels on the correponding NMVOCs emission. Figure 8 reveals that NMVOCs emis-10
sions in counties, county-level cities, and cities went up with the corresponding growth of GDP there. Particularly, NMVOCs emission in counties still increased, although rural areas decreased due to the expansion of urban areas, and the rural economy percentage of the national GDP decreased. Taking the year 2005 for example, coun-ties produced about 51% of the GDP in cicoun-ties, but NMVOCs emission in councoun-ties was 15
6.2 Tg, catching up with the 6.6 Tg generated by cities. Thus, NMVOCs emissions per unit of GDP in counties were higher than those in cities and county-level cities, which was caused by the way of rural economic development in China: many small-scale and pollution-heavy plants were introduced in the underdeveloped rural areas for the pur-pose of developing economy; on the other hand, urban environmental regulations were 20
getting stringent, which forced plants in cities to move out into the rural areas where environmental regulations were relatively loose. Therefore, transfer of high emission plants from cities to counties appeared and became popular, resulting the transfer of emissions from cities to counties. Furthermore, low level of economic development in most rural areas led to the widespread consumption of low-efficient biofuel like biomass 25
ACPD
8, 11519–11566, 2008Tempo-spatial variation of anthropogenic NMVOCs emissions
Y. Bo et al.
Title Page
Abstract Introduction
Conclusions References
Tables Figures
◭ ◮
◭ ◮
Back Close
Full Screen / Esc
Printer-friendly Version
Interactive Discussion
3.3 Spatial distribution of gridded emissions
We sketched the spatial distribution of NMVOCs emissions in 1995, 2000, and 2005, to discern the trend of spatio-temporal variation for NMVOCs emissions in China. Fig-ure 9 presented the emission inventories which were allocated to the county-level and further gridded at a high resolution of 40 km×40 km, using the GIS methodology, to pro-5
vide data for air quality simulation by atmospheric chemical models. The increase of NMVOCs emissions from 1995 to 2005 was revealed, with the annual NMVOCs emis-sions at county level ranging from 462 Gg in urban district of Shanghai to 0.025 Gg in Cuona county of Xizang Autonomous District. Another distinguished emission char-acteristic was that the NMVOCs emissions mainly peaked over the large urban areas, 10
and these high emission regions began to scatter throughout the domain, resulting in the expansion of high emission regions during the period of 1995-2005. Moreover, the NMVOCs emission in eastern China was much higher than that in western China, and the coastal regions had been zoned as most polluted areas of NMVOCs. In ad-dition, extraordinaryly high emissions mainly concentrated in southeastern, northern, 15
and central regions, which covered 35.2% of China’s territory, but generated 59% of the total emissions. While, the western areas of Xizang, Shaanxi, Gansu, Qinghai, Ningxia, and Xinjiang covering 44.6% of the territory, contributed only 5.8% of the total emissions. Besides, the capital cities in China, which cover merely 4.5% of China’s territory, were responsible for 25% of the national emissions of NMVOCs in 2005. The 20
spatial distribution was similar in 1995 and 2000, but high emission regions had been expanding over the years as shown in Fig. 9.
To discern the detailed impact of each source to counties, emission distribution of the six source categories were illustrated in 1995, 2000, and 2005, respectively.
Coincident with rapid development of highway in the decennary 1995-2005, distribu-25
ACPD
8, 11519–11566, 2008Tempo-spatial variation of anthropogenic NMVOCs emissions
Y. Bo et al.
Title Page
Abstract Introduction
Conclusions References
Tables Figures
◭ ◮
◭ ◮
Back Close
Full Screen / Esc
Printer-friendly Version
Interactive Discussion
east, and 26.9% of highway was constructed in the middle, with the remaining 13.4% lying in the west (Li et al., 2000). Guangzhou, Shanghai, Beijing, and Shenzhen, which were dominant emission contributors, experienced the emission evolution from heavy point contamination to serious regional pollution. Besides, NMVOCs emission began to transfer from east to west, with the development of the Western Regions in China. 5
As of the source of biomass burning, emission was concentrated in the northeast and southern China. In the northeast, where crop residues were used for cooking and heating, a great deal of cornstalk and straw could be obtained and burned as free fuel to substitute for part of the commercial fuel to get through the cold winter. Another region for biomass open burning was southern China, especially in the typical agricul-10
tural provinces of Anhui, Jiangsu, and Hubei, where open fire spots in harvest season had been discovered several times in recent years (National Satellite Meteorological Center, 2005).
High NMVOCs emissions from industrial process mainly concentrated in Shandong, Beijing, Yangtze River Delta, and Pearl River Delta in 1995, with plenty of large-scale 15
industrial plants. With ten years’ industrialization, 52% of NMVOCs emissions from in-dustrial sources accumulated in eastern China, where gross inin-dustrial output increased from 63% in 1995 to 69% in 2005.
Figure 10d illustrated a clear correlation of the increase of fossil fuel consumption with regional economic growth. Despite the fact that energy consumption per GDP had 20
been decreasing, NMVOCs emission increased rapidly mainly due to the economic booming. Figure 10d illustrated that the typical areas with considerably economic growth in China was the southeastern coastal regions, along with severe environmental cost for the last two decades.
In addition, emission from solvent utilization mainly aggregated in Pearl River Delta, 25
ACPD
8, 11519–11566, 2008Tempo-spatial variation of anthropogenic NMVOCs emissions
Y. Bo et al.
Title Page
Abstract Introduction
Conclusions References
Tables Figures
◭ ◮
◭ ◮
Back Close
Full Screen / Esc
Printer-friendly Version
Interactive Discussion
Moreover, expansion of NMVOCs emission in northeastern, southeastern, and middle of China occurred in the decade.
High NMVOCs emission from storage and transport source mainly distributed around megalopolis and several huge oil fields of China, such as Daqing, Shengli, Liaohe, Zhongyuan, Kelamayi et al., as depicted in Fig. 10f. With the further exploit of huge 5
oil fields like the Kelamayi oil field, there was no doubt that northwest China is facing greater environmental pressures and pollution caused by NMVOCs emission and so on.
4 Summary and conclusions
Multi-year emissions of NMVOCs were estimated by combination of emission factors 10
and corresponding activity data, based on statistical data at county and provincial level from yearbooks and relevant research and literatures. Emissions of six sources were calculated for the period from 1980 to 2005 for the first time, and the emission inven-tories were further allocated to the county level and illustrated at a high resolution of 40 km×40 km by means of the GIS methodology.
15
Results showed that the major sources of NMVOCs emission in China in 2005 were motorcycles, biofuel burning, heavy-duty vehicles, synthetic fibre production, biomass open burning, and industrial and commerce consumption. Therefore, these sources should be considered in priority in designing control regulations for NMVOCs emission in China.
20
China’s NMVOCs emissions had increased by 4.3 times at a yearly average rate of 10.7% from 3.92 Tg in 1980 to 16.5 Tg in 2005, which had exceeded that in the U.S. There was notable discrepancy among contribution of sources, and it was found that there was a huge increase for vehicle emission from 6% to 33%; a small increase for fossil fuel combustion from 9% to 12%; industrial processes from 11% to 17%; a de-25
ACPD
8, 11519–11566, 2008Tempo-spatial variation of anthropogenic NMVOCs emissions
Y. Bo et al.
Title Page
Abstract Introduction
Conclusions References
Tables Figures
◭ ◮
◭ ◮
Back Close
Full Screen / Esc
Printer-friendly Version
Interactive Discussion
emissions coincided well with the way of China’s economic development, as the reason for conspicuous variation of source contribution was the conversion of economic struc-ture and consumption types of fuel under rapid economic development. In spite of the establishment of stricter fuel and emission regulations for vehicles, a monotonic growth of NMVOCs emission in China had yet to be brought under control. On the other hand, 5
restriction of open burning played a role in bringing down biomass burning emissions in some rural areas. Besides, the NMVOCs emissions went up with the rapid develop-ment of industry and commerce. Statistical analysis revealed that NMVOCs emissions and GDP were well positively correlated, which was a forewarning to the way of China’s economic development accompanied by huge NMVOCs emission. As climate change 10
has become a global focus, China confirmed the policy of saving energy and reducing emissions by prompting technologies in the 11th Five-Year Plan period (2006–2010). Thus, emission reduction of pollutants including NMVOCs must be emphasized and implemented based on the information on the source contributions and typically heavy contaminated regions.
15
Significant characteristics of spatial distribution of gridded emissions based on the GIS methodology were revealed: remarkably high emissions mainly concentrated in southeastern, northern, and central regions, which covered 35.2% of China’s territory, generated 59% of the total emissions. While, the western areas of Xizang, Shaanxi, Gansu, Qinghai, Ningxia, and Xinjiang covering 44.6% of the territory, contributed only 20
5.8% of the total emissions. Besides, the capital cities in China, covering merely 4.5% of China’s territory, were responsible for 25% of the national emissions of NMVOCs in 2005. Meanwhile, higher emission regions had been expanding to regional contamina-tion from point pollucontamina-tion over the years. Efforts to reduce emissions should be focused on the emission-intensive areas of southeastern regions. Furthermore, control and re-25
duction of emission in the rural regions, due to the transfer of emission from cities to countries, must also be emphasized, based on the primary source contributors there.
ACPD
8, 11519–11566, 2008Tempo-spatial variation of anthropogenic NMVOCs emissions
Y. Bo et al.
Title Page
Abstract Introduction
Conclusions References
Tables Figures
◭ ◮
◭ ◮
Back Close
Full Screen / Esc
Printer-friendly Version
Interactive Discussion
Ministry of Education of China (No. 20060001057). We would like to thank Yuh-Shan Ho, J. Zhang, and Z. Liu for their helpful assistance and suggestions, and Jiang Zhihua (National Bureau of Statistics) for providing methods on market survey and forecast.
References
All China Strategic Research Ltd.: China market yearbook (1999–2006 editions), Foreign Lan-5
guage Press, Beijing, 1999–2006.
Altshuller, A. P.: The production of carbon-monoxide by the homogeneous nox-induced pho-tooxidation of volatile organic-compounds in the troposphere, J. Atmos. Chem., 13, 155–182, 1991.
Boeglin, M. L., Wessels, D., and Henshel, D.: An investigation of the relationship between air 10
emissions of volatile organic compounds and the incidence of cancer in Indiana counties, Environ. Res., 100, 242–254, 2006.
Cai, H. and Xie, S. D.: Estimation of vehicular emission inventories in china from 1980 to 2005, Atmos. Environ., 41, 8963–8979, 2007.
China Automobile Industry Association: China automobile industry yearbook, China Machine 15
Press, Beijing, 2006.
Cilek, C. M. and Kohout, E.: Estimating monthly and state-level NOx, SO2, VOC and CO2 emis-sions using the MSCET database, annual Pittsburgh conference on modeling and simulation; Pittsburgh, PA (United States); DOE Project, 30 April –1 May 1992.
Constable, J. V. H., Guenther, A. B., Schimel, D. S., and Monson, R. K.: Modelling changes in 20
voc emission in response to climate change in the continental united states, Glob. Change Biol., 5, 791–806, 1999.
European Environment Agency (EEA): COPERT III—computer programme to calculate emis-sions from road transport.Methodology and emission factors (version 2.1), Technical Report No. 49, 2000.
25
Editorial department of China agriculture yearbook: China agriculture yearbook (1995, 2000, 2005 editions), China Agriculture Press, Beijing, 1995, 2000, 2005.
ACPD
8, 11519–11566, 2008Tempo-spatial variation of anthropogenic NMVOCs emissions
Y. Bo et al.
Title Page
Abstract Introduction
Conclusions References
Tables Figures
◭ ◮
◭ ◮
Back Close
Full Screen / Esc
Printer-friendly Version
Interactive Discussion
Field, R. A., Goldstone, M. E., Lester, J. N., and Perry, R.: The sources and behavior of tropospheric anthropogenic volatile hydrocarbons, Atmos. Environ., 26A, 2983–2996, 1992. Guenther, A., Hewitt, C. N., Erickson, D., Fall, R., Geron, C., Graedel, T., Harley, P., Klinger,
L., Lerdau, M., Mckay, W. A., Pierce, T., Scholes, B., Steinbrecher, R., Tallamraju, R., Taylor, J., and Zimmerman, P.: A global-model of natural volatile organic-compound emissions, J. 5
Geophys.Res, 100, D5, 8873–8892, 1995.
Haagen-smit, A. J., Bradley, C. E., and Fox, M. M.: Ozone formation in photochemical oxidation of organic substances, Ind. Eng. Chem., 45, 2086–2089, 1953.
Klimont, Z., Streets, D. G., Gupta, S., Cofala, J., Fu, L. X., and Ichikawa, Y.: Anthropogenic emissions of non-methane volatile organic compounds in china, Atmos. Environ., 36, 1309– 10
1322, 2002.
Li, M. X., Han, Z. H., and Wu, J.: Analysis and proposal on development trends of airport construction in China, Review of Economic Research, 43, 13–27, 2000.
Li, X. H., Wang, S. X., Duan, L., Hao, J., Li, C., Chen, Y. S., and Yang, L.: Particulate and trace gas emissions from open burning of wheat straw and corn stover in china, Environ. 15
Sci. Technol., 41, 6052–6058, 2007.
Loibl, W., Orthofer, R., and Winiwarter, W.: Spatially disaggregated emission inventory for anthropogenic nmvoc in Austria, Atmos. Environ., 27A, 2575–2590, 1993.
Lu, H. and Lu, L.: An empirical analysis of the impact of farmers’ income level on the household energy consumption structure in the countryside, Finance and Trade Research, 3, 28–34, 20
2006.
Lubkert, B. and Detilly, S.: The OECD map emission inventory for SO2, NOx and VOC in western-Europe, Atmos. Environ., 23, 3–15, 1989.
Moore, W. and Graham, S. A.: Toxicity of volatile organic compounds to insect eggs, Journal of Agricultural Research, 12, 579–587, 1918.
25
National Bureau of Statistics (NBS): China energy statistical yearbook (1986, 1987, 1991– 1996, 1997–1999, 2000–2002, 2006 editions), China Statistics Press, Beijing, 1986–2006. National Bureau of Statistics: China statistical yearbook (1981–2006 editions), China Statistics
Press, Beijing, 1981–2006.
National Bureau of Statistics team of rural socio-economic investigation: Rural statistical year-30
book of China (1985–2006 editions), China Statistics Press, Beijing, 1985–2006.
ACPD
8, 11519–11566, 2008Tempo-spatial variation of anthropogenic NMVOCs emissions
Y. Bo et al.
Title Page
Abstract Introduction
Conclusions References
Tables Figures
◭ ◮
◭ ◮
Back Close
Full Screen / Esc
Printer-friendly Version
Interactive Discussion http://www.epa.gov/ttn/chief/trends/trends06/nationaltier1upto2006basedon2002finalv2.1.
xls, last access: 29 May 2008, 2007.
National Satellite Meteorological Center: Report on meteorological satellite fire monitoring, 4, 2005.
Ohara, T., Akimoto, H., Kurokawa, J., Horii, N., Yamaji, K., Yan, X., and Hayasaka, T.: An Asian 5
emission inventory of anthropogenic emission sources for the period 1980–2020, Atmos. Chem. Phys., 7, 4419–4444, 2007
Olivier, J. G. J., Bouwman, A. F., Maas, C. W. M. van der, Berdowski, J. J. M., Veldt, C., Bloos, J. P. J., Visschedijk, A. J. H., Zandveld, P. Y. J., and Haverlag, J. L.: Description of EDGAR Version 2.0: A set of global emission inventories of greenhouse gases and ozone-depleting 10
substances for all anthropogenic and most natural sources on a per country basis and on 1 degree x 1 degree grid, RIVM report 771060 002, 1996.
Olivier, J. G. J., Berdowski, J. J. M., Peters, J. A. H. W., Bakker, J., Visschedijk, A., J. H., and Bloos, J. P. J.: Applications of EDGAR Including a description of EDGAR 3.2: reference database with trend data for 1970–1995, RIVM report 773301001/NRP report 410 200 051, 15
2001/2002.
Piccot, S. D., Watson, J. J., and Jones, J. W.: A global inventory of volatile organic-compound emissions from anthropogenic sources, J. Geophys. Res., 97, D9, 9897–9912, 1992. Ren, C. F.: China industrial economic statistic yearbook (1988–2006 editions), China Statistics
Press, Beijing, 1988–2006. 20
Shao, M., Tang, X. Y., Zhang, Y. H., and Li, W. J.: City clusters in china: Air and surface water pollution, Front. Ecol. Environ., 4, 353–361, 2006.
Song, X. Y. and Xie, S. D.: Development of vehicular emission inventory in china, Environ. Sci., 27, 1041–1045, 2006.
Streets, D. G., Fu, J. H. S., Jang, C. J., Hao, J. M., He, K. B., Tang, X. Y., Zhang, Y. H., Wang, 25
Z. F., Li, Z. P., Zhang, Q., Wang, L. T., Wang, B. Y., and Yu, C.: Air quality during the 2008 beijing olympic games, Atmos. Environ., 41, 480–492, 2007.
Tang, X. Y., Wang, R. S., and Song, Y. Q.: Current situation and some suggestion on ecological problems of typical cities in China, Land and Resources, 5, 4–9, 2005.
Tian, H. Z., Hao, J. M., Lu, Y. Q., and Zhou, Z. P.: Evaluation of SO2and NOxemissions resulted 30
from biomass fuels utilization in China, Acta Scicentiae Circumstantiae, 22, 204–208, 2002. Tonooka, Y., Kannari, A., Higashino, H., and Murano, K.: NMVOCs and CO emission inventory
ACPD
8, 11519–11566, 2008Tempo-spatial variation of anthropogenic NMVOCs emissions
Y. Bo et al.
Title Page
Abstract Introduction
Conclusions References
Tables Figures
◭ ◮
◭ ◮
Back Close
Full Screen / Esc
Printer-friendly Version
Interactive Discussion
Xie, S. D., Song, X. Y., and Shen, X. H.: Calculating vehicular emission factors with COPERT III model in China, Environ. Sci., 27, 415–419, 2006.
Yang, B.: China light industry yearbook 1949–1983, Encyclopedia of China Publishing House, Beijing, 241–448, 1985.
Yang, Z. P.: China light industry yearbook (1985–2006 editions), China Light Industry Yearbook 5
Press, 1985–2006.
Yevich, R. and Logan, J. A.: An assessment of biofuel use and burning of agricultural waste in the developing world, Global Biogeochem. Cy., 17, 4, 1095, doi: 10.1029/2002GB001952, 2003.
Zachariadis, T. and Samaras, Z.: An integrated modeling system for the estimation of motor 10
vehicle emissions, J. Air Waste Manage., 49, 1010–1026, 1999.
Zeng, N., Ding, Y. H., Pan, J. H., Wang, H. J., and Gregg, J.: Sustainable development-climate change-the Chinese challenge, Science, 319, 730–731, 2008.
Zhang, Y. H., Shao, K. S., and Tang, X. Y.: The study of urban photochemical smog pollution in China, Acta Scicentiarum Naturalum Universitis Pekinesis., 34, 392–400, 1998.
ACPD
8, 11519–11566, 2008Tempo-spatial variation of anthropogenic NMVOCs emissions
Y. Bo et al.
Title Page
Abstract Introduction
Conclusions References
Tables Figures
◭ ◮
◭ ◮
Back Close
Full Screen / Esc
Printer-friendly Version
Interactive Discussion
Table 1.Proxiy variables used for allocating provincial emissions to the counties level.
Proxy variable Emission source category GDPa vehicle, industrial processes,
storage and transport fossil fuel combustion Populationb solvent utilization Crops seeded areaa biomass burning
a
data from China county (city) social economic statistical yearbooks (2001, 2006) and each provincial statistical yearbooks in 1996.
b
ACPD
8, 11519–11566, 2008Tempo-spatial variation of anthropogenic NMVOCs emissions
Y. Bo et al.
Title Page
Abstract Introduction
Conclusions References
Tables Figures
◭ ◮
◭ ◮
Back Close
Full Screen / Esc
Printer-friendly Version
Interactive Discussion
Table 2.Estimated mileages (km) for each vehicle category during the studied years.
Vehicle categories Years
ACPD
8, 11519–11566, 2008Tempo-spatial variation of anthropogenic NMVOCs emissions
Y. Bo et al.
Title Page
Abstract Introduction
Conclusions References
Tables Figures
◭ ◮
◭ ◮
Back Close
Full Screen / Esc
Printer-friendly Version
Interactive Discussion
Table 3. NMVOCs emission factors for specific categories of stationary fossil fuel combustion in 2005.
Sector Fuel type Emission factor
Value Unit Thermal power generation Coal 0.15a Kg/ton
Fuel oil 0.13 Kg/ton
LPG 66 g/m3
Natural gas 0.18 g/m
Heating Coal 0.18a Kg/ton
Fuel oil 0.19 Kg/ton
LPG 66 g/m3
Natural gas 0.18 g/m Industrial and commercial consumption Coal 0.18a Kg/ton
Fuel oil 0.15 Kg/ton Coal gas 0.00044 g/m3
LPG 66 g/m3
Natural gas 0.18 g/m Urban resident consumption Coal 0.6a Kg/ton
Coal gas 0.00044 g/m
LPG 66 g/m3
Natural gas 0.18 g/m3 Rural resident consumption Coal 0.6a g/m3
LPG 66 g/m3
a
ACPD
8, 11519–11566, 2008Tempo-spatial variation of anthropogenic NMVOCs emissions
Y. Bo et al.
Title Page
Abstract Introduction
Conclusions References
Tables Figures
◭ ◮
◭ ◮
Back Close
Full Screen / Esc
Printer-friendly Version
Interactive Discussion
Table 4.National agriculture data for biomass open burning estimation.
Crop type Production-to-residue ratio
a
Yield (Tg/yr)b 1995 2000 2005
paddy 0.623 185.23 187.91 180.59
wheat 1.366 102.21 99.64 97.45
corn 2.0 111.99 106.00 139.37
other grains 1.0 16.70 11.68 10.37
legume 1.5 17.88 20.10 21.58
potato 0.5 32.63 36.85 34.69
oil crops 2.0 22.50 29.55 30.77
cotton 3.0 4.77 4.42 5.71
hemp 1.7 0.90 0.53 1.10
sugarcane 0.1 79.40 76.35 94.52
a
data from China Association of Rural Energy Industry, 2000.
b
ACPD
8, 11519–11566, 2008Tempo-spatial variation of anthropogenic NMVOCs emissions
Y. Bo et al.
Title Page
Abstract Introduction
Conclusions References
Tables Figures
◭ ◮
◭ ◮
Back Close
Full Screen / Esc
Printer-friendly Version
Interactive Discussion
Table 5.NMVOCs emission factors for biomass burning source categories.
Sector Subsource Emission factor g/Kg
Biofuel
cornstalk 5.3a
firewood 5.3a
biogas 0.18a
Open burning straw 7.5
b
cornstalk 10b
a
values based on AP-42 (1999).
b
ACPD
8, 11519–11566, 2008Tempo-spatial variation of anthropogenic NMVOCs emissions
Y. Bo et al.
Title Page
Abstract Introduction
Conclusions References
Tables Figures
◭ ◮
◭ ◮
Back Close
Full Screen / Esc
Printer-friendly Version
Interactive Discussion
Table 6.NMVOCs emissions from gasoline service station operations.
Emission Source
Emission Rate
mg/L lb/103gal Throughput Throughput
Filling underground tank submerged filling 880 7.3 Underground tank breathing and emptying 120 1
ACPD
8, 11519–11566, 2008Tempo-spatial variation of anthropogenic NMVOCs emissions
Y. Bo et al.
Title Page
Abstract Introduction
Conclusions References
Tables Figures
◭ ◮
◭ ◮
Back Close
Full Screen / Esc
Printer-friendly Version
Interactive Discussion
Table 7.NMVOCs emission factors from storage of crude oil and gasoline.
ACPD
8, 11519–11566, 2008Tempo-spatial variation of anthropogenic NMVOCs emissions
Y. Bo et al.
Title Page
Abstract Introduction
Conclusions References
Tables Figures
◭ ◮
◭ ◮
Back Close
Full Screen / Esc
Printer-friendly Version
Interactive Discussion
Table 8.NMVOCs emission factors from solvent utilization in various sectors.
Sector Emission factor Units
Can coating 100 Mg/yr/wire
Magnet wire coating 84 Mg/yr/wire
Agriculture machines surface coating 236 Mg/yr/plant Surface coating of plastic parts for business machines 236 Mg/yr/plant Metal furniture surface coating 218 Mg/yr/plant
Mucilage glue fiber 50 Mg/yr/plant
Typewriter 60 Mg/yr/plant
Other official res 25 Mg/yr/plant
Wood furniture 0.4 Kg/piece
Machine tool equipment 0.4 Kg/piece
Textile fabric printing 81.4 Kg/Mg fabric
Automobile and light duty truck surface coating 21.2 Kg/vehicle Large appliance surface coating 0.2 Kg/production
Bicycle surface coating 0.3 Kg/bike
Architecture surface coating 0.051 Kg/yr/capita
Automobile recoating 0.021 Kg/yr/capita
Painting 0.01 Kg/yr/capita
Dry cleaning 0.02 Kg/yr/capita
Solvent degreasing 0.044 Kg/yr/capita
ACPD
8, 11519–11566, 2008Tempo-spatial variation of anthropogenic NMVOCs emissions
Y. Bo et al.
Title Page
Abstract Introduction
Conclusions References
Tables Figures
◭ ◮
◭ ◮
Back Close
Full Screen / Esc
Printer-friendly Version
Interactive Discussion
Table 9.NMVOCs emission factors of industrial processes.
Sector Emission factors Sector Emission factors
(g/Kg) (g/Kg)
Synthetic fibre 73.4 Ceramic clay manufacturing 0.003 Synthetic rubber 7.17 Portland cement manufacturing 0.177 Plastic 2.2 Bricks and related clay products 0.033 Paint production 15 Glass fiber manufacturing 3.15
Synthetic ammonia 4.72 Coal cleaning 0.2
Vegetable oil processing 2.45 Plywood manufacturing 0.5
Malt beverages 0.74 Pulp manufacturing 0.25
Sugar processing 0.6 Printing ink 0.003
ACPD
8, 11519–11566, 2008Tempo-spatial variation of anthropogenic NMVOCs emissions
Y. Bo et al.
Title Page
Abstract Introduction
Conclusions References
Tables Figures
◭ ◮
◭ ◮
Back Close
Full Screen / Esc
Printer-friendly Version
Interactive Discussion
Table 10.Emissions of NMVOCs by sector in China (Units: Gg).
Sector Year
1980 1985 1990 1995 2000 2005
vehicle 217 435 807 2114 3081 5490
fossil fuel combustion 340 362 614 841 1497 1979 biomass burning 1589 1483 1502 3815 3354 3837 storage and transport 237 278 299 319 389 546 solvent utilization 1093 1369 1307 1458 1362 1871 industrial processes 445 551 695 1049 1327 2761
ACPD
8, 11519–11566, 2008Tempo-spatial variation of anthropogenic NMVOCs emissions
Y. Bo et al.
Title Page
Abstract Introduction
Conclusions References
Tables Figures
◭ ◮
◭ ◮
Back Close
Full Screen / Esc
Printer-friendly Version
Interactive Discussion
Table 11.Comparison of Chinese NMVOCs emissions (Units: Tg yr−1
).
NMVOCs emissions Year
1980 1985 1990 1995 2000 2005 2010 2020 Piccot et al. (1992) 5.3
Olivier et al. (1996) 18.2a
Olivier et al. (2001/2002) 13.7b
Tonooka et al. (2001) 13.8
Klimont et al. (2002) 11.1 13.1 15.6 17.2 18.2
This study 3.9 4.5 5.2 9.6 11.0 16.5
a
emission contained the regions of China, Hong Kong, Kampuchea, North Korea, Laos, Macau, Mongolia, and Vietnam in total.
b
ACPD
8, 11519–11566, 2008Tempo-spatial variation of anthropogenic NMVOCs emissions
Y. Bo et al.
Title Page
Abstract Introduction
Conclusions References
Tables Figures
◭ ◮
◭ ◮
Back Close
Full Screen / Esc
Printer-friendly Version
Interactive Discussion
ACPD
8, 11519–11566, 2008Tempo-spatial variation of anthropogenic NMVOCs emissions
Y. Bo et al.
Title Page
Abstract Introduction
Conclusions References
Tables Figures
◭ ◮
◭ ◮
Back Close
Full Screen / Esc
Printer-friendly Version
Interactive Discussion Source of solvent utilization
Source of industrial processes Source of fossil fuel combustion Source of vehicle Source of biomass burning
Source of storage and transport
ACPD
8, 11519–11566, 2008Tempo-spatial variation of anthropogenic NMVOCs emissions
Y. Bo et al.
Title Page
Abstract Introduction
Conclusions References
Tables Figures
◭ ◮
◭ ◮
Back Close
Full Screen / Esc
Printer-friendly Version
Interactive Discussion
ACPD
8, 11519–11566, 2008Tempo-spatial variation of anthropogenic NMVOCs emissions
Y. Bo et al.
Title Page
Abstract Introduction
Conclusions References
Tables Figures
◭ ◮
◭ ◮
Back Close
Full Screen / Esc
Printer-friendly Version
Interactive Discussion
ACPD
8, 11519–11566, 2008Tempo-spatial variation of anthropogenic NMVOCs emissions
Y. Bo et al.
Title Page
Abstract Introduction
Conclusions References
Tables Figures
◭ ◮
◭ ◮
Back Close
Full Screen / Esc
Printer-friendly Version
Interactive Discussion
0 4 8 12 16 20
1980 1985 1990 1995 2000 2005
N
M
V
O
C
s
e
m
is
si
o
n
s
(T
g
)
years vehicle
fossil fuel
biomass burning
storage and transportation
solvent utilization
industrial processes