Universidade de Aveiro Departamento de Qu´ımica 2015
S´
ergio Manuel
Rodrigues dos Santos
Caracteriza¸
c˜
ao do processo de recupera¸
c˜
ao de
metanol na Prio Biocombust´ıveis S.A.
Characterization of the methanol recovery process
at Prio Biocombust´ıveis S.A.
Universidade de Aveiro Departamento de Qu´ımica 2015
S´
ergio Manuel
Rodrigues dos Santos
Caracteriza¸
c˜
ao do processo de recupera¸
c˜
ao de
metanol na Prio Biocombust´ıveis S.A.
Characterization of the methanol recovery process
at Prio Biocombust´ıveis S.A.
Disserta¸c˜ao apresentada `a Universidade de Aveiro para cumprimento dos requisitos necess´arios `a obten¸c˜ao do grau de Mestre em Engenhar´ıa Qu´ımica, realizada sob a orienta¸c˜ao cient´ıfica do Doutor Francisco Avelino da Silva Freitas, Professor do Departamento de Q´ımica da Universidade de Aveiro, e Engenheira Anabela Ferreira Antunes, Diretora de Produ¸c˜ao - Dire¸c˜ao de Gest˜ao de Projetos e Sustentabilidade - Prio Biocombust´ıveis S.A.
J´uri / Jury
Presidente / President Maria Inˆes Purcell de Portugal Branco
Professora Auxiliar do Departamento de Qu´ımica da Universidade de Aveiro
Vogais / Examiners committee Marco Paulo Seabra dos Reis
Professor Auxiliar do Departamento de Engenharia Qu´ımica da Faculdade de
Ciˆecias e Tecnologia da Universidade de Co´ımbra
Anabela Ferreira Antunes
Diretora de Produ¸c˜ao - Dire¸c˜ao de Gest˜ao de Projetos e Sustentabilidade - Prio Biocombust´ıveis S.A.
Agradecimentos / Acknowledgements
Quero agradecer aos meus pais pela oportunidade de ter acesso a uma educação superior e às minhas irmãs pelo constante incentivo dado ao longo da minha jornada educacional. Agradeço também à minha namorada Rita pelo apoio incondicional dado durante todo o meu percurso universitário e por ter tornado esta jornada mais fácil e agradável.
Ao Prof. Doutor Francisco Avelino e Engª Anabela Antunes pela orientação e conhecimentos transmitidos.
À Prio Biocombustíveis pela oportunidade dada para a realização deste trabalho e a todos seus colaboradores pelo suporte e simpatia e em particular à Engª Lídia Pascoal que me guiou durante a fase experimental deste trabalho. Não poderia deixar de agradecer a todos os meus amigos, em particular ao Ivo, pela ajuda e companheirismo, e ao Cristofe, Joana, Marta, Ana Arede, Ana Patrícia, Tânia, Ana Filipa, Micaela, Sofia e muitos outros, por terem marcado a minha jornada com momentos memoráveis e de camaradagem incondicional.
Palavras-chave Metanol, Simulação de Processo, Análise aos Componentes Principais, Desenho de Experiências, Regressão linear Múltipla, Fouling.
Resumo Em ambiente industrial, conhecer o processo em que se está a trabalhar é crucial para assegurar o seu bom funcionamento. No presente trabalho, desenvolvido nas instalações da Prio Biocombustíveis, utilizando dados do processo, recolhidos no decorrer do trabalho, e dados do histórico de produção caracterizou-se o processo de recuperação de metanol, tendo-se começando pela caracterização das correntes chave do mesmo. Com base na informação obtida na caracterização de correntes, o software de simulação de processos químicos Aspen Plus® foi utilizado para replicar o processo e realizar uma análise de sensibilidade com o fim de discernir a importância relativa de variáveis chave do processo (rácio refluxo/alimentação, temperatura de refluxo, temperatura á saída do reboiler, composições na alimentação de metanol, glicerol e água). O trabalho continuou com a aplicação de um conjunto de ferramentas estatísticas, começando pela Análise aos Componentes Principais onde se estudaram as interações entre variáveis e a sua contribuição para a variabilidade do processo. De seguida, o método de Desenho de Experiencias foi utilizado para obter dados experimentais para com eles criar um modelo capaz de simular a quantidade de água no destilado. No entanto, para este método, as condições necessárias à sua realização não se verificaram, levando ao seu abandono. Passou-se então para o método de Regressão Linear Múltipla, utilizando dados observacionais, do qual surgiram vários modelos empíricos, o melhor apresentando um R2 igual a 92.93% a
AARD igual a 19.44%. Apesar de o AARD ainda ser relativamente alto, considera-se que o modelo é adequado para realizar estimativas rápidas da condição do destilado na coluna. A influência do fouling no processo foi também muitas vezes notada ao longo deste trabalho. Não sendo possível a medição direta do fouling no processo, a pressão do vapor à entrada do reboiler foi usada como indicador do estado do fouling, tendo sido utilizada para estudar o desenvolvimento do fouling e a influência da quantidade de UCO, incorporado no processo, na sua formação. Quando se compara o custo do vapor associado à operação do reboiler, quando a coluna opera com fouling (3 bar de pressão de vapor), ou sem fouling (1.5 bar de pressão de vapor), verifica-se um aumento de cerca de 58% nos custos para o caso em que o fouling é maior.
keywords Methanol, Process simulation, Principal Components Analysis, Design of experiments, Multiple linear Regression, Fouling.
Abstract In a industrial environment, to know the process one is working with is crucial to ensure its good functioning. In the present work, developed at Prio Biocombustíveis S.A. facilities, using process data, collected during the present work, and historical process data, the methanol recovery process was characterized, having started with the characterization of key process streams. Based on the information retrieved from the stream characterization, Aspen Plus® process simulation software was used to replicate the process and perform a sensitivity analysis with the objective of accessing the relative importance of certain key process variables (reflux/feed ratio, reflux temperature, reboiler outlet temperature, methanol, glycerol and water feed compositions). The work proceeded with the application of a set of statistical tools, starting with the Principal Components Analysis (PCA) from which the interactions between process variables and their contribution to the process variability was studied. Next, the Design of Experiments (DoE) was used to acquire experimental data and, with it, create a model for the water amount in the distillate. However, the necessary conditions to perform this method were not met and so it was abandoned. The Multiple Linear Regression method (MLR) was then used with the available data, creating several empiric models for the water at distillate, the one with the highest fit having a R2 equal to
92.93% and AARD equal to 19.44%. Despite the AARD still being relatively high, the model is still adequate to make fast estimates of the distillate’s quality. As for fouling, its presence has been noticed many times during this work. Not being possible to directly measure the fouling, the reboiler inlet steam pressure was used as an indicator of the fouling growth and its growth variation with the amount of Used Cooking Oil incorporated in the whole process. Comparing the steam cost associated to the reboiler’s operation when fouling is low (1.5 bar of steam pressure) and when fouling is high (reboiler’s steam pressure of 3 bar), an increase of about 58% occurs when the fouling increases.
Contents
Contents i
Nomenclature iii
List of Figures v
List of Tables vii
1 Introduction 1
2 Biorefineries: a sustainable industry 3
2.1 The concept of Biorefinery . . . 3
2.2 Biodiesel - example of a reliable biorrefinery . . . 5
2.2.1 Biodiesel production methods . . . 6
2.2.2 Raw materials . . . 7
3 Prio Biocombust´ıveis S.A. 9 3.1 Biodiesel production process . . . 9
3.1.1 Oil neutralization/degguming . . . 10
3.1.2 Oil Transesterification . . . 11
3.1.3 Methyl Esters washing . . . 11
3.1.4 Methanol Recovery . . . 12
3.1.5 Glycerol purification . . . 15
3.2 An improvement driven industry . . . 15
4 Process data: stream analysis and characterization 17 4.1 Stream composition . . . 18
5 Modelling of the methanol recovery column with Aspen Plusr 21 5.1 Thermodynamic model parameters . . . 22
5.2 Simulation results . . . 24
6 Methanol recovery process models 35
6.1 PCA . . . 35
6.2 Distillate purity . . . 39
6.2.1 Design of Experiments . . . 40
6.2.2 Multiple Linear Regression . . . 41
6.3 Fouling and steam consumption . . . 45
6.3.1 Operating costs associated with fouling . . . 47
7 Conclusions and future work 49
Bibliography 51
A Glycerol and FAME vapour pressure A1
Nomenclature
AcronymsAARD Absolute average relative deviations CIP Clean-in-place
DoE Design of Experiments FAME Fatty acid methyl ester MLR Multiple Linear Regression MPC Model Predictive Control PC Principal Components
PCA Principal Components Analysis UCO Used Cooking Oil
UNIFAC UNIversal QUAsiChemical Functional-group Activity Coefficients model UNIQUAC UNIversal QUAsiChemical model
Greek Symbols
β Regression coefficient ε Random error component ΞiVariable i w
Re Heat transfer resistance k/W
Subscripts A stream A B stream B
C stream C D stream D gly glycerol met methanol oth “others” steam Process steam tot total
wtr water Symbols
vk Regressing variable
∆L Material’s thickness m
∆T Temperature difference between cold and hot side K
Q Mass flow kg · h−1
R2 Coefficient of determination
x Mass fraction %
A Heat transfer area m2
k Material’s thermal conductivity W/m2· K
List of Figures
2.1 Petro and Bio-refinery comparison. . . 4
2.2 General process diagram for a biodiesel production plant. . . 6
3.1 Schematic representation of the neutralisation/deguming process at Prio Bio-combust´ıveis S.A. . . 10
3.2 Schematic representation of the oil transesterification process at Prio Biocom-bust´ıveis S.A. . . 11
3.3 Schematic representation of the methyl esters washing process at Prio Biocom-bust´ıveis S.A. . . 12
3.4 Schematic representation of the methanol recovery process at Prio Biocom-bust´ıveis S.A. . . 13
3.5 a) Distillation collumn’s reboiler head; b)Reboiler’s pipes closeup. . . 14
3.6 Schematic representation of the glycerol purification process at Prio Biocom-bust´ıveis S.A. . . 15
4.1 Composition of stream A in % (wt) . . . 19
4.2 Composition of stream D in % (wt) . . . 19
4.3 Composition of stream C in % (wt) . . . 20
4.4 Reboiler’s steam pressure variation with time. . . 20
5.1 Aspen Plusr Flowsheet diagram used to simulate the distillation column with the RadFrac model. . . 22
5.2 Second liquid phase composition along the column, computed with Aspen Plusr, using the software’s estimated UNIQUAC binary interaction param-eters. . . 23
5.3 First liquid phase composition along the column, computed with Aspen Plusr, using the software’s UNIQUAC binary interaction parameters. . . 24 5.4 Second liquid phase composition along the column, computed with Aspen
5.5 Vapour phase composition along the column, computed with Aspen Plusr using UNIQUAC parameters estimated by the user. . . 25 5.6 Distillation column’s temperature profiles. . . 28 5.7 Variation of the methanol mass fraction at the distillate with the variation of
the reflux/feed ration. . . 28 5.8 Variation of the methanol mass fraction at the distillate with the variation of
the reboiler outlet temperature. . . 30 5.9 Variation of the methanol mass fraction at the distillate with the variation of
the reflux temperature. . . 31 5.10 Variation of the methanol mass fraction at the distillate with the variation of
water amount in the feed stream. . . 31 5.11 Variation of the methanol mass fraction at the distillate with the variation of
the methanol amount in the feed stream. . . 32 5.12 Variation of the methanol mass fraction at the distillate with the variation of
the glycerol amount in the feed stream. . . 32 6.1 Loadings plot of the variables in the methanol distillation process PCA for the
first three PCs. . . 38 6.2 PV/FF variation with the reboiler operating time. . . 46 6.3 Maximum reboiler operating time variation with the UCO percentage used in
the production process. . . 47 B.1 Distillation column with the different temperature and pressure indicators
List of Tables
2.1 Targets for percentage biodiesel incorporation in transportation fuels in the
EU and USA [10, 7] . . . 5
2.2 Comparative table between the different transesterification methods [19, 20] . 7 2.3 Fatty acids composition of several vegetable and animals oils and used cooking oil. . . 8
4.1 Analytical methods used. . . 18
5.1 UNIQUAC binary interaction parameters used in the simulation. . . 26
5.2 Aspen Plusr simulation results corresponding to the 8th of April. . . 27
5.3 Comparison between the Aspen Plusr given compositions and the composi-tions observed in the field (% wt/wt) for streams C and D. . . 29
5.4 Equations, and respective derivatives, from the fitted data for each variable in study. . . 33
6.1 Eigenvalue and commutative variability for the methanol distillation process PCA. . . 36
6.2 Principal Components coefficients for the variables of the methanol recovery process. . . 37
6.3 Water on distillate results for the 22 factorial design of experiment for T102407 temperatures of 79◦C and 82◦C and for reflux/feed ratios of 33 and 37. T7,obs and R/F Fobs represent the true values of T102407 and reflux/feed registered during the experiment. . . 40
6.4 Water on distillate results for the 32 factorial design of experiment for T102407 temperatures of 78◦C, 80◦C and 82◦C and for reflux/feed ratios of 0.32, 0.34 and 0.36. T7,obs and R/F Fobs represent the true values of T102407 and re-flux/feed registered during the experiment. . . 41
6.5 MLR results for the water on distillate model, using reflux/feed ratio and thermocouple’s temperature T102407. . . 43
6.6 MLR results for the water on distillate model, using reflux/feed ratio and thermocouple’s temperature T102405. . . 44 6.7 Steam flow and pressure values used to regress equation 6.7. . . 47 A.1 Antoine equation parameters . . . A2 B.1 Mass fraction composition (%) of glycerol, water, methanol and “others” in
Stream A (from tank 10F08) . . . A4 B.2 Mass fraction composition (%) of glycerol, water, methanol and “others” in
Stream D (from the bottom of the distillation column) . . . A5 B.3 Mass fraction composition (%) of water and methanol in Stream C (from tank
10F06) . . . A7 B.4 Methanol distillation column’s operating data. . . A8 B.5 Column’s thermocouples T102404, T102405, T102406, T102407, T102408 and
T102509 temperatures. . . A10 B.6 Column’s thermocouple T102403, feed and reflux temperatures and reboiler’s
steam (P102405) and internal pressures (P102401). . . A11 B.7 Boiler steam production and respective daily energy consumption. . . A13
Chapter 1
Introduction
Biodiesel is currently in increasing demand worldwide as a result of the growing com-mitment to find alternative green fuels. Transesterification production processes, as one of the methods to produce methyl esters, have also been the subject of continuous studies and improvements, with industrial plants striving more and more to achieve higher process efficiencies.
The present document is a Master’s thesis, carried out in the scope of the Integrated Master’s Degree in Chemical Engineering from University of Aveiro, and its objectives were the study of the methanol recovery process from Prio Biocombust´ıveis S.A. methyl ester transesterification plant, located in Terminal de Gran´eis L´ıquidos at Porto de Aveiro.
The main objectives for this work can be summarized as follows:
• Characterization of the methanol recovery process currents and development of a com-puterized model to simulate it;
• Sensitivity analysis of key variables in the methanol recovery process and the study of the process variables importance and relations;
• Development of an empiric model to predict the water content in the methanol distillate; • Study the effect of fouling in the reboiler and create a model to predict the fouling
evolution during production.
With the present work, new information regarding the methanol distillation process as well as a new set of tools were developed for Prio Biocombust´ıveis, allowing the company’s workers to better understand and control the production process.
This work is divided in seven chapters:
• Chapter 2 briefly discusses the Biorefineries concept and the biodiesel production in-dustry, presenting the different production methods and its raw materials;
• Chapter 3 contains a more detailed description of the several production stages of Prio Biocombust´ıveis S.A. production process;
• Chapter 4 presents the analytical methods used to characterize the process currents and respective results;
• Chapter 5 deals with the computerized model to simulate the methanol distillation process, paying special attention to the importance of thermodynamic models in the simulation. It also contains a sensitivity analysis made to key process variables; • Chapter 6 holds the PCA analysis made to study the importance and relations of the
process variables as well as the models created for the water content in distillate and reboiler’s fouling;
• Chapter 7 summarizes the present work’s conclusions and indications regarding future works.
Chapter 2
Biorefineries: a sustainable industry
The perception that the planet’s resources are limited and can be depleted, if explored at a higher rhythm than they regenerate, is already widespread through the industrialized world. This lead to the search for solutions, from which the following two stand [1]:• Dematerialisation (use less resources, create less waste)
• Transmaterialisation (replace the current raw materials for others more sustainable) Although dematerialisation is easier to implement by both industry and consumers, it’s re-sults aren’t always the expected since it requires constant improvement of the production processes, that developing countries don’t make the same mistakes developed countries did and also because this idea focus on reducing the consumption and doesn’t take into account the waste that is still created and many times disposed of and not yet recycled [1]. As for transmaterialisation, it poses a more sustainable approach as it focus not in reducing the consumption but in an adaptation of its limits to the limits at which the resources can re-generate and in reusing and recycling the materials as much as possible to create a circular economy [2].
The energy industry, in which the fuel industry is inserted, is no exception to what was said before, especially because of it’s dependency towards fossil fuels (oil in particular) which are becoming more scarce and will eventually be unable to provide the for the growing demand of liquid fuels [3]. This creates the perfect environment for the development and growth of alternative fuels, in particular those derived from biomass, a renewable (not unlimited) source that can be obtained from various sources such as agriculture (crops and residues), forestry, industry and households (waste and leftovers) and aquaculture (algae and seaweeds) [4].
2.1
The concept of Biorefinery
A biorefinery can be seen as a sustainable relative of an oil refinery, as showed in figure 2.1, the main difference between the two being the raw material it used: biomass - one of the
2.1. THE CONCEPT OF BIOREFINERY
most precious and versatile resources on Earth [5]. A biorefinery is defined as an industrial plant in which biomass is converted into a large variety of chemicals, biomaterials and energy, maximizing biomass’s value while creating the minimal amount of waste [1].
Even though nowadays biorefineries’s main focus is energy, it is expectable that in the future, due to developments in the area, they will increasingly produce a wider range of products, such as chemicals (ex: furfural, fatty and acetic acids, etc) and materials (ex: paints, dyes, biopolymers, etc), in considerable amounts [6].
Bio -r efine ry P e tr o -re finer y Products: • Energy (fuel, etc) • Chemicals (speciality
& commodity) • Materials (plastic, etc) • Waste • Etc Biomass: • Trees, crops • Grass, clover Fossil resources: • Crude oil • Natural gas
Figure 2.1: Petro and Bio-refinery comparison.
As is described in the literature [7],three different types of biorrefineries can be identified, based on its inputs and outputs:
• Type I - uses only one type of feedstock to yield a major product. It’s the least flexible of the three.
• Type II - uses only one type of feedstock to yield several products.
• Type III - can use various types of feedstock to yield several products. It’s the most flexible of the three.
Due to type III high flexibility and adaptability to use different raw materials and produce different products, in accordance with current market demands, this type of biorrefinery is in clear advantage regarding the other two. It is also of note that a biorrefinery can be classified according to the origin of the raw materials and processing technology it uses: the whole-crop biorrefinery (uses cereals or maize), the green biorrefinery (uses wet biomass) and the lignocellulose feedstock (LCF) biorrefinery (uses naturally dry cellulose-containing biomass and wastes) being the most researched and developed [7].
CHAPTER 2. BIOREFINERIES: A SUSTAINABLE INDUSTRY
2.2
Biodiesel - example of a reliable biorrefinery
Biodiesel is a complex mixture of mono-alkyl esters obtained by transesterification of fatty acids from triglycerides with a short chain alcohol such as methanol or ethanol or by esterification of fatty acids [8]. It is an alternative diesel fuel that has renewable biolog-ical resources, such as vegetable oils and animal fats, as its precursor, being an excellent replacement to conventional fuels for diesel engines [5].
This type of fuel has the advantage of being biodegradable and non-toxic, having lower emission profile than fossil fuels [5, 9] and of containing very small quantities of sulphur, polycyclic aromatic hydrocarbons, and metals [8]. Apart from the environmental advantages, others come from the use of biodiesel such as its use in regular diesel engines without requiring any major engine modification, it is safe for storage and transportation due to its low amount of polycyclic aromatic hydrocarbons, it contains oxygen which makes it a better lubricant than regular diesel fuels (increasing the life spam of engines), it’s combustion is more complete and has a higher flash point which makes it safer to handle [5, 8]. For these reasons, an increase in biodiesel incorporation in regular fuels has been registered both in Europe and United States of America, as can be seen in table 2.1. In Portugal, the current percentage of biodiesel incorporation in regular fuels reached, early in 2015, the 7% mark.
Table 2.1: Targets for percentage biodiesel incorporation in transportation fuels in the EU and USA [10, 7]
year 2001 2004 2005 2010 2015 2020 2030
USA - 0.50% - 4% - 10% 20%
EU 1.40% - 2.50% 5.75% 7% 10%
-Despite all of its advantages and it’s promise as a fossil fuel replacement, biodiesel is still far from being able to completely replace fossil fuels in a near future as there are several challenges that need to be overcome first. One is it’s price, as biodiesel cost is higher than that of petroleum diesel due to its raw material’s price [5]. Another problem that needs to be overcome is the crying fact that this industry’s demand for raw materials, being vegetable oils such as palm, rapeseed, soy and corn oil, increases the pressure for its production which, in turn, leads to an increase in deforestation and serious food shortages [8, 11].
The use of other feedstocks, such as waste cooking oils, is already implemented [12, 13, 14]. Even though using this type of oil to produce biodiesel can, in part, help solving the problems of food shortage and deforestation, new production problems arise like the higher content of free fatty-acids and water that increase the soap production in the presence of an alkali-catalyst [8]. Algae is another promising source of biomass for biodiesel as they can grown practically anywhere where there is enough sunshine (salt water environments included). Algae have a short growing cycle of only a few days and yield an amount of oil that is several
2.2. BIODIESEL - EXAMPLE OF A RELIABLE BIORREFINERY
times larger than that of the best performing crops [5, 8, 15], thus translating into a smaller impact on both environment and food markets.
According to the feedstock used in it’s production, biodiesel can be classified as [16]: • First generation biodiesel - biodiesel produced from edible oils (example: palm, soy and
corn oil)
• Second generation biodiesel - biodiesel produced from non-edible oils (example: jat-ropha, mahua and jojoba oil)
• Third generation biodiesel - biodiesel produced from microalgae oils
2.2.1 Biodiesel production methods
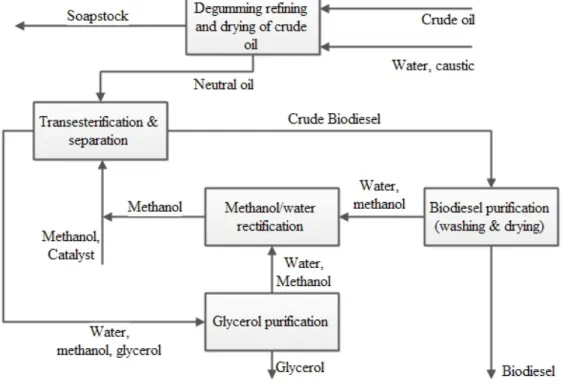
The process of biodiesel production is not as new as one might think since s early as 1853 scientists E. Duffy and J. Patrick performed transesterification experiments and even before World War II transesterified vegetable oils were used to power heavy-duty vehicles in South Africa. [17]. However, it was only in the late 90s that production and commercialisation of biodiesel really took off [5]. The major stages in biodiesel production are crude oil degumming, refining and drying, followed by transesterification and alkyl esters (biodiesel) separation, alkyl esters washing and drying, alcohol recovery and glycerol purification [18]. In figure 2.2 a schematic of the major stages in a biodiesel production plant are shown.
Figure 2.2: General process diagram for a biodiesel production plant.
CHAPTER 2. BIOREFINERIES: A SUSTAINABLE INDUSTRY
primary or secondary short chain monohydric aliphatic alcohol (1-8 carbons), in the presence of a suitable catalyst, to yield 3 monoalkyl esters and glycerol (the main by-product) as is shown in equation 2.1. CH2 CH2 OOC R1 CH2 OOC R3 OOC R2 Triglyceride + 3ROH Alcohol Catalyst R 2 COO R R1 COO R R3 COO R Alkyl Esters + CH2 CH2 OH CH2 OH OH Glycerol (2.1)
Regarding the catalysts used in the process of transesterification, they can either be alkali (such as sodium or potassium hydroxide or sodium methoxide), acid (such as sulfuric, hydrochloric and sulfonic acids) or enzyme. Apart from the catalysed processes, another route for this reaction is the non-catalysed supercritical alcohol transesterification [5, 19]. A comparison between the different transesterification methods is presented in table 2.2.
Table 2.2: Comparative table between the different transesterification methods [19, 20] Alkali-catalyst Acid-catalyst
Lipase-Catalyst Supercritical alcohol Reaction temperature (◦C) 60-70 55-80 30-40 239-385 Reaction pressure (MPa) 0.1 0.1 0.1 10-25 Reaction time (min) 60-360 60-360 60-360 7-15
Free fatty acids in raw materials
Saponified products
Esters Esters Esters
Water in raw materials Interference with reaction Interference with reaction No influence -Yield of methyl esters
Normal Normal Higher Good
Recovery of glycerol
Difficult Difficult Easy
-Purification of methyl esters Repeated washing Repeated washing None -Production cost of catalyst
Cheap Cheap Relatively
expensive
Medium
2.2.2 Raw materials
The raw material for the biodiesel industry are oils which, has seen before, can be of very different sources and regions of the globe, thus differing in their composition, as shown in
2.2. BIODIESEL - EXAMPLE OF A RELIABLE BIORREFINERY
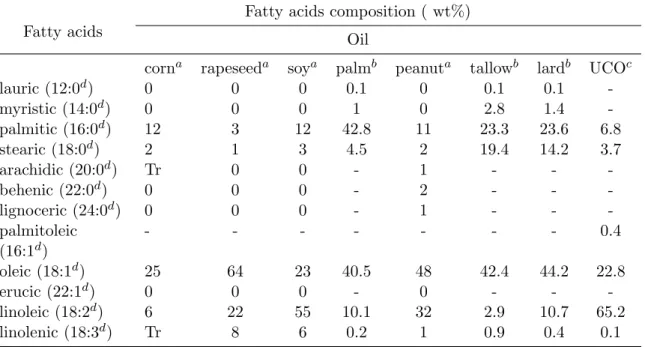
table 2.3. Regarding vegetable oils, they are extracted from seeds and are mainly comprised of glycerides (try, di and monoglicerides) and, in lesser quantities, by other compounds like tocopherols, sterols, sterol esters, phosphatides, free fatty acids, odours, colouring matter, waxes and metal compounds [5, 21]. Used cooking oil (UCO) is also used in the biodiesel industry as cheaper raw material. Triglycerides are the major constituents of vegetable oils [22] as well as the main precursor for mono-alkyl esters. They are esters of three fatty acids and one glycerol, having in its structure a substantial amount of oxygen and its fatty acids varying in their carbon chain length and number of double bonds.
CH2 CH2 OOC R1 CH2 OOC R3 OOC R2 Triglyceride CH2OH CH2OH CH2OH Glycerol + C H O O R2 C H O O R1 C H O O R3 Fatty acids
Table 2.3: Fatty acids composition of several vegetable and animals oils and used cooking oil.
Fatty acids
Fatty acids composition ( wt%) Oil
corna rapeseeda soya palmb peanuta tallowb lardb UCOc
lauric (12:0d) 0 0 0 0.1 0 0.1 0.1 -myristic (14:0d) 0 0 0 1 0 2.8 1.4 -palmitic (16:0d) 12 3 12 42.8 11 23.3 23.6 6.8 stearic (18:0d) 2 1 3 4.5 2 19.4 14.2 3.7 arachidic (20:0d) Tr 0 0 - 1 - - -behenic (22:0d) 0 0 0 - 2 - - -lignoceric (24:0d) 0 0 0 - 1 - - -palmitoleic (16:1d) - - - 0.4 oleic (18:1d) 25 64 23 40.5 48 42.4 44.2 22.8 erucic (22:1d) 0 0 0 - 0 - - -linoleic (18:2d) 6 22 55 10.1 32 2.9 10.7 65.2 linolenic (18:3d) Tr 8 6 0.2 1 0.9 0.4 0.1
Tr stands for traces.
a data acquired from A. Srivastava et al, 2000[22] bdata acquired from F. Ma et al, 1999[9].
c data acquired from A. Demirbas, 2009[23].
Chapter 3
Prio Biocombust´ıveis S.A.
Prio Biocombust´ıveisveis S.A. is a biodiesel production company created in 2006 and is sited in Terminal de Gran´eis L´ıquidos at Porto de Aveiro, having a production capacity of 113880 ton/year. Apart from biodiesel, glycerol, a secondary product of the Transesterifica-tion process, is also commercialised.
The biodiesel produced here is in conformity with the European Standards described in EN14214, the company being also certified in Quality (ISO 9001), Safety (OHSAS 18001) and Environment (ISO 14001).
3.1
Biodiesel production process
The production of biodiesel at Prio Biocombust´ıveisveis S.A, which will explain here, is the alkaline transesterification of vegetable and used cooking oils, according to the Lurgi process [24].
The crude oil quality (which can be soy, palm, rapeseed or used cooking oil) is one of the parameters that influence the most the production process, being required that the oils are tested, at arrival, for water and free fatty acids (FFA) content even before they start being processed to ensure that water and FFAs levels are within acceptable limits. This step is of the most importance to ensure that both yield and quality of the biodiesel produced are high, with special attention to UCO since it can have high levels of both water and FFAs [12, 25] and also to allow the determination of sodium hydroxide quantity to be added in the neutralization/deguming stage.
Apart from used cooking oil, which is used all year long, the vegetable oils used for the production of biodiesel vary from soy oil, rapeseed oil and palm oil. The choice of vegetable oil to be used, or mixtures of them, is largely defined by market prices, specific oil properties and by clients specification. While soy and rapeseed oils are used during the winter, palm oil, due to its higher viscosity and crystallization at low temperatures [26, 27], is only used during summer time.
3.1. BIODIESEL PRODUCTION PROCESS
3.1.1 Oil neutralization/degguming
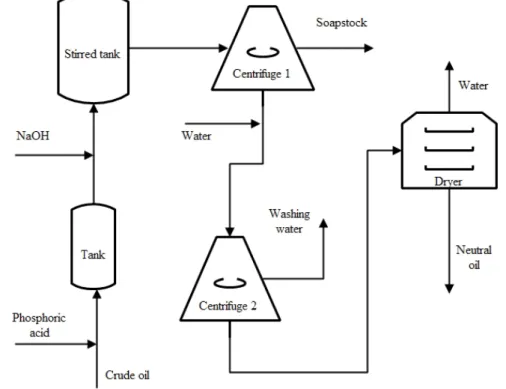
Prior testing, the crude oil mixture is fed to the neutralization/degumming process where it’s transformed into neutral oil, so called due its low FFAs and other impurities content. In this step, the crude oil is initially heated following the removal of metals and non-hydratable phosphatides (NHP), such as phosphatidc acid, by adding phosphoric acid[21]. A sodium hydroxide solution is added next to react with the FFAs to form soaps (saponification) and other impurities that weren’t removed with the addition of the phosphoric acid [18]. After both phosphoric acid and sodium hydroxide addition, the mixture is centrifuged to separate the soaps and small quantities of metals and other precipitates (soapstock). Finally, water is added to wash any remnants of soap and soluble impurities from the oil, being then removed in the second centrifuge. The resulting oil is dried and proceeds for the transesterification process as neutral oil. A schematic representation of the neutralisation/deguming process if given at figure 3.1.
Figure 3.1: Schematic representation of the neutralisation/deguming process at Prio Biocom-bust´ıveis S.A.
The oil neutralization/degumming is crucial in the transesterification reaction since high levels of FFAs will result in catalyst destruction and soap formation, leading to lower alkyl esters yield, inhibiting the alkyl esters and glycerol separation and contributing to the for-mation of an emulsion during biodiesel washing [12]. The water used in the oil washing step is slightly acid to allow for a more complete removal of soaps [28].
CHAPTER 3. PRIO BIOCOMBUST´IVEIS S.A.
3.1.2 Oil Transesterification
Oil transesterification to alkyl esters at Prio Biocombust´ıveis S.A. is made by alkaline catalysis using sodium methoxide as catalyst and methanol as the alcohol. The neutral oil is fed to the first reactor, along with the catalyst and methanol, yielding methyl esters of the corresponding fatty acids present in the oil’s triglycerides. Methanol is used in a higher quantity that the stoichiometric quantity required for the complete reaction to force the equilibrium of equation 2.1 towards the products [9, 12, 18].
Even with the excess methanol, the reaction in the first reactor is not complete and a second reactor is used to carry the reaction even further, for a near complete oil conversion. The reaction mixture from the first reactor follows to a decanter where the glycerol phase is separated from the rest of the mixture, the later being fed to the second reactor. The products from the second reactor are also fed to a decanter where, like in the first, the glycerol phase formed is separated. Both reactors are separated in 3 internal individual stirred compartments for a more efficient stirring. The glycerol removed from the first decanter follows for further purification while the glycerol stream from the second decanter is recycled to the first reactor, following Lurgi’s glycerol cross flow production method [24]. A Schematic representation of the oil transesterification process at Prio Biocombust´ıveis S.A. is presented in figure 3.2.
Figure 3.2: Schematic representation of the oil transesterification process at Prio Biocom-bust´ıveis S.A.
3.1.3 Methyl Esters washing
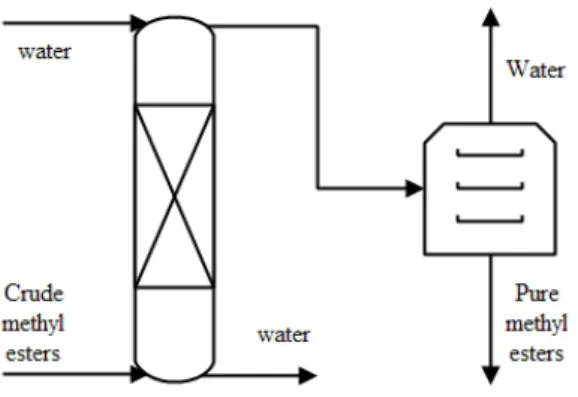
After the transesterification stage is complete, the crude methyl esters mixture (crude biodiesel) from the the second decanter still contains a small amount of impurities such as catalyst, soaps, glycerol and methanol, requiring further purification. Accordingly, the crude biodiesel goes through a liquid-liquid separation column where it is washed with slightly acid water, leading to methanol, glycerol, salts and soaps being transferred from the biodiesel to the aqueous phase [12, 18]. The water used contains hydrochloridric acid that reacts
3.1. BIODIESEL PRODUCTION PROCESS
with soaps, thus preventing the formation of foam. The washed biodiesel is then dried to remove residual water and methanol, after which it follows for additization. A schematic representation of the methyl esters washing process at Prio Biocombust´ıveis S.A. is shown in figure 3.3.
Figure 3.3: Schematic representation of the methyl esters washing process at Prio Biocom-bust´ıveis S.A.
3.1.4 Methanol Recovery
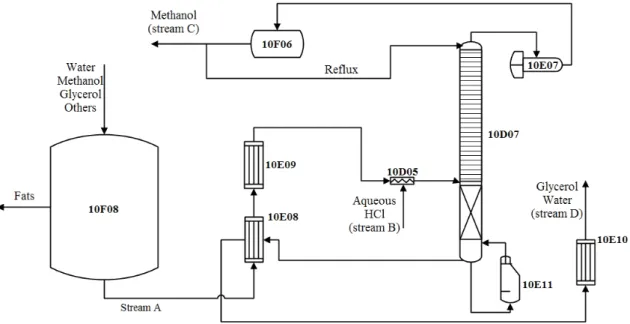
Methanol, as explained in 3.1.2, is used in excess during the transesterification process and needs to be recovered, hence the need of a methanol recovery process which is schemat-ically represented in figure 3.4. This process is performed (at Prio Biocombust´ıveis) in the distillation column 10D07, which is comprised of a packing section at the bottom and plate section at the top. The packing used are Torus Saddles, a ceramic random type of packing while the plates are Montz Tunnel Trays. The reboiler (10E11) used to evaporate the mixture in the column is a vertical thermosiphon and the condenser (10E07) is an horizontal tube and shell type. The pressure implemented in this operation is close to atmospheric.
Tank 10F08 is used to collect process streams that contain methanol, water and glycerol, like the glycerol stream from the first decanter and the washing water from the crude biodiesel washing. Through the middle of the tank, fat that forms the supernatant phase is removed while, through the bottom, the aqueous phase is directed to a series of two heat exchangers where it is heated to 75◦C using, in the first exchanger (10E08), the heat from the distillation column’s residue stream and then steam, in the second exchanger (10E09). The already heated stream is mixed with an aqueous hydrochloridric acid stream (through static mixer 10D05) to a pH of 2.5 in order to split any residual soaps and prevent foaming in the column [29]. The column’s feed is located between the packing and plate section.
In the distillation column, methanol and water are vaporized from the rest of the mixture and are continuously separated until, at the top, only methanol with less than 1000 ppm of water is obtained. The distillate from the top of the column is condensed and collected at tank 10F06. From that tank, part of the methanol then follows to the transesterification
CHAPTER 3. PRIO BIOCOMBUST´IVEIS S.A.
process while the rest goes back to the column as reflux. The methanol distillate needs to have a very small amount of water since it’s going to be used in the transesterification process, where the presence of water can originate hydroxyl ions which react to produce fatty acids and soaps instead of the desired methyl esters [18].
Figure 3.4: Schematic representation of the methanol recovery process at Prio Biocom-bust´ıveis S.A.
The column’s residue stream, comprised of water, glycerol and a small amount of methanol and other chemicals, passes through a series of two heat exchangers (the already mentioned 10E08 and 10E10) where it’s cooled before proceeding to the glycerol purification process.
Regarding the the energy requirements of the distillation column (in the form of steam provided by a boiler), this equipment is the most intensive energy consumer in the entire plant. The steam, that flows in the reboiler’s shell, is used to heat the reboiler in order to create a suitable vapour flow inside the column. The heat flux transferred, by conduction, from the steam to the mixture is influenced by the thermal conductivity of the material it passes through and is given by:
q = −k · A ·∆T
∆L (3.1)
From equation 3.1, the inverse of k·A∆L is the heat resistance of the material. In the reboiler, the heat transfer resistance comes from the reboiler’s material. However, yet another resistance forms when the column is operating due to the formation of a fouling layer inside the tubes, as can be seen in figure 3.5 a and b. This fouling layer forms in the reboiler as a result of the high temperatures and presence of chemicals other than water, glycerol and methanol in the feed stream. Heat transfer equation 3.1 can be rearranged into equation
3.1. BIODIESEL PRODUCTION PROCESS
3.2, accommodating the new resistance parameter -Retot- that is the sum of the fouling and
reboiler resistances.
q = − ∆T Retot
(3.2)
(a) (b)
Figure 3.5: a) Distillation collumn’s reboiler head; b)Reboiler’s pipes closeup.
The existence of fouling is a main concern since, as it thickens, it increases the heat transfer resistance (as seen by equation 3.2), hindering the heat transfer from which results the use of larger quantities of steam to get the same amount of heat transferred. Understating this limitation is very important to properly manage the distillation process as well as in the search for suitable solutions for this problem.
The distillation column control is made using model predictive control (MPC) that uses both real-time measurements and a predictive model to determine the output. This spe-cific type of control offers several advantages such as: ”(1) the process model captures of the dynamic and static interactions between input, output and disturbance variables, (2) constraints on inputs and outputs are considered in a systematic manner, (3) the control calculations can be coordinated with the calculation of optimum set points, and (4) accurate model predictions can provide early warnings of potential problems ” (in Model Predictive Control [30]). MPC is, however, only as good as the predictive model it uses and the use of an inadequate model can lead to greater instability in the process, hence the need of accurate models.
The controlled variables in the distillation process are the column’s temperatures. The internal temperature profile registered corresponds to the boiling temperature of each stage’s mixture, which are characteristic of each mixture’s composition, thus allowing the column’s temperature profile to be used as an indicative of the mixture compositions that circulate in the column. The process’s manipulated variables are the reflux/feed ratio and the reboiler’s steam pressure, which the MPC uses to control and lead the column’s temperature profile into the desired values.
CHAPTER 3. PRIO BIOCOMBUST´IVEIS S.A.
Another possible way for methanol recovery was found in the literature and is described as the dividing-wall column (DWC) [31]. It is reported that this type of equipment, when applied to the separation of methanol-water-glycerol mixtures, allows the separation of all three components while using less energy and reducing equipment costs and plant footprint, thus being an interesting alternative method to consider for new biodiesel plants or as an upgrade for already existing facilities [31].
3.1.5 Glycerol purification
Glycerol is the main by-product from oil transesterification and it can be used by other industries like the pharmaceutical or livestock food industry or as a precursor for added value chemicals like glycerol carbonate, acrolein or highly branched polymers [32, 33, 34], thus making its purification and transaction very attractive for the biodiesel industry.
The process for glycerol purification is simple, mainly due to the fact that it is only intended to upgrade the glycerol stream from a composition of 30-40% in weight to 80-90%. Sodium hydroxide is added first to set the pH to 7, following an evaporation process where water is removed until the desired glycerol composition is reached, after which the glycerol final product is obtained. A Schematic representation of the glycerol purification process at Prio Biocombust´ıveis S.A. is shown in figure 3.6.
Figure 3.6: Schematic representation of the glycerol purification process at Prio Biocom-bust´ıveis S.A.
3.2
An improvement driven industry
In face of an increasingly and already very competitive fuel industry and due to the the small profit margins of the said fuels retail, raw materials price fluctuations and the existent laws and regulations (regarding both product characteristics and environmental issues), the continuous search for process performance improvements is extremely important to assure market survivability.
When a chemical plant is already installed (such as the case of Prio Biocombust´ıveis S.A.), this continuous improvement is many times based in updates made to the production
3.2. AN IMPROVEMENT DRIVEN INDUSTRY
method, either by adding new equipments, replacing/updating dated ones for their improved versions, improving control systems or reducing waste, thus enhancing production quantity, quality and efficiency.
However, before taking any action towards improvement, one must begin by understand-ing and characterizunderstand-ing the process in question, this first step not always beunderstand-ing easy as in many cases the information needed is not readily available or it doesn’t exists at all.
As an example of common sources of information is data acquired from either the plant’s control system or by the quality department. In the case of non-existent information to support decisions related to future improvements and the impossibility of getting that infor-mation directly from the process, other solutions can be applied, such as the use of simulation software or laboratory experiments.
Having acquired the data needed, the next step is its treatment to obtain useful informa-tion, statistical analysis being often the chosen path:
• The Principal Components Analysis (PCA) is a technique often applied early to identify variable’s interactions.
• Design of Experiments (DoE) is another widely implemented and expeditious technique to gather experimental data according with the objective of study in that experiment. The experimental data can then be used to create empirical models.
• Multiple Linear Regression (MLR) is a technique that uses process information to generate models with more than one variable thar explain the process behaviour. The type of information MLR uses can vary from experimental data to observational data. The difference between the two data types mentioned above lies in experimental data being the product of a controlled experiment where a scientist is studying a specific parameter and intervenes in the experiment while observational data, by the contrary, is the mere observation and recording of what the scientist is observing, without his interference.
Chapter 4
Process data: stream analysis and
characterization
As was mentioned in section 3.2, gathering information about the process is a crucial and initial step towards improvement as it gives a better understanding of the process, helps in detecting problems, defining process trends and in building process models. Characterization of certain key process streams is perhaps the most obvious way to obtain a detailed description of the said streams also leading to the characterization of other unanalysed streams, by means of mass and energy balances.
At the start of the present work, and since it’s focus is the study of the methanol recovery process (figure 3.4), three streams where chosen to be characterised: the aqueous stream from tank 10F08 (stream A), the methanol stream from tank 10F06 (stream C) and the glycerol water stream from the bottom of the column (stream D). The selection of these streams was based on the information each could provide regarding the circulation of key components in the process and analytical methods required to do so. The samples to analyse were collected in 250 mL high density polyethylene flask.
Analytical methods used in the biodiesel industry are well established and, in most cases, regulated, by a recognized international organism or committee such as the European Com-mittee for Standardization or the American Oil Chemists’ Society. Knowing that the main components of the methanol recovery process are water, glycerol and methanol and having in mind the available laboratory equipment, the chemical analysis performed were based on the methods presented in table 4.1. It should also be mentioned that the samples collected from the base of the column had two liquid phases, the smaller and darker in color phase being the supernatant.
4.1. STREAM COMPOSITION
Table 4.1: Analytical methods used.
component norm method range
% (wt) water EN ISSO 12937:2000[35] Karl-Fischer coulometric titration 0.003 - 0.1
ASTM E203[36] Karl-Fischer volumetric titration 0.1 - 100 glycerol A.O.C.S. Ea-51[37] Sodium Periodate oxidation 0 - 100
methanol EN 14110[38] Gas chromatography 0.01 - 1
4.1
Stream composition
Taking a closer look at the methanol method’s range (table 4.1) and knowing, from previous experiments, that the methanol content of stream A should be in between 20-30%, it becomes obvious that this method can’t be applied to this stream.
Also, it was expected that no considerable amount of glycerol would reach the top of the column, thus not contaminating the methanol recovered, due to glycerol’s low vapour pressure (see appendix A). This has been confirmed by an initial analysis of the glycerol content on stream C, after which no other was made.
Still regarding stream C, as it’s main contaminant is water, only this component’s amount was determined for this stream, methanol comprising the remaining of the stream.
For stream D, the methanol amount was determined by gas chromatography. With methanol’s mass fraction on both stream C and D, by mass balance, the mas amount of methanol in stream A was determined.
Apart from water, methanol and glycerol, other components are present in stream A and D, the second phase formed in the residue stream being evidence of this. Although these components were not identified in this work, they are likely to be methyl esters or fats from either the transesterification or methyl esters washing processes. The mass fraction of these components, from now on, called “others” in streams A and B was determined by mass balance calculations after quantifying the water, methanol and glycerol. The HCl used to acidify the column’s feed is also counted in the “others” fraction.
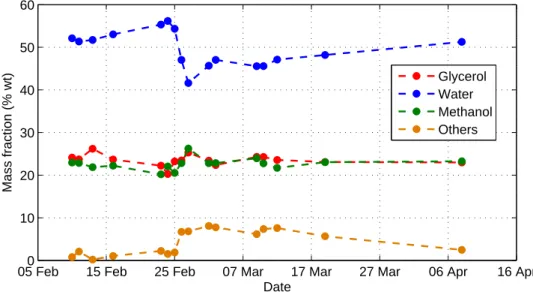
A graphical representation of the streams compositions and reboiler’s steam pressure/feed flow ratio (PV/FF) results, from 10-02-2015 to 08-04-2015, can be observed in figures 4.1, 4.3, 4.2 and 4.4. The remaining data collected during this work, regarding the column’s operating conditions, can be consulted in tables B.1 to B.6 from appendix B).
Analysing figures 4.1 and 4.2, clear variations in the column’s feed stream compositions can be seen, with similar variations being also registered in the column’s residue stream components, except for methanol. Comparing figures 4.1 and 4.3, it becomes obvious that, although stream A suffers from significant variations, the distillate’s quality is still kept, displaying a water content lower than the specified limit of 1000 water PPM.
CHAPTER 4. PROCESS DATA: STREAM ANALYSIS AND CHARACTERIZATION
Another important observation is that the steam pressure fed to the column’s reboiler varies significantly during the column’s operating period (see figure 4.4) and that higher pressures are usually accompanied by higher amounts of water at the distillate. Also, this reboiler’s steam pressure increase does not result in an increase of the column’s internal pressure, as seen during the start-up of the column.
05 Feb0 15 Feb 25 Feb 07 Mar 17 Mar 27 Mar 06 Apr 16 Apr
10 20 30 40 50 60 Date Mass fraction (% wt) Glycerol Water Methanol Others
Figure 4.1: Composition of stream A in % (wt)
05 Feb0 15 Feb 25 Feb 07 Mar 17 Mar 27 Mar 06 Apr 16 Apr
10 20 30 40 50 60 70 Date Mass fraction (% wt) Glycerol Water Methanol Others
4.1. STREAM COMPOSITION
05 Feb0 15 Feb 25 Feb 07 Mar 17 Mar 27 Mar 06 Apr 16 Apr
0.02 0.04 0.06 0.08 0.1
Water mass fraction (% wt)
Date 99.9 99.92 99.94 99.96 99.98 100
Methanol mass fraction (% wt)
Water Methanol
Figure 4.3: Composition of stream C in % (wt)
05 Feb 15 Feb 25 Feb 07 Mar 17 Mar 27 Mar 06 Apr 16 Apr
1.6 1.8 2 2.2 2.4 2.6 2.8 3 3.2 Date
Reboiler steam pressure (bar)
Chapter 5
Modelling of the methanol recovery
column with Aspen Plus
r
As was mentioned before, process simulation is a powerful tool to obtain important data when it’s not possible to obtain it directly from the field. In the present work, a process simulation software, namely Aspen Plus 8.6r, was used to simulate the distillation column with the intent of evaluating the effect of certain parameters, such as components fraction in feed, reboiler outlet temperature, reflux temperature and reflux/feed ratio in the column’s distillate quality.
In the previous chapter, one of the objectives in the analysis of the feed and products streams from the distillation column was to gather information that would serve as base for this simulation. However, some components were left unidentified (the ones corresponding to the “others” fraction in the streams). These components, although in small composition, are important to consider if a more accurate simulation is desired, therefore leading to the selection of 3 methyl esters to represent the “others” fraction, the three being methyl palmi-tate, methyl oleate and methyl linoleate. The choice of methyl esters was based in the fact that the two major streams flowing to tank 10F08 are coming from the first decanter and biodiesel washing column, where methyl esters are one of most abundant components along with water, glycerol and methanol. As for why these three in particular were chosen instead of others is due to these being the corresponding methyl esters of the most abundant fatty acids in soy, palm, rapeseed and UCO oils (see table 2.3). In the particular case of the HCl, fed to the column through stream B, it was not taken into account in the simulation due to being in small quantities and not influencing distillation. Stream B was so considered to be a simple water stream.
Having determined all components to be used, the simulation itself was kicked off with their introduction in the software. The thermodynamic model to be used was selected, in this case the UNIQUAC model with the Ideal Gas equation and using the UNIFAC parameter estimation option for the missing parameters. These are both suitable to represent
liquid-5.1. THERMODYNAMIC MODEL PARAMETERS
liquid and vapour-liquid equilibrium for components related with biodiesel production [39, 40]. As a result of the fouling in the reboiler, the data corresponding to the 8th of April, collected after a deep cleaning of the reboiler, was used in the simulation so that the simulation would reflect the functioning of the column at optimal conditions. In an initial stage, a DSTWU1 model was used to estimate the number of theoretical plates needed to obtain methanol at the desired purity, this step being so important because, in the more accurate RadFrac2 model, the number of stages to be used is defined by the user.
In the RadFrac model, in conformity with the real column’s specifics, a lower packing section and upper plates section was set, followed by height of packing and tray number, feed composition and flow, reflux ratio, reflux temperature, distillate flow and reboiler outlet temperature. The flowsheet diagram used is represented in figure 5.1. The formation of the second liquid phase was also contemplated in the simulation.
Figure 5.1: Aspen Plusr Flowsheet diagram used to simulate the distillation column with the RadFrac model.
Both the number of theoretical plates equivalent to the height of the packing and the reboiler outlet temperature were tuned until the composition of the product streams given by the simulator equalled the one determined for the samples of the 8th of April.
5.1
Thermodynamic model parameters
The choice of thermodynamic model and its respective binary interaction parameters are a factor of great influence in the accuracy of the simulation as they are the base for the equilibrium calculations.
Aspen Plusr has a very large database of binary interaction parameters that are readily available. However, some components were still not contemplated in this database having, as an alternative for this situation, the possibility to estimate the said parameters through the
1
Multicomponent shortcut distillation method. 2
CHAPTER 5. MODELLING OF THE METHANOL RECOVERY COLUMN WITH ASPEN PLUSr
UNIFAC model. In the present work, parameter estimation using UNIFAC model had to be used as none of the methyl esters had its parameters in the database.
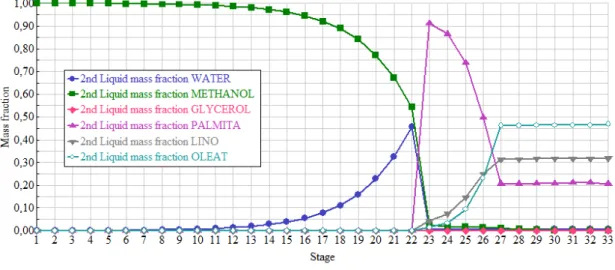
With all the required binary interaction parameters acquired, graphics with the compo-sitions of both liquid phases, along the column, were drawn (figures 5.3 and 5.2 for the first and second phase, respectively), concluding, from their analysis, that the second liquid phase is composed of mainly FAME components while the first liquid phase contains the water, glycerol and methanol.
In the second liquid phase graphic (figure 5.2), above the 22nd distillation stage, the FAME components are no longer present and water and methanol take their place, no longer existing the second liquid phase and the first, and only, liquid phase taking its place from there on. However, some irregularities were detected as FAME components have a very low vapour pressure (see appendix A) at the column’s operating conditions and shouldn’t, therefore, appear above the feeding stage (stage 27). These irregularities were a sign that the binary interaction parameters used for these methyl esters were not adequate and should, therefore, be replaced by more suitable ones, these being difficult to find due to the scarcity of equilibrium data in the literature for FAME components [39].
Figure 5.2: Second liquid phase composition along the column, computed with Aspen Plusr, using the software’s estimated UNIQUAC binary interaction parameters.
Some of the UNIQUAC binary interaction parameters that needed to be replaced were acquired directly from the work of M. Lee et al [39] while others, due to the data scarcity problem mentioned before, had to be calculated using the UNIFAC model with re-estimated UNIFAC group interaction parameters specific for fatty systems, acquired from the work of G. F. Hirata et al [41]. The newly obtained parameters, which are presented in table 5.1, were then introduced in the simulator and the second liquid phase compositions along the column were drawn again in figure 5.4, this time not showing any unusual behaviour regarding the methyl esters. Figures 5.3 and 5.5, show the composition along the column for the liquid and
5.2. SIMULATION RESULTS
vapour phases, respectively.
Figure 5.3: First liquid phase composition along the column, computed with Aspen Plusr, using the software’s UNIQUAC binary interaction parameters.
Figure 5.4: Second liquid phase composition along the column, computed with Aspen Plusr using the user estimated UUNIQUAC binary interaction parameters.
5.2
Simulation results
With the thermodynamic parameters now updated, the simulation proceeded without fur-ther problems and both the number of theoretical plates equivalent to the hight of the packing and the reboiler outlet temperature were again tuned to obtain de product compositions ob-served in the samples from the 8th of April. Regarding the reboiler outlet temperature, the value that was used in the simulation was 111◦C, this being in accordance with the columns operating manual that stipulated an optimum reboiler outlet temperature of about 110◦C.
CHAPTER 5. MODELLING OF THE METHANOL RECOVERY COLUMN WITH ASPEN PLUSr
Figure 5.5: Vapour phase composition along the column, computed with Aspen Plusr using UNIQUAC parameters estimated by the user.
The results from the simulation for the 8th of April are presented in table 5.2. In the condenser, one can see that roughly 90% of the energy removed is due to the condensation of the stream and the rest due to its subcooling. Also, both reboiler and condenser heat duties are similar, this being a consequence of the energy required to vaporize the methanol and water in the reboiler being the same as the one that is extracted at the condenser. The reboiler heat duty is, however, greater since, in this equipment, apart from the the water and methanol vaporization, the remaining components are also heated to the reboiler outlet temperature. The relative error between the composition values determined by Aspen Plusr (using the standard or re-calculated UNIQUAC parameters) and the process data for the same day was also calculated and can be found in table 5.3.
A graphical representation of the temperature profiles from the simulated column, using the standard or re-calculated UNIQUAC parameter, are presented in figure 5.6. From this figure and table 5.3 analysis, it’s evident that the simulator is able to replicate, relatively well, the temperature profile observed in the actual column. Furthermore, a somewhat noticeable difference in the temperature profiles can be seen between the 27th and 15th stage, this difference being a result of the different thermodynamic model parameters used, thus showing that inaccurate parameters have influence in the simulation.
The simulation was then tested using the feeding composition data from three different days and maintaining all the parameters used to simulate the column at the 8th of April. The results of these three tests are compiled in table 5.3. The larger errors for the simulation are observed for the water composition in stream C while the AARD value for the remaining components is low, this being a good indicator of the simulation’s capability to represent the methanol distillation process. Part of the discrepancy seen for the water percentage in the distillate can be explained by the fact that the simulator is dealing with very small amounts and thus, even small differences in any entry parameter, such as feeding compositions, can
5.3. SENSITIVITY ANALYSIS
Table 5.1: UNIQUAC binary interaction parameters used in the simulation.
component 1 component 2 A12 A21 B12 B21
watera methyl palmitatea -6.6411 0.9141 2191.247 -1170.807 methanola methyl palmitatea -2.6593 -4.2433 1198.464 1468.731
glycerola methyl palmitatea -3.3961 -3.4759 1460.439 1109.448 methyl palmitatea methyl linolatea 0.2547 -8.4386 43.557 3396.897 methyl palmitatea mehtyl oleatea -5.3838 -2.5133 2365.742 968.117
methyl linoleatea methyl oleatea -4.8956 -2.2591 2159.190 860.584
waterb methyl linolateb 0 0 130.750 -1096.140
waterb methyl oleateb 0 0 120.480 -1350.700
methanolb methyl linolateb 0 0 -97.340 -242.400
methanolb methyl oleateb 0 0 -36.140 -280.220
glycerolb methyl linolateb 0.9000 -50.0000 -257.950 13931.470
glycerolb methyl oleateb 0 0 -32.050 -693.740
waterc methanolc 0.6437 -1.0662 -322.131 432.879
waterc glycerolc 0.9755 0.2609 -188.494 -45.908
methanolc glycerolc 0 0 -100.422 -47.649
a parameters calculated using G.F. Hirata et al [41] re-estimated UNIFAC parameters
for the original groups.
bparameters acquired from M. Lee et al [39]. c parameters acquired from Aspen Plusr database.
introduce a large error.
With this, it can be said that the simulation can be used to simulate the behaviour of the column and to infer about the relations between its variables. The simulation shouldn’t, however, be used to accurately predict the water composition on the distillate, as the error associated is large.
5.3
Sensitivity analysis
A sensitivity analysis is a method used to study how certain independent variables affect the dependant variables of a certain process, thus identifying which have a higher impact. Although the definition might be simple, implementing such a method in an industrial process is difficult as the number of variables to consider is usually large, fluctuations on those variables are common, even in continuous process, and because the disturbances created during this analysis can hinder the process, in this case the quality of the methanol recovered, later affecting the transesterification process.
However, for the sake of understanding which variables have a higher impact on the distil-late purity, an alternative was found by using the simudistil-lated column in Aspen Plusr and it’s local sensitivity analysis module to study how certain parameters, such as components frac-tion in feed, reboiler outlet temperature, reflux temperature and reflux/feed ratio, influence the process without interfering in the actual distillation column. Since this is a local variation
CHAPTER 5. MODELLING OF THE METHANOL RECOVERY COLUMN WITH ASPEN PLUSr
Table 5.2: Aspen Plusr simulation results corresponding to the 8th of April.
composition (% wt\wt) feed distillate residue
water 0.521 184 PPM 0.674 methanol 0.229 1 0.002 glycerol 0.226 TR 0.292 methyl palmitate 0.005 TR 0.007 methyl linoleate 0.008 TR 0.01 methyl oleate 0.012 TR 0,015 condenser reboiler inlet temperature (◦C) 65.2 105 heat duty (kW) -918.9 1099.7 subcooled duty -95.2 -outlet temperature 29.4 111
analysis, the variation range considered for each variable was set having in consideration the limit operating conditions for the actual column.
To make this analysis easier, the absolute values obtained were converted to percentage increments or decrements, with the original simulation results corresponding to 0%. These percentages were determined according to equation 5.1:
% = Ξi,1− Ξi,0 Ξi,0
× 100 (5.1)
here Ξi,1 represents the variable’s new value and Ξi,0 the original variable’s value. The results
from this analysis were then converted to graphics, those being presented in figures 5.7 to 5.12. As this analysis is being made to understand which variables significantly affect the distillate purity, variations of −0.082% or lower in the purity will not be taken into consideration as they don’t give rise to out of specification distillate. The reason as to why such a slight change in the distillate quality is considered significant is mainly due to the fact that the distillate purity required is extremely high (< 1000 PPM of water), thus making variations of −0.082%, and lower, relevant to the methanol distillate mass fraction.
Figure 5.7 shows the increase, in percentage, of the methanol mass fraction at the distillate with the increase of the reflux/feed ratio. It is evident that, for the reflux/feed ratio variation range considered, the lower limit at which the distillate purity was overcame was for −4% and lower variations. As for positive variations of the reflux/feed, no perceptive changes in the quality of the distillate are seen, its value being already higher than the required distillate purity.
Figure 5.8 depicts the decrease, in percentage, of the methanol mass fraction with the increasing reboiler outlet temperature. Regarding the overall methanol mass fraction
vari-5.3. SENSITIVITY ANALYSIS 0 5 10 15 20 25 30 35 65 70 75 80 85 90 95 100 105 Plate number Temperature (ºC)
Aspen Plus, standard UNIQUAC Aspen PLus, recalculated UNIQUAC Experimental data
Figure 5.6: Distillation column’s temperature profiles.
−40 −30 −20 −10 0 10 20 30 40 −4 −3 −2 −1 0 1
Reflux/feed ratio variation (%)
Methanol mass fraction variation (%)
simulation results
Y = −0.0032x2−0.0042x−0.0555
Figure 5.7: Variation of the methanol mass fraction at the distillate with the variation of the reflux/feed ration.
ation seen in this figure, it can be seen that the lowest value observed is still far from the limit at which the distillate is out of specification with the addition that, for higher reboiler outlet temperature variations, the variation in the distillate tends to a constant value close to −0.02%. It should also be mentioned that reboiler outlet temperature variations lower than −2% are not considered since a temperatures lower than that is not compatible with the column’s operation as it is not high enough for the mixture to start boiling.
Figure 5.9 is referent to the decrease, in percentage, of the distillate methanol mass fraction with the increase in reflux temperature. As can be seen, the variation in the distillate hasn’t reached the limit at which it it out of specification. However, considering the behaviour of the curve, as the reflux temperature variation increases it is expected that the distillate quality will also decrease.
CHAPTER 5. MODELLING OF THE METHANOL RECOVERY COLUMN WITH ASPEN PLUSr
Table 5.3: Comparison between the Aspen Plusr given compositions and the compositions
observed in the field (% wt/wt) for streams C and D.
residue distillate
simulation setting
glycerol water methanol “others” water methanol 08-04-2015a observed 29.33 66.61 0.18 3.88 0.02 99.98 Aspen Plus 29.25 67.41 0.17 3.16 0.01 99.99 AARD (%) 0.29 1.21 2.13 18.46 22.86 <0.00 08-04-2015b observed 29.33 66.61 0.18 3.88 0.02 99.98 Aspen Plus 29.25 67.41 0.18 3.16 0.02 99.98 AARD (%) 0.29 1.20 1.44 18.46 0.31 <0.00 simulation testing 09-03-2015 observed 30.87 59.49 0.29 9.35 0.04 99.96 Aspen 31.18 60.63 0.28 7.90 0.02 99.98 AARD (%) 1.03 1.92 4.79 15.50 60.06 0.03 02-03-2015 observed 29.81 59.55 0.53 10.11 0.08 99.92 Aspen 29.54 59.73 0.50 10.22 0.01 99.99 AARD (%) 0.90 0.30 5.51 1.16 85.26 0.06 12-03-2015 observed 29.18 61.74 0.22 8.87 0.04 99.96 Aspen 29.41 60.90 0.21 9.48 0.01 99.99 AARD (%) 0.82 1.36 3.37 6.86 70.53 -0.03
aresults for the simulation prior UNIQUAC parameters correction. bresults for the simulation after UNIQUAC parameters correction.
At last, figures 5.10, 5.11 and 5.12 are about the variation of the methanol mass fraction at the distillate by varying the amount of the 3 main components of the column’s feed: water, methanol and glycerol. Starting with the water variation (figure 5.10), as it increases, distilate purity decreases. In turn, when the methanol amount at the feed increases, the distillate purity also increases. As for the glycerol, as it increases, almost no variation in the distillate occurs.
With all the graphics drawn, a common feature can be seen in all of them, except in the one regarding glycerol, it being that, at some point, the impact on the methanol mass fraction variation would tend to a stable value, thus enabling the identification of two different operating zones: the first being an area where significant variations could be seen and the distillate is out of specification and the second being an area where no significant changes can be seen and the distillate is within the specified requirements. With this, and considering that the objective of this test was to determine how much each variable affects the methanol recovery process, a second degree equation for figures 5.7 to 5.12 was adjusted to the data in the operating zone with significant variations. Those equations were then derived to obtain the methanol mass fraction sensitivity to change with each variable tested and to establish an order of importance, based on these derivatives, for the tested variables, which can be seen in table 5.4. The variables are ordered decreasingly, in the table, regarding its impact.