Validati
o
n
o
f
nov
el
biom
ark
er
s
f
or
c
olo
rec
tal
c
an
c
er
det
ec
tion
and
produ
c
tion
of
nov
el
ant
ibo
die
s
again
s
t
E
-s
ele
c
tin
ligand
s
Ro b er ta Zo p p i2019
LOMBADA
Roberta Zoppi
[Nome completo do autor]
[Nome completo do autor]
[Nome completo do autor]
[Nome completo do autor]
[Nome completo do autor]
[Nome completo do autor]
[Nome completo do autor]
MSc [Habilitações Académicas] [Habilitações Académicas] [Habilitações Académicas] [Habilitações Académicas] [Habilitações Académicas] [Habilitações Académicas] [Habilitações Académicas] November, 2019
Dissertação para obtenção do Grau de Doutor em Biologia- Especialidade em Biologia Celular
Dissertação para obtenção do Grau de Mestre em
[Engenharia Informática]
Orientador: Prof. Doutora Paula Alexandra Quintela Videira, Professora Auxiliar da Faculdade de Ciências e Tecnologia da Universidade NOVA de Lisboa
Co-orientador: Inv. Doutor Carlos Manuel Mendes Novo, Investigador Auxiliar do Instituto de Higiene e Medicina Tropical da Universidade NOVA de Lisboa
Júri:
Presidente: Prof. Doutor Paulo Manuel Assis Loureiro Limão Vieira Arguentes;
Prof. Doutor João Manuel Braz Gonçalves Prof. Doutor Hugo Ricardo Loureiro Soares
Vogais:
Prof. Doutor Paulo Sérgio de Matos Figueira da Costa Prof. Doutora Paula Alexandra Quintela Videira Prof. Doutora Margarida Casal Ribeiro Castro Caldas Braga
Validation of novel biomarkers for colorectal
cancer detection and production of novel
antibodies against E-selectin ligands
i
Validation of novel biomarkers for colorectal cancer detection and production of novel antibodies against E-selectin ligands
Copyright ©Roberta Zoppi, Faculdade de Ciências e Tecnologia, Universidade Nova de Lisboa.
A Faculdade de Ciências e Tecnologia e a Universidade Nova de Lisboa têm o direito, perpétuo e sem limites geográficos, de arquivar e publicar esta dissertação através de exemplares impressos reproduzidos em papel ou de forma digital, ou por qualquer outro meio conhecido ou que venha a ser inventado, e de a divulgar através de repositórios científicos e de admitir a sua cópia e distribuição com objetivos educacionais ou de investigação, não comerciais, desde que seja dado crédito ao autor e editor.
The Faculty of Sciences and Technology and the NOVA University of Lisbon have the right, forever and without geographical limits, to file and publish this dissertation through printed copies reproduced in paper or by digital means, or by any other mean known or that is invented, and to disclose it through scientific repositories and to allow its copying and distribution for non-commercial educational or research purposes, provided that the author and editor are credited.
iii
v
Acknowledgments
The PhD journey is a challenging professional and personal growth. None of this would be possible without the people that surround and support me.
Firstly, I would like to thank my supervisor Dr. Paula Videira for believing in my potential and for giving me this great opportunity. I will always be thankful for the great care in supporting my decisions.
A special thanks goes to my co-supervisor Carlos Novos, and to my collaborators, Dr. Alexandre Ferreira, Dr. Lucio Santos and Dr Sandra Van Vliet for the unconditional trust.
To Dr Daniel Spencer and Helen Williamson, for being the best supporter and for being fundamental in defining my future path.
A lab is not a lab without the beautiful people sharing joys and disappointments of everyday experiments, thus thanks go to Mylene, Zelia, Danielle, Diana, Gonçalo, Rita and Erika.
To my “MSc” super friends and supporters Constança (stanza), Tiago (T) and Carlota (lota). The best master student a worker could ask for and the best souls a person could look for.
To my PhD besties Lily, Fanny and Tiago (Tj) who shared with me every hope, every laugh and every tear. Probably I would have achieved half of what I have accomplished without you around. I am very lucky to be your friend
To that beautiful group that goes under the name of GLYCOCAN. I could never imagine a more perfect team that this one. You are all special people and I am glad the destiny brought us together. A particular thanks must go to my partner in crime Giulia and my five-star-rating friend Thanos. I am very thankful to have you in my life.
To the family I have chosen and that is distributed around the world. Joji, Anisi, Ghedy, Tian, Pini, Sandra, Alessandra, Anindita, Sarah, Isa, Jul, Jason. You make me a better person and I miss you everyday.
To the family I have chosen in Portugal: Joan, Arianna, Rita, Guily, Bruno and Jack. Thank you for all the good times and for making my life in Portugal unforgettable. To my sister Nicolyini, without who my life in Lisbon would have been another story. You made the difference.
Finally, the best thanks must go to my family, who I did not chose but I am so lucky. to have. To my brother and best friend Fulvio, who compensate my irruent personality and who always have been my number one supporter. We brought brotherhood to the next level.
To my mom and dad without who I will not be the person who I am today. You taught me how to be strong and independent but also to be kind and generous with the others. Your unconditional support is what motivates me everyday to be the best version of myself. I love you very much.
vii
Resumo
Em 2018, o cancro colorectal (CRC) continua a ser o segundo tipo de cancro mais mortal, com 881,00 mortes dos 1.8 milhões de novos casos. A deteção de estádios avançados tem mais probabilidade de desenvolver recorrências, mesmo após o tratamento, o que leva à necessidade de criar um novo sistema para a deteção de estádios iniciais. Assim, compreender a biologia e a descoberta de bio marcadores são etapas importantes na investigação do cancro.Vários estudos sobre glicosilação associada ao cancro revelaram que a glicosilação aberrante é uma característica universal em várias fases da transformação maligna e progressão tumoral. A glicosilação aberrante está associada com tempos de sobrevivência inferiores, progressão tumoral e metástase, nomeadamente, a sobre expressão dos antigénios Thomsen-nouvelle (Tn)-, T-, e sialil-T (sT). Os principais portadores dos antigénios sT e sTn identificados são a mucina MUC1 e a glicoproteina CD44v6. Por outro lado, os antigénios de Lewis e os seus derivados sialilados (Lex/sLex and Lea/sLeA) são os epitopos associados ao cancro mais proeminentes, em ambos as glicoproteínas e glicolípidos, já que a sua sobre expressão está relacionada com transformações malignas no CRC e pode levar a uma maior adesão e motilidade das células tumorais, resultando em metástase.
O projeto tem como objetivos descobrir novos bio marcadores com potencial para a deteção precoce de CRC e avaliar o potencial terapêuticos de anticorpos contra antigénios associados ao CRC, nomeadamente contra antigénios de Lewis, Tn, T- e sT. Pela mesma razão, glicoproteínas, como a MUC1, CAE e CD44 vão ser estudadas para o desenvolvimento e produção de novos anticorpos monoclonais.
Após a validação de bio marcadores, a tecnologia de hibridoma foi escolhida para produzir novos anticorpos contra sLe e/ou CD44, imunizando murganhos diretamente com proteínas de linhas celulares cancerígenas. O hibridoma contra CD44 mostrou marcação contra CD44 e sLex/a e foi
realizada uma triagem adicional. A segunda linha de hibridoma contra antigénios sLe também mostrou positividade contra vários lizados celulares totais de células de CRC. Dois clones foram selecionados para caracterização adicional. Os clones irão ser validados para a deteção precoce ou, potencialmente, tratamento de CRC.
Palavras-chave: Glicosilação, Cancro Colorectal, sialil Lewis, CD44, E-selectina, biomarcador tumoral, deteção precoce, anticorpos monoclonais, tecnologia de hibridoma, investigação translacional.
ix
Abstract
In 2018, colorectal cancer (CRC) remains the second deadliest kind of cancer with 881,00 deaths of the 1.8 million new cases. Late stages detection is more likely to develop recurrences, even after treatment, leading to the necessity to create a new system to early stages detection. Thus, understanding the biology of the cancer and biomarker discovery are important steps in cancer research. Several studies on cancer-associated glycosylation revealed that aberrant glycosylation is a universal feature in various steps of malignant transformation and tumour progression. Aberrant glycosylation is associated with poor survival, cancer progression, and metastasis, such as overexpression of Thomsen-nouvelle (Tn)-, T-, and sialyl-T (sT) antigens. Main carriers of sT- and sTn-antigens were identified as the mucin MUC1 and CD44v6. On the other hand, the Lewis antigens and their sialylated derives (Lex/sLex and Lea/sLeA) are the most prominent cancer-associated epitopes on both glycoproteins and glycolipids, since their overexpression is related to CRC malignant transformations and may lead to increased tumour cell adhesion and motility, thereby resulting in metastasis.The project aims to discover new potential biomarkers for CRC early detection and to evaluate the therapeutic potential of antibodies against CRC-associated antigens, namely against Lewis antigens and Thomsen-nouvelle (Tn)-, T-, and sialyl-T (sT) antigens. For the same reason glycoproteins, such as MUC1, CAE and CD44 will be studied for the development of novel monoclonal antibody production.
After biomarker validation, hybridoma technology has been chosen to produce novel antibodies against, sLe and/or CD44, immunizing the mice directly with cancer cell lines proteins. The hybridoma against CD44 show staining against CD44 and sLex/a and further screening must be
performed. The second hybridoma line against sLe antigens also shows positivity against different total cell lysate of CRC cells. Two clones have been selected for further characterization. The clones will be validated either for CRC early diagnosis or CRC treatment potential.
Keywords: Glycosylation, Colorectal cancer, sialyl Lewis, CD44, E-selectin, cancer biomarker, early diagnosis, monoclonal antibodies, hybridoma technology, translational research
xi
Table of Contents
ACKNOWLEDGMENTS ... V RESUMO ... VII ABSTRACT... IX
LIST OF TABLES ... XVII ABBREVIATIONS ... XXVII
INTRODUCTION ... 1
1.1. CANCER ... 1
1.1.1EPIDEMIOLOGY AND STATISTICS ... 1
1.2. HETEROGENEITY ... 3
1.2.1THE TUMOUR MICROENVIRONMENT ... 3
1.2.2CANCER EVOLUTION AND HALLMARKS OF CANCER ... 5
1.2.2.1 Self-Sufficiency in Growth Signals... 6
1.2.2.2 Insensitivity to antigrowth signals ... 7
1.2.2.3 Evading apoptosis ... 8
1.2.2.4 Limitless replicative potential ... 9
1.2.2.5 Sustained angiogenesis ... 10
1.2.2.6 Tissue Invasion and Metastasis ... 11
1.2.2.7 Genome instability and mutation ... 12
1.2.2.8 Immune escaping and tumour promoting inflammation ... 13
1.2.2.9 Reprogramming energy metabolism ... 14
1.3 COLORECTAL CANCER ... 15
1.3.1DIAGNOSIS AND BIOMARKERS ... 15
1.3.1.1 Fecal occult blood test and fecal immunochemical test ... 16
1.3.1.2 DNA and RNA ... 17
1.3.1.3 Proteins... 18
1.3.1.4 Cell free DNA and circulating tumour cells ... 19
1.3.2SECOND PHASE OF DIAGNOSIS ... 19
1.3.3COLORECTAL CANCER AND STAGES CLASSIFIERS ... 20
1.3.4NEW ALGORITHMS FOR STAGING AND DIAGNOSIS ... 21
xii
1.4. GLYCOSYLATION ... 24
1.4.1N-GLYCANS ... 26
1.4.2O-GALNAC GLYCANS ... 27
1.4.3FUNCTION OF GLYCOSYLATION ... 30
1.5. HALLMARKS OF CANCER GLYCOSYLATION ... 31
1.5.1SUSTAINING PROLIFERATIVE SIGNALLING ... 33
1.5.2EVADING GROWTH SUPPRESSORS ... 34
1.5.3DEREGULATING CELLULAR ENERGETICS... 34
1.5.4RESISTING CELL DEATH ... 35
1.5.5ENABLING REPLICATIVE IMMORTALITY... 35
1.5.6ANGIOGENESIS... 35
1.5.7ACTIVATING INVASION AND METASTASIS ... 36
1.5.8GENOME INSTABILITY AND MUTATIONS ... 37
1.5.9TUMOUR PROMOTING INFLAMMATION AND TUMOUR ESCAPE ... 37
1.6. COLORECTAL CANCER AND GLYCOSYLATION ... 38
1.7. GLYCOPROTEINS AND BIOMARKER DISCOVERY ... 42
1.7.1TIMP1 ... 43 1.7.2MUC1 ... 43 1.7.3CARCINOEMBRYONIC ANTIGEN ... 44 1.7.4CA19-9 ... 45 1.7.5CD44 ... 45 1.8. ANTIBODIES ... 47
1.8.1PRODUCTION OF MONOCLONAL ANTIBODIES ... 48
1.8.1.1 Hybridoma technique ... 49
1.8.1.2 Immortalized B cells ... 50
1.8.1.3 Phage display ... 50
1.8.2MONOCLONAL ANTIBODY IN CANCER... 51
1.8.3GLYCAN-BINDING MONOCLONAL ANTIBODIES AND LECTINS ... 52
RATIONALE AND AIMS OF THE THESIS ... 55
MATERIAL & METHODS ... 57
2.1 CELL LINES ... 59
2.1.1STOCK ... 59
xiii
2.1.3CELL GROWTH CURVE ... 61
2.1.4INFLUENCE OF CONFLUENCY IN GLYCOSYLATION EXPRESSION ... 61
2.1.5IC505-FLUOROURACIL ... 61
2.1.6TRANSDUCTION OF LS174T CELL LINE WITH LENTIVIRUS ... 62
2.1.6.1 Luciferase assay ... 62
2.2 ANTIBODIES AND LECTINS ... 63
2.3 IMMUNOASSAYS ... 64
2.3.1FLOW CYTOMETRY ... 64
2.3.2ANTIBODIES BLOCKING MIGRATION BY WOUND SCRATCH ASSAY ... 65
2.3.3IMMUNOFLUORESCENCE ... 65
2.3.4IMMUNOHISTOCHEMISTRY ... 66
2.3.4.1 In situ proximity ligation assay ... 67
2.3.5RT Q-PCR ... 68
2.4 BIOMARKER ISOLATION AND STUDY ... 69
2.4.1PROTEIN EXTRACTION ... 69
2.4.2IMMUNOPRECIPITATION ... 69
2.4.3SDS-PAGE AND WESTERN BLOT ... 70
2.5 BIOMARKER GLYCOSYLATION CHARACTERIZATION ... 71
2.5.1ENZYME TREATMENT ... 71
2.5.2FÖRSTER RESONANCE ENERGY TRANSFER ... 71
2.5.3LIQUID CHROMATOGRAPHY-MS-MS ... 72
2.6 ANTIBODY PRODUCTION ... 73
2.6.1ANTIGEN PREPARATION AND ISOLATION ... 73
2.6.2IMMUNIZATION ... 74
2.6.3HYBRIDOMA TECHNOLOGY ... 74
2.6.4CLONING ... 75
2.6.5DOT BLOT ... 75
2.6.6ENZYME-LINKED IMMUNOSORBENT ASSAY (ELISA) ... 76
2.6.6.1 Live cell ELISA ... 77
2.6.7FLOWCYTOMETRY OF HYBRIDOMAS ... 77
2.7 STATISTICAL ANALYSIS ... 77
RESULTS ... 79
xiv
3.1.1CELL GROWTH TIME GLYCAN AND CANCER STAGE DEPENDENT ... 82
3.1.2GLYCAN AND PROTEIN EXPRESSION -LIVE CELLS-... 85
3.1.3GLYCAN AND PROTEIN EXPRESSION -PROTEIN EXTRACTION- ... 88
3.1.4GLYCAN AND PROTEIN EXPRESSION -COLORECTAL CANCER PATIENTS- ... 93
3.1.4.1 Correlations in immunohistochemistry results ... 97
3.1.5BIOMARKERS ANTI-TUMOUR EFFECT ... 100
3.2 PART II: BIOMARKER ISOLATION AND CHARACTERIZATION ... 104
3.2.1IMMUNOPRECIPITATION AND ISOLATION OF ANTIGENS ... 105
3.2.2E-SELECTIN LIGANDS ANALYSIS ... 106
3.2.2.1 CD44 as E-selectin ligand in CRC ... 106
3.2.3FÖRSTER RESONANCE ENERGY TRANSFER BETWEEN CD44 AND SLEX/A ... 108
3.2.4CD44 TYPE OF GLYCOSYLATION ... 109
3.2.5CD44 AS A SOLUBLE BIOMARKER ... 111
3.2.6ANTIGEN ISOLATION AND PREPARATION ... 111
3.3 PART III: IMMUNIZATION AND SERUM TESTING ... 113
3.3.1IMMUNIZATION TYPES AND TIMELINE ... 113
3.3.2SERUM TESTING BY ELISA ... 114
3.3.3E-SELECTIN TESTING BY ELISA ... 115
3.3.4SERUM CHECK ON LIVE CELLS ... 116
3.3.5SERUM CHECK OF MICECD44 BY DOT BLOT ... 117
3.4 PART IV: HYBRIDOMAS CLONING AND ANTIBODY SELECTION ... 119
3.4.1MICECD44 CLONE’S SELECTION PROCESS ... 119
3.4.2MICELS174T CLONE’S SELECTION PROCESS ... 125
3.5 PART V: SIDE EXPERIMENTS ... 134
3.5.1CELL CONFLUENCY INFLUENCING GLYCOSYLATION EXPRESSION ... 134
3.5.2COLORECTAL CANCER CMS ... 136
3.5.35FUIC50 IN HIGHLY GLYCOSYLATED CELLS ... 138
3.5.4LUCIFERASE ASSAY ... 139
DISCUSSION & CONCLUSION ... 141
4.1BIOMARKER RESEARCH AND MATERIAL SELECTION ... 142
4.2COLORECTAL CANCER CELLS LINES OVEREXPRESSING CD44 AND SLEX/A ... 143
4.3CD44 AND SLEX/A INVOLVED IN GANGLION METASTASIS ... 144
xv
4.3SERUM TESTING AND ANTIBODY SPECIFICITY ... 147
4.4HYBRIDOMA MAINTENANCE AND CLONES' SELECTION ... 148
4.5CLONE 2B1 FROM MICECD44 ... 149
4.6CLONE 23A1 FROM MICELS174T ... 149
4.7IMPORTANCE OF GLYCOSYLATION STANDARDIZATION ... 150
5.1CONCLUSIONS ... 152
5.2FUTURE WORK ... 153
OTHER CONTRIBUTIONS ... 154
ABSTRACT... 156
1.INTRODUCTION ... 156
2. THE ROLE OF CRC HETEROGENEITY IN THE CLINICAL DECISION ... 157
3. FACTORS INDUCING HETEROGENEITY AND NEW CLASSIFICATION ... 160
4. CRC DETECTION ... 161
5. IMPROVING CRC SCREENING ... 162
6. BIOMARKERS IN USE... 165
7. THE ROLE OF CSM CLASSIFICATION IN PROGNOSIS AND TREATMENT ... 168
8. GLYCOSYLATION AS THE MISSING LINK ... 169
9.THE ROLE OF GLYCOSYLATION IN THERAPY ... 172
10. GLYCOSYLATION AND NEW THERAPIES ... 173
11. CONCLUSION ... 175
ACKNOWLEDGEMENTS ... 176
REFERENCES ... 176
DEVELOPMENT AND VALIDATION OF NOVEL ANTIBODIES AGAINST SIALYLATED ANTIGENS IN COLORECTAL CANCER ... 183
xvii
List of Tables
Figure 1.1 Global map ranking of cancer premature mortality worldwide up to 70 years, in 2015. The number of countries is included in the legend. Project GLOBOCAN 2018, adapted from World Health Organization (WHO) ... 1
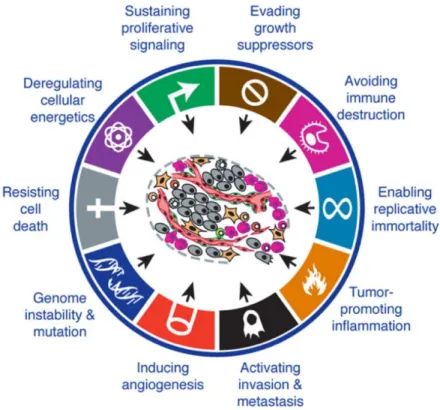
Figure 1.2 The hallmarks of cancer.i) Sustain proliferative signals, ii) evading growth suppressor, iii) activating invasion and metastasis, iv) enabling replicative mortality) inducing angiogenesis and vi) resisting cell death represent the first six hallmarks theorized in 2000. In the revision of 2011, vii) deregulating cellular energetics and viii) avoiding immune destruction where added as emerging hallmarks. ix)Tumour promoting inflammation, x) genome instability and mutation are considered as tumour enabling characteristics. Image adapted from Hanahan and Weinberg (2011). ... 6
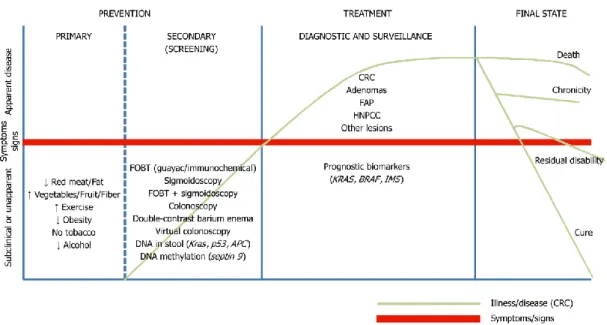
Figure 1.3. Schematic representation of all the alternatives test available for colorectal cancer prevetion, screening, diagnosis, prognosis and treatment. The red line separate symptomatic from asymptomatic patients; in green is represented the stages of CRC. FOBT: fecal occult blood test, FAP: familial adenomatous polyposis, HNPCC: hereditary nonpolyposis CRC. Image adapted from Binefa et al. (2015) ... 16
Figure 1.4. Molecular consensus subtypes regrouped data of algorithm analysis for CRC classification. For each group is listed the percentage of frequency, genetic and epigenetic features that characterizes each subgroup. Image adapted from Guinney et al. (2015). ... 22
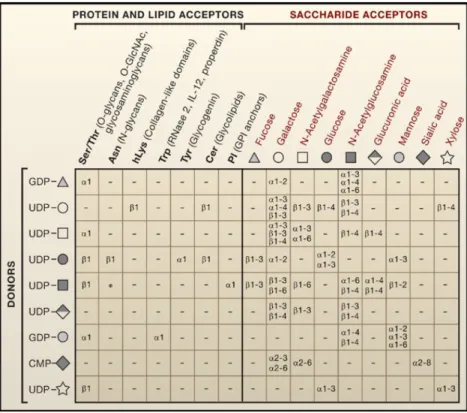
Figure 1.5 Representation of the possible linkages between sugar donors (on the left) and their respective protein and lipid acceptors (up-left) or/and their saccharide acceptors (up-right).α and ß correspond to the type of glycosidic bondage of the sugars depending on the anomeric position of the stereocenter linked though position 1-2. Numbers from 2 to 6 identify position on the acceptor saccharide. Image adapted from Ohtsubo et Marth (2006)... 25
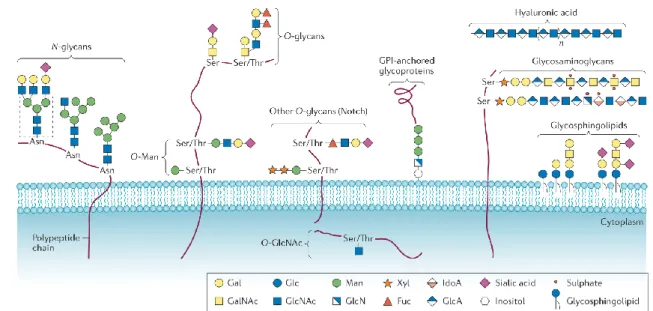
Figure 1.6 Common classed of glycoconjugates in mammalian cells. N-glycans, O-glycans, GPI-anchored glycoproteins and glycosaminoglycans are the major class of protein linked to glycans; differs for preferences in aminoacidic linkage and structures. Hyaluronic acid belongs to the glycosaminoglycans family but is found free in the ECM. Glycosphingolipids (GSLs) are the major class of glycans bound to lipids. on the bottom-right is the coloured legend of monosaccharide components. image adapted from Pinho et Reis (2015) ... 26
Figure 1.7 Three main types of N-Glycans. Oligomannose, complex and hybrid, share the same pentasaccharides core but differs for the elongation. Image adapted from Essential of glycobiology (2009). ... 26
xviii
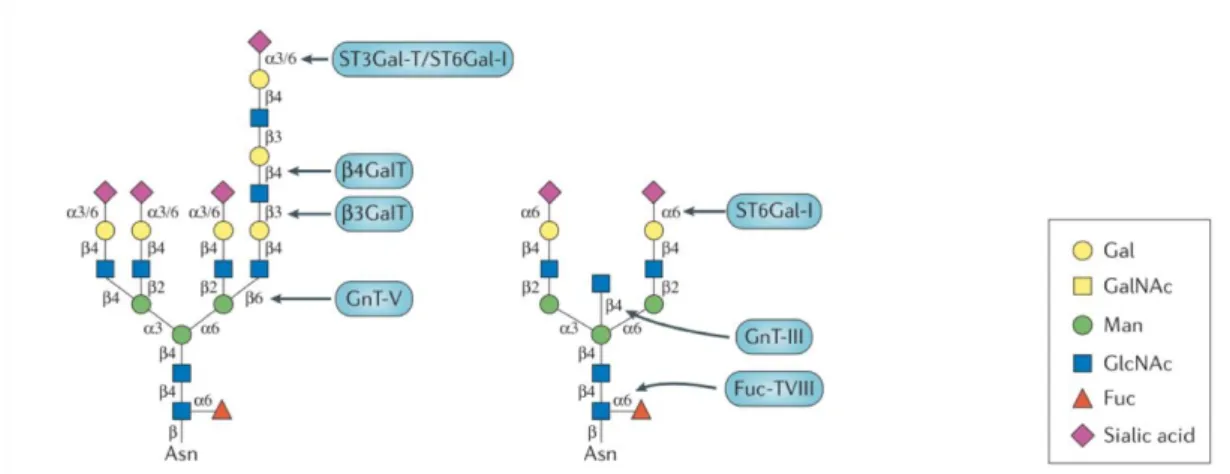
Figure 1.8 Example of different N-glycans with specific glycoenzymes, responsible for each linkage (in blue). Sialyltransferases, such as α-galactoside α-2,6-sialyltransferase I (ST6Gal-I), α2,3-sialyltransferases (ST3Gal-Ts); fucosyltransferases 8 (Fuc-TVIII); N-acetylglucosamine (GlcNAc) transferases (GnTs); galactosyltransferase (GalT). Image adapted from Pinho et Reis (2015) ... 27
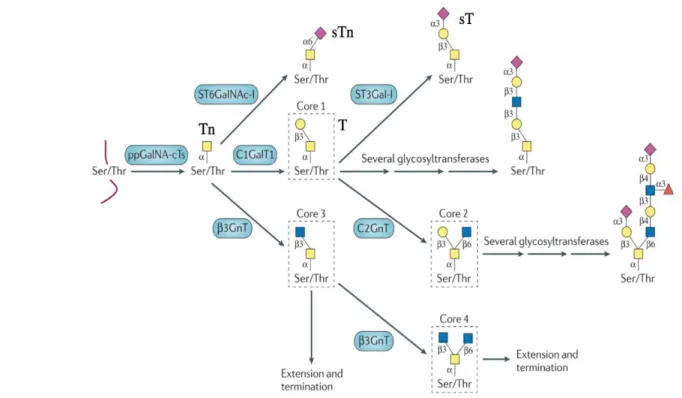
Figure 1.9 O-glycans core structure assembling pathway. Different glycoenzymes (in blue) are involved in the catalysis. Sialyltransferases, such as α-GalNAc ST6Gal-I (ST6GalNAc-I),α2,3-sialyltransferases (ST3Gal-Ts); fucosyltransferases 8 (Fuc-TVIII); N-acetylglucosamine (GlcNAc) transferases (GnTs); galactosyltransferase (GalT). Image adapted from Pinho et Reis (2015) ... 29
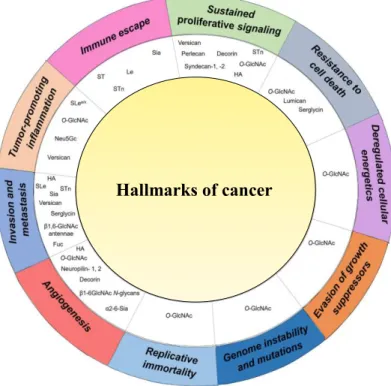
Figure 1.10 Association of expression of aberrant glycans for each cancer hallmark. General increase in O-GlcNAc is mostly common to all steps. Increase of Le, sLe, sTn is mainly involved with invasion and metastasis, tumour-promoting inflammation and immune escape. Image adapter from Peixoto et al (2019) ... 33
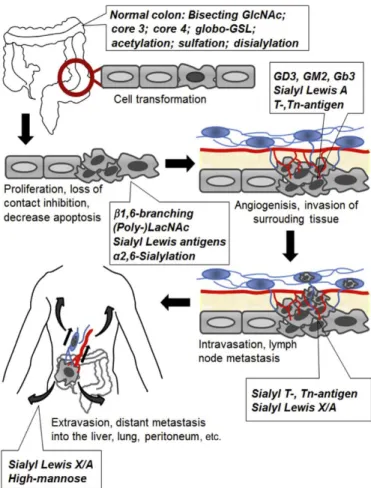
Figure 1.11 Alteration of glycan structure in different phases of CRC formation and progression. A general increase in SLe antigens, sialylation and fucosylation is common throughout the different steps. Image adapted from Holst et al. (2015) ... 39
Figure 1.12 Broad overview of antibody structure and diversity. a) structure of an immunoglobulin G (IgG) antibody’s molecule is composed by constant (C) and variable (V) domains for each light (L) or heavy (H) chain. The heavy chain comprises three constant domains (CH) and one variable (VH), and the light chain contains one constant (CL) and one variable (VL) domain. Specificity of an antibody is determined by its complementarity-determining regions (CDRs). b) IgG can switch different subtypes depending on the Fc effector function. c) switch in class of antibody improves the effector function of the antibody and increases its ability to eliminate the pathogen that induced the response. engineering of antibodies comprehends the different modification to the Y structure with the intent to reduce immune response and increase efficacy. d) humanization of the antibody sequence and e) creation of shorter fragments have been the most successful modification up to the date. ... 48
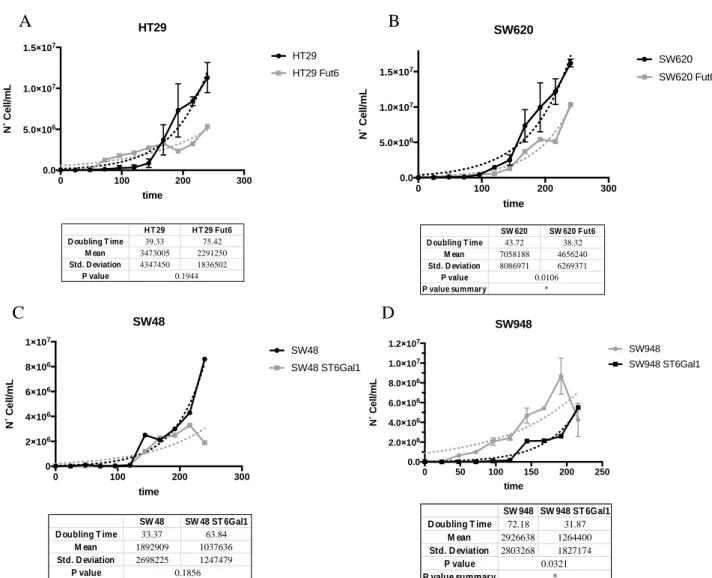
Figure 3.1Colorectal cell lines calculation of doubling time, glycan dependent. Cell lines were equally distributed in culture and analysed at the same time of the day for 10 days. Dots represent day of harvest while continuous dotted lines show trend lines of growth. In A) HT29 and HT29 transfected with FUT6 gene shows an increase of almost 2x of doubling time, contrasted by results in B) were differences between SW620 and SW620 FUT6 are almost null. In C) increase of doubling time from SW48 to SW48 ST6Gal1 is shown, while in D) decrease of cell growth between SW948 and SW948 St6Gal1 has been revealed. ... 83
Figure 3.2 Comparing of CRC growth rating stage dependent. Analysis show that LS174T and SW948, of stage II, have a slower doubling time compared to HT29, SW48 and SW620 of stage III. ... 84
xix
Figure 3.3 Representation of median fluorescence intensity (MFI) of different antigens extracellular expression. The antigen tested are sLex/a, Ley, Lex, Tn, sTn, CEA and CD44. Different
colon cell lines (A-F) have been tested in order to look for a potential biomarker and to find correlation between cancer grades and antigens expression. In A) normal colon CCD841Con presents high expression of CD44 but none of aberrant glycosylation. Grade 1 B) LS174T presents high level of CD44, of Tn and sLex/a antigens. In grade 1 C) HT29and its correlate FUT6 transfected
cell lines, is maintained high expression in sLex/a antigens but a moderate expression of CD44
antigen. In grade 3 D) SW948 and its corresponding ST6Gal1 transduced cell lines, shows high expression in CD44, in Lex and a relative low expression in CEA and sLex/a antigens. In E) SW48 and
the transduced ST6Gal1 maintain a low signal in Lex and relatively low CD44. In F) grade 4 SW620
and its relative FUT6 cell line displayed low CD44 expression contrasted by high sLex/a expression.
... 85
Figure 3.4 Correlation of (s)Lewis antigen expression in different stage-correlated cell lines. A-C) High expression of sLex/a is presented in most of the cell line studied LS174T (stage 2), HT29 and
SW620 (stage 3). In D) lower expression of Lex is presented in SW948 (stage 2), while in E) no cell
line responded to Ley signals. ... 87
Figure 3.5 Differences in glycoprotein expression in different cancer stages. In A) SW948 shows a moderate-low expression of the CEA protein, while in B) the expression of CD44 is very high in CCD 841 Con and stage 2, LS174T and SW948, and is reduced in stage 3, SW48-HT29- SW620, cell lines. ... 87
Figure 3.6 study of sLewisx/a antigens expression correlated with the CD44 glycoprotein. In the wt
and mock HT29, sLex/a antigens are moderately expressed while the protein CD44 is almost absent. In the HT29 FUT6 transfected cell line, an expected increase of SLex antigens is correlated
to a substantial increase of CD44 expression. ... 88
Figure 3.7 western blots total lysate extraction of CRC cell lines (20µg/µL) analysed by HECA-452 (1:1000). In A) LS174T presents two major bands, at >245kDa and 180>x>135; in B) HT29 FUT6 present increase of sLex/a signal at ~135kDa and ~90 kDa and no almost signals is detected in wt
and mock controls; in C) SW948 and 48 (wt, mock,St6Gal1) present smaller signals at ~100 kDa and at 75>x>55 kDa; in D) SW 48 (wt, mock, ST6Gal1) present smaller signals at ~100 kDa, at 75>x>63 kDa; in E) SW620 wt and mock present the only band at ~100 kDa, while FUT6 presents increase of expression at ~200 kDa, ~170 kDa and at ~90 kDa. ... 89
Figure 3.8 western blots total lysate extraction of CRC cell lines (20µg/µL) analysed by anti-CD44-hpan (1:1500. In A) LS174T presents two major bands at >135kDa and at ~90kDa, probably two glycosylated form. Same bands are found in HT29 wt, mock and FUT6. However, in HT29 FUT6 is presented a new band at ~130kDa, probably due to differences in glycosylation. In B) SW48 (wt, mock, ST6Gal1) reveal two bands at ~90kDa and ~75kDa, with lower signal intensity. Same
xx
pattern is revealed in SW948 (wt, mock, ST6Gal1) with the exception of a consistent isoform at ~135kDa. In D) SW620 (wt, mock) presents a band at ~50kDa probably no glycosylated. No bands are revealed in SW620 FUT6... 90
Figure 3.9 western blots total lysate extraction of CRC cell lines (20µg/µL) analysed by anti-CD66e (1:1000). In A) LS174T presents one major band at ~200kDa, probably glycosylated. In B) HT29 wt, mock one band at ~180kDa has been revealed but no signal is found in FUT6. In C) andD) SW948 and SW48 (wt, mock, ST6Gal1) reveal two bands between ~48-40 kDa, with lower signal intensity. In E) SW620 (wt, mock) presents a band at ~60kDa probably no glycosylated. No bands are revealed in SW620 FUT6... 91
Figure 3.10 western blots total lysate extraction of CRC cell lines (20µg/µL) analysed by anti-CD15 (1:1500). In A) LS174T presents smeared band from 180kDa down to ~50kDa. In B) HT29 (wt, mock) two bands at <48 kDa and one band at ~48kDa in found in FUT6. In C) SW948 and smeared band at 250>x>100 kDa are presented, validating results obtained by flowcytometry. In D) SW48 (wt, mock, ST6Gal1) reveal two bands at ~180kDa and ~100kDa, with medium-high signal intensity. In E) SW620 (wt, mock, FUT6) no bands are revealed. ... 92
Figure 3.11 Example of immunohistochemistry staining with different antibodies tested on same tissue cut from CRC patient. In tissue section in A) CEA presents high intensity and extension andCD44 present an intense membranal staining. In tissue section in B) Lex, sLex and sLea presents
high extension and intensity, overlapping signals in A). In B) Ley and HECA-452 (sLex/a) present,
respectively none and lower staining ... 96
Figure 3.12 Antigens scoring inter-correlations obtained by immunohistochemistry results of cohort of 40 CRC patients. Main significant correlations are found among CD15s, CA19.9 and HECA (**) ... 97
Figure 3.13 Correlation studies between cancer staging and antigen expression. In A) increase in CD44 expression (extension x intensity) is correlated with significant (*) increase of cellular invasiveness (stages III/IV). Equally, in B) increase in Ley extension in expression is significantly (*)
correlated with a more malignant phenotype. ... 98
Figure 3.14 Correlation studies between cancer invasiveness (N) and antigen expression. In A) increase in CD15s (sLex) expression (extension x intensity) is correlated with significant (*)
increase of cellular invasiveness (N>1). Equally, in B) increase in Ley extension in expression is
significantly (**) correlated with a more malignant phenotype, in agreement with the aforementioned staging results. ... 98
Figure 3.15 Crosstab correlation between antigen expression and percentage of ganglion metastasis. In A) HECA-452 signal, which recognize sLex/a, is associated with an increase of
xxi 62.1% of the cases. Chi-square tested confirmed significance of the test with A) p=0.03 (*) and B) p=0.013 (**)... 99
Figure 3.16 8-years overall patient survival. Expression of CD15 increase chances of OS with a significance of p=0.013 (**) ... 100
Figure 3.17 Example of scratch wound assay performed with SW620 wt cell lines. The cells are positive for sLe antigens but have low expression of CD44 SW620 shows a most fully closure at the 7th day, while wounds maintained with anti-CD15s show delayed in stability. CD44 being mostly not expressed by the SW620, show similar closure to the negative control ... 101
Figure 3.18 Comparison of wound closure of LS174T, SW48 and SW620, co-cultured with anti-mouse II (Ctrl-), anti-CD15s (sLex) and anti-CD44-hpan (CD44). Antibodies were maintained in
motion at 0.5µg/mL, until full wound closure or cell death. In A) LS174T, high in sLe and CD44, at the 4th day show almost no closure compare to the negative control. In B) SW48 medium-low in sLex/a and CD44, show clear delay in closure after the 8th day. In C) SW620, low in sLe, has a
delayed wound repair, compared not only to the negative control, but also to the samples co-cultured with anti-CD44. In fact, this antibody appears not to affect cell migration when CD44 is mostly absent from cell expression... 102
Figure 3.19 Preliminary results of wound closure of LS174T co-cultured with anti-mouse II (Ctrl-),
anti-CA19.9 (sLea) and E-selectin-Ig (sLea/x) antibodies were maintained in motion at 0.5µg/mL,
until full wound closure or cell death. In A) LS174T, high in sLe, at the 4th day show almost no closure compare to the negative control. In B) LS174T co-cultured with E-selectin --Ig revealed proportional increase in wound distance, suggesting an active role of E-selectin in blocking cell migration. ... 103
Figure 3.20 Representative funnelling structure for antigen selection. In yellow are represented the different aberrant cancer-related glycans, in blue the glycoproteins involved in cancer profiling. CRC cells were tested by flow cytometry, western blot, immunohistochemistry and wound scratch assay. SLex/a and CD44 have been selected as the most promising biomarkers
involved throughout different cancer stages. ... 104
Figure 3.21 Schematic representation of immunoprecipitation (IP) technique. The different steps are described in figure. Final sample is recovered with glycine-low pH where both antibody and desired protein precipitate. In the final sample, pH is balanced by Tris-base solution at pH6.8 105
Figure 3.22 Example of IP results for HT29 FUT6 membrane protein extract. In A) precipitate with anti-CD44-hpan revealed two major bands in ~135kDa. IP flow through shows did not occur that recovery of all CD44 proteins. In B) E-selectin IP revealed two major bands at ~135kDa and a minor at ~100 kDa. ... 105
xxii
Figure 3.23 LC-MS/MS of LS174T and HT29FUT6 membrane protein E-selectin-Ig IP. In A) gel separation of the protein and division in 7 bands. In B) confidence of 100% CD44 human. Backbone of 82kDa. In C) correspondent sequence of peptides confidence. ... 106
Figure 3.24 Validation of CD44 IP as E-selectin ligand. In A) blot is stained with E-selectin Ig, and both CD44 IP and E-selectin-Ig IP presents signal at ~135 kDa. E-selectin-Ig IP has been used as a positive control. In B) qualitative signal intensity has been measured by imageJ. 135 kDa bands in IP CD44 and IP E-selectin, show similar intensity percentage... 107
Figure 3.25 ELISA testing of CD44 IP. Although weak signal is revealed in the positive control (anti-CD44-pan), positive signal for HECA-452 (sLex/a) is shown. Negative controls, respectively II
anti-mouse-HRP IgG for anti-CD44 and II anti-rat-HRP IgM, already subtracted from the absorbance intensity. ... 107
Figure 3.26 FRET representation between sLewis antigens and CD44 on LS174T cell line. In A) sLex
donor-PE signal remained equal, while substantial increase is seen in CD44 Cy5-acceptor, suggesting presence of sLex on protein surface. In B) CD44-PE (donor) and sLea-PE (acceptor),
showed increase in MFI PE-acceptor channel, indicating presence of sLea on the glycoprotein. MFI
is normalized. ... 108
Figure 3.27 PNGase treatment of E-selectin-Ig IP from HT29 FUT6. In A) blot is stained with anti-CD44-hpan and is possible to visualize a drop in signal and molecular weight from ~150 kDa to ~120 kDa. In B) twin blot is stained with E-selectin-Ig and lost in signal is visible, confirming the correct enzymatic reaction. In C) relative quantification of CD44 signal is visible. Drop in intensity may be due to loss of glycosylation and thus antibody affinity. ... 109
Figure 3.28 Sialidase treatment of E-selectin-Ig IP from HT29 FUT6. In A) blot is stained with anti-CD44-hpan and is possible to increase in signal intensity. In B) twin blot is stained with E-selectin-Ig and decrease in signal is visible. In C) relative quantification of CD44 signal is showed. Increase in intensity may be due to loss of glycosylation and thus antibody affinity. ... 110
Figure 3.29 Testing of LS174T supernatant for CD44 as soluble protein. Increase of supernatant concentration, correspond to a proportional increase in signal, correspondent to same molecular weight of the bands used as a control of total membrane protein LS174T. Bands are revealed at ~150 kDa and ~100 kDa. ... 111
Figure 3.30Schematic representation of mice antigen immunizations. In A) CD44 IP of LS174T was run in native gel 8% in order to separate the protein from the antibody anti-CD44-hpan, co-precipitated. western blot revelation was needed for identification of the correct band containing CD44. samples in polyacrylamide, diluted in PBS 1x, were directly injected in the mice, afterwards named miceCD44. in B) direct injection of LS174T total membrane lysate in the mice. antigen was
selected based on the high expression of sLex/a glycans on Ls174T membrane. mice after
xxiii
Figure 3.31 Timeline representing the different injections performed on mice during the immunization protocol. Two parallel protocols were performed with CD44 (A) or total membrane protein LS174T cells (B). Mice were immunized with CD44 extracted from LS174T mixed with polyacrylamide and adjuvants or immunized with total membrane extraction protein from LS174T. ... 113
Figure 3.32 Results of mice serum tested for reactivity against CRC cell lysates. The presence of antibody titres of mouse sera was tested against the antigens coated and evaluated by ELISA. During the immunization three mouse groups were tested: Mice- (control mice with no
immunization), MiceCD44 obtained from the mice immunized with CD44 extracted from LS174T
cell line, and MiceLS174T immunized with LS174T total membrane protein. The coating was
performed with LS174T (high in CD44 and E Selectin ligands), HT29 FUT6 (high in CD44) and SW620 wt (negative for CD44). During the different immunizations a high affinity for sera of MiceCD44 with HT29FUt6 and high signals with MiceLS17T were detected for the three coatings.
Mice were sacrificed after the 5th immunization. In A) serum check at day 30; in B) serum check
at day 60; in C) serum check at day 75; in D) serum check at day 90 and sacrifice ... 115
Figure 3.33 ELISA testing of miceLS174T on E-selectin IP of LS174T cell line. Signal show positive
reactivity against LS174T total membrane lysate, protein flow through and IP, suggesting presence of polyclonal specificity and aspecificity for E-selectin ligands. mice were sacrificed in order to detect monoclonal specific for E-selectin ligands. ... 116
Figure 3.34 representation of flowcytometry analysis of HT29 FUT6 and LS174T cell lines by serum of miceLS174T/CD44. In A) relative MFI have been plotted and shows positive reactivity by miceLS174T,
but no visible staining was noted by serum of miceCD44. In B) flow cytometry histogram
representation of difference in signal intensity by serum of miceLS174T/CD44. only polyclonal serum
of miceLS174T shows partial binding. ... 117
Figure 3.35 Dot blot of miceCD44 against different concentration of total membrane protein
(1.5/3/6 µg/µL) of: LS174T (high expression of CD44 and sLex), SW620wt (not expressing CD44)
and HT29 FUT6 (high expression of CD44). Dot-blot showed proportional reactivity for LS174T and HT29 FUT6, with increase of signal in LS174T samples. ... 118
Figure 3.36 testing of 5 different clones obtained from miceCD44hybridoma fusion. The clones have
been tested against LS174T (high in CD44 and E selectin ligand) and SW948 (low in CD44 and moderate in E-selectin ligands by ELISA). the wells were coated either by total membrane lysate (5 µg/mL) or with 90% confluency live cells. Membrane lysate were blocked 1% BSA; no blocking was performed on live cells. Results show higher binding of CD44.4 in LS174T and CD44.5 in SW948 live cells. ... 120
Figure 3.37 testing of the 10 more stable clones against membrane protein lysates and commercial sLex/a/. In A) cell membrane lysates LS174T (high expression of CD44 and sLex), HT29
xxiv
FUT6 (high expression of CD44), SW948 (low in CD44 and moderate in E-selectin ligands) and SW620wt (not expressing CD44) have been tested. Clones 2.15, 2.17, 2.24, 3.3, 3.5 show higher signal on LS174T membrane lysate coating rather the almost absent binding with the other cell lines. In B) clones 2.3, 2.4, 2.14, 2.15, 3.3, 3.5 clones displayed binding with sLex and sLea. ... 121
Figure 3.38 Expansion in vitro of the selected clones: 2.15, 2.17, 2.24, 3.3, 3.5 positive for LS174T and .3, 2.4, 2.14, 2.15, 3.3, 3.5 positive for sLex/a. In A) cell membrane lysates LS174T (high
expression of CD44 and sLex), HT29 FUT6 (high expression of CD44), SW948 (low in CD44 and
moderate in E-selectin ligands) and SW620wt (not expressing CD44) have been tested. clones 2.17, 2.24, 3.3 displayed specificity for LS174T. 3.5 show binding for HT29 FUT6. In B) only 2.3 clone show binding for sLex. In C) no clone show affinity for CD44 36kDa recombinant compared
to the control used with anti-CD44-hpan. ... 122
Figure 3.39 testing of the serum of miceCD44-2 generation. On the left, cell membrane lysates
LS174T (high expression of CD44 and sLex), HT29 FUT6 (high expression of CD44), SW948 (low in
CD44 and moderate in E-selectin ligands) and SW620wt (not expressing CD44) have been tested. Proportional binding of the serum is matching with CD44 expression in each cell lines. Morover, negative control miceCTRL serum shows no binding. On the right, serumt show intense binding with
sLex and higher forsLea. Negative control miceCTRL serum shows no binding ... 123
Figure 3.40 Testing of clones obtained from miceCD44 -generation 2- towards CD44 and sLex/a. In
A) clone 2C2 show positive reaction for CD44 human recombinant (36 kDa) and clone 2B1 for LS174T (high in CD44 [82kDa in the no glycosylated form]). In B) almost no recognition of sLex/a is
showed. ... 124
Figure 3.41 ELISA assay for 2B1 and 2C2 clones, against all the antigens previously tested. 2B1 shows recognition of LS174T, sLex/a and CD44 recombinant (36kDa). Clone 2C2, show minor
binding for sLex and CD44 recombinant. 2B1have been selected for further characterization . 125
Figure 3.42 testing of serum obtained from miceLS174Thybridoma fusion. The serum has been
tested against LS174T (moderate in CEA, high in CD44 and E selectin ligand) and SW948 (high in CEA, low in CD44 and moderate in E-selectin ligands by ELISA). The wells were coated either with total membrane lysate (5 µg/mL) or with 90% confluency live cells. Membrane lysate were blocked 1% BSA; no blocking was performed on live cells. Results show serum recognition of LS174T cell membrane lysate as well as live cell of LS174T and SW948... 126
Figure 3.43 The serum of miceLS174T series testing affinity for specific glycosylation. HECA-452 is
used as positive control and miceCTRL as negative for sLex/a and sialic acid. In A) both reactions
show proportional reduction in signal intensity, suggesting the presence of specific antibodies against sLex/a and/or sialic acid. In B) miceLS174T serum displayed highest intensity signal for BSM,
xxv
Figure 3.44 ELISA testing of the 30 clones obtained from thefusion of miceLS174T. In A) clone 23
followed by weaker signals of clones 2, 29, 30 show high binding of LS174T (high expression of sLex/a), HT29 FUT6 (moderate expression of sLex/a), SW948 (low/moderate in E-selectin ligands)
and low signals against SW620wt (moderate expression of sLex/a). In B) clone 13 depicted intense
binding of sLex/a. weaker signals of clones 5,23,25, 28 show binding for sLea. In C) clone 23 show
preferential binding for BSM rather than PSM. weaker binding is also displayed by clones 2, 29,30. In D) CEA binding with clone 23 is visible. weaker signals are also obtained with clones 29 and 30. ... 128
Figure 3.45 ELISA testing of the clones obtained from the 2nd cloning of clones 13 and 23 of
miceLS174T. In A) clone 23.2 and 23.11 depicted moderate binding against LS174T (high expression
of sLex/a), HT29 FUT6 (moderate expression of sLex/a), SW948 (low/moderate in E-selectin ligands)
and no signals against SW620wt (moderate expression of sLex/a). In B) clone 23. 3, 23.29, 23.30
13 depicted low binding of sLex/a. In C) almost no clone binding for BSM rather than PSM. In D)
CEA binding with clone 13.29. ... 130
Figure 3.46ELISA testing of the clones obtained from the 3rd cloning of clones23.2 and 23.11 of
miceLS174T. In A) clone 2/3A4 and 2/3A1 show highest binding against LS174T (high expression of
sLex/a), HT29 FUT6 (moderate expression of sLex/a), SW948 (low/moderate in E-selectin ligands)
and SW620wt (moderate expression of sLex/a). In B) 2/3A4 and 2/3A1 depicted the highest
binding of sLex/a. In C) almost all clones show preference in binding of PSM rather than BSM.
2/3A4 and 2/3A1 depicted the highest binding In D) CD44 and CEA are recognized by most of clones, however 2/3A4 and 2/3A1 depicted the highest binding of CD44 and CEA ... 132
Figure 3.47 Flow cytometry staining of the depicted clones 23.2/ 2A4 and 23.2/ 3A1. In A) clones were tested against HT29 wt (negative control), HT29 FUT6 and LS174T. Flow cytometry intensity are represented. Only clone 3A1 show staining with HT29 FUT6. In B) histogram MFI intensity of clone 3A1, shows only binding for HT29 FUT6 cell line. ... 133
Figure 3.48 LS174T expression variability, confluency dependent. In A) comparing of CD44 and HECA-452 signals, showing a substantial increase in CD44 expression and decrease in sLex/a
antigens from 20%-100% confluency. In B) sLex, Lex, sLea, sTn and Tn antigen were tested.
separated analysis of sLex and a confirm decreasing in expression from 20%, previously reported
with HECA-452 antibody. no signal of sTn nor Tn has been observed. ... 135
Figure 3.49 SW948 expression variability, confluency dependent. In A) comparing MFI at different confluency of CD44 do not show particular changes in expression. In B) sLex, Lex, sLea, sTn and Tn
antigen were tested. Lea confirm higher stable expression, as in sLex/a. Signal of sTn nor Tn appear
xxvi
Figure 3.50 IC50 of 5FU concentrations on SW620 wt, mock and FUT6 Results show that SW620 FUT6 (thus higher expressing sLex) has half maximal inhibitory concentration (IC50) of ~50% less
when compared to the wt and mock (low in sLex). ... 139
Figure 3.51 screening of cell lines SW948 mock and ST6GAL1 and HT29 mock and FUT6, before and after luciferase transduction. ... 140
xxvii
Abbreviations
A AA Adenomatous polyps 5-FU 5-fluorouracile Ab AntibodyADCC Antibody-dependent cell-mediated cytotoxicity
AE1/AE3 Anti-cytokeratin
Akt/PKB Protein kinase B
APC Adenomatous polyposis coli
APS Ammonium persulfate
ATP Adenosine triphosphate
B Bcl-2 B cell lymphoma 2
BEAMing Beads, Emulsion, Amplification and Magnetics
BFB Chromosomal
breakage-fusion-bridge
BSA Bovine serum albumin
BSM Bovine submaxillary mucin
C C1GALT1 Β1,3-galactosyltransferase
CA Carbohydrate antigen
CAFs Cancer-associated fibroblasts
CAM Cell-cell adhesion proteins
CAR Chimeric antigen receptor
CD Cluster of differentiation
CDC Complement dependent cytotoxicity
CDK Cyclin-dependent kinase
cDNA Complementary Deoxyribonucleic acid
CDRs Complementarity-determining regions
CEA Carcinoembryonic antigen
cfDNA Cell free DNA
CIMP Cpg island methylator phenotype
circRNAs Circular RNA
CMS Consensus molecular subtypes
COX2 Cyclooxygenase 2
CRC Colorectal cancer
CSCs Cancer stem cells cancer
CT Computed tomography
CTCs Circulating tumour cells
CTL Cytotoxic T lymphocytes
D
DAB 3,3’-diaminobenzidine
DCBE Double contrast barium enema
DDR DNA damage response
DMSO Dimethyl sulfoxide
E E-Ig E-selectin-Ig
EBV Epstein-barr virus
ECM Extracellular matrix
EGF Epidermal growth factor
EGF-R Epidermal growth factor receptor
ELISA Enzyme-linked immunosorbent assay
EMT Epithelial to mesenchymal transition
EpCAM Epithelial cell adhesion marker
Eph Ephrins
ER Endoplasmic reticulum
F
FAK Focal adhesion kinase
FAP Familial adenomatous polyposis
FBS Fetal bovine serum
FC Flow cytometry
FFPE Formalin-fixed, paraffin embedded
FGF Fibroblast growth factor
FIT Immunochemical faecal occult blood
test
FL-DNA Fluorescent long DNA
xxviii
FRET Förster resonance energy transfer
FSC Forward scatter
Fuc-TVIII Fucosyltransferases 8
FUT Fucosyltransferases
G
G6PD Glucose-6-phosphate dehydrogenase
GADPH Glyceraldehyde 3-phosphate dehydrogenase
GalNAc N-acetylgalactosamine
GALNT1 N-acetylgalactosaminyltransferases 1
GalT Galactosyltransferase
GBPs Glycan binding proteins
GF Growth signals
GlcNAc N-acetylglucosamine
GlcNAcTs Acetylglucosaminyltransferases
GLUT1 Glucose transporters-1 and 3
GnTs N-acetylglucosaminyltransferase
GS Growth signals
H
HAMA Human antibody anti-mouse antibodies
HAT
Hypoxanthine-aminopterin-thymidine
HBP Hexosamine biosynthetic pathway
HDI Human development index
HER2 Human epidermal growth factor receptor 2
HGPRT Hypoxanthine-guanine-phosphoribosyl transferase
HIF-1α Hypoxia-inducible factor 1- α
HNPCC Hereditary nonpolyposis
HS Heperan sulfate
I
Ig Immunoglobulin
IGF-1 Insulin-like growth factors
IGF-1R Insulin-like growth factor 1 receptor
IgG Immunoglobulin G
IHC Immunohistochemistry
IP Immunoprecipitation
L LacNAc N-acetyllactosamine
LC-ESI-MS/MS Liquid chromatography – electrospray ionization - tandem mass spectrometry
LKB1 Liver kinase B1
LTR Truncated long-terminal residues
M
M2-PK Pyruvate kinase isoenzyme 2
mAb Monoclonal antibody
MAPK Mitogen-activated protein kinase
mCRC CRC with metastasis
MDSCs Myeloid-derived suppressor cells
MET Epithelial transition
MFI Median fluorescence intensity
miRNA Micro RNA
MMPs Matrix metalloproteinases
mRNA Messenger RNA
MS Mass spectrometry
MSI-H Microsatellite instability
MSS Microsatellite stability MTT 3-(4,5-Dimethylthiazol-2-yl-2,5-Diphenyltetrazolium Bromide) MUC Mucins N NCD Noncommunicable disease
NeuAc N-acetylneuraminic acids
NeuGc N-glycolylneuraminic acid
NK Natural killer
O
OGA O-glucanase
OS Overall survival
PBS Phosphate buffered saline
xxix
P
PD-1 Programmed death-1 receptor
PDGF Platelet-derived growth factor
PEG Polyethylene glycol
PFA Paraformaldehyde
PFK1 The phosphofructokinase 1
PFS Progression-free survival
PI3 Phosphoinositide 3-kinase
PIP3 Phosphatidylinositol (3,4,5) trisphosphate
PLA In situ proximity ligation assay
PPP Pentose phosphate pathway
pRb Retinoblastoma protein
PVDF Polyvinylidene fluoride
R
R0 Tumour mass resection
RLB Reporter lysis buffer
RNA Ribonucleic acid
ROS Reactive oxygen species
RT Room temperature
S
scFv Single-chain variable fragment
sDNA DNA in stools
SDS Sodium dodecyl sulfate
SDS-PAGE Sodium dodecyl sulfate –
polyacrylamide gel electrophoreses
SLex/a Sialyl-Lewisx/a
SSC Side scatter
ST And sialyltransferase
ST3Gal-Ts Α2,3-sialyltransferases
ST6Gal-I Α-galactoside α-2,6-sialyltransferase I
STRs Polymorphic short tandem repeat loci
T
T- Thomsen–Friedreich antigen
TACAs Tumour-associated carbohydrate antigens
TBST Tris-buffered saline- tween
TE Trypsin-EDTA
TEMED Tetramethylethylenediamine
TERT Telomerase reverse transcriptase
TFH T follicular helper
TGF a Tumour growth factor a
TGFß Transforming growth factor ß
TIMPs Tissue inhibitor metalloproteinases
TME Tumour microenvironment
Tn- Thomsen-nuovelle antigen
Tregs Regulatory T cells
TSA Total sialic acid
TSP-1 Trombospondin-1
V
VEGF Vascular endothelial growth factor
VSV-G Virus G envelope glycoprotein gene
W
WB Western blot
WHO World health organization
α α-KG Α-keto-glutarate
Funding Institution
1
1.1. Cancer
Cancer, also defined as noncommunicable disease, is the leading cause of the death worldwide. Thoroughly, it is the 1st or 2nd leading cause of death worldwide before the age of 70, in 91 of 172 countries1. In the western countries, cancer premature mortality remains the highest, regardless the greatest advances in laboratory and clinical studies (Figure 1.1). The need for new strategic approaches, for the creation of personalized therapy, is driving the formation of a multidisciplinary environment and specialist cancer centres, with the mission to improve diagnostic, prognostic and therapeutic tools.
1.1.1 Epidemiology and statistics
Understanding cancer trends and statistics has become fundamental to comprehend pattern and, eventually, causes in cancer increase. Epidemiology programs are crucial for monitoring clinical data, projects and activities. Yet, collection of data worldwide is still requiring standardization of the process. At the date, each country provides their own data to the world health organization (WHO) and no unification of data was provided worldwide up to 20122.
Figure 1.1 Global map ranking of cancer premature mortality worldwide up to 70 years, in 2015. The number of countries is included in the legend. Project GLOBOCAN 2018, adapted from World Health Organization (WHO)
2
For this reason, great efforts have been put in the collecting and re-organizing of statistical data, concerning cancer.
Worth of consideration are thus the projects, GLOBOCAN and CONCORD-2. GLOBOCAN is an interactive web platform presenting incidence of mortality and prevalence of 36 types of cancers in 185 countries in the world; CONCORD-2 aims to register all cancer survival analysis of population-based registry data1,3.
GLOBOCAN estimations declare that cancer incidence and mortality are rapidly growing worldwide with 18.1 new million cases with 9.6 million cancer deaths, in 2018, compared to the 14.1 cases of 2012, with 8.2 million deaths1.
Major causes of cancer have been associated with aging, growth of population and, especially, socioeconomic development, defined using the human development index (HDI)1. HDI is a significant variable that considers the importance of national policy, in economic growth, in influencing development outcomes. Low-HDI are associated to developing countries and high-HDI to developed ones. Analysis of the variable high-HDI on cancer data, confirmed that cancer incidence in high-HDI countries is 2-or 3- folds superior compared to low-HDI, but differences in mortality remain smaller, due to higher mortality chances in low HDI countries. Change in trends shows that low-HDI countries present increasing substitution of what-so-defined “poverty-related”/”infectious-related cancer” with cancer types ascribed to the westernization kind of life4,5. As a result, lung cancer remains the most diagnosed (11.6%) and the deadliest (18.4%) kind of cancer in both sexes worldwide, followed by breast (11.6%) and colorectal (10.2%), which however jumps on the second place as mortality cause with 9.2%1.
These data suggest not only an improve in diagnostic and treatment in low-HDI, but also a homogenization of lifestyle worldwide.
3
1.2. Heterogeneity
Cancer is a dynamic disease and various changes can happen during tumour development. As a consequence, the tumour mass is often the result of a diverse collection of cells harbouring distinct molecular signatures with differential levels of sensitivity to treatment6. Thus, heterogeneity plays a major role in making cancer a major deadly disease.
In the last 20 years, many studies have been focused in investigating the genesis of the heterogeneity and whether, it is the cause of cancer formation rather than a by-product of tumour progression. Hence, understanding the processes involved in transforming a normal cell into a malignant one could be the key for the creation of personalized diagnostic, prognostic and therapeutic tools. Here will be highlighted the tumour microenvironment and the hallmarks of cancer.
1.2.1 The tumour microenvironment
Cancer cells, through upregulation of oncogenes and downregulation of tumour suppressor, are the responsible entities of tumour initiation and progression. Different cells types are involved in cancer formation, transformation and malignancy and it is important to comprehend the contribution of each one of them in malignancy transformation. However, the great heterogeneity among same cancer types hardly explain so many sub-clonal populations. The personalized treatment and drug targeting are based into the recognition of crucial pathways and molecule recognition and it would not be possible without in-depth knowledge of the tumour microenvironment (TME).
Subsequently, the biology of a tumour can only be understood by studying the individual specialized cell types within it and their different behaviour7.
I. Endothelial cells are the most studied class of cells in tumour environment: near the
stroma is where the most heterogeneity is presented, and they are the cells responsible of tumour-associated vasculature. Many signalling pathways have been discovered responsible of their proliferation and differentiation among which Notch8, Neuropilin9, Robo10, Ephrin A/B11, Vascular endothelial growth factor (VEGF)12, angiopoietin13 and
Fibroblast growth factor (FGF)14 signals. Most of the immunotherapies nowadays are
4
II. Pericytes are mesenchymal type cells wrapped around the endothelial tubing of blood
vessels and responsible in maintenance of a quiescent endothelium. They collaborate with endothelial cells to produce the vascular endothelial membrane, important for holding the blood pressure.
Interestingly, it has been shown that the therapeutic inhibition of platelet-derived growth factor (PDGF) receptor expressed by tumour pericytes, affects pericytes and decreases tumour vascularization, while healthy pericytes are not affected by the therapy15.
III. Cancer Stem Cells (CSCs) present in most of the tumours, may origin in different
phases of cell development. They might be the cell-of-origin or a cell in a proliferative state, that undergo in tumour progression. In any case, multiple distinct classes of increasingly neoplastic stem cells form during cancer progression with their self-renewal and tumour-initiating capabilities7. Their phenotypic plasticity can be the cause of such cellular variety in TME. As example, CSC can initiate a epithelial to mesenchymal transition (EMT), and be differentiated into mesenchymal, fibroblast-like cancer cells, behaving as cancer-associated fibroblasts (CAFs)16,17. CSCs are also chemotherapy resistant and they might be the reason of tumour recurrence after treatment. They may undergo a dormancy program, where tumour cells persist and suddenly erupts after years16.
IV. Stem and progenitor cells of the tumour stroma can be recruited by the surrounding
healthy tissue, but the bone marrow has also been identified as a key source. Some of the recruited cells from the bone marrow can persist in a partially-differentiate status exhibiting different function form the fully differentiate ones18.
V. Cancer-associated fibroblast creates the support for the epithelial tissue.
Reprogrammed variants of normal tissue-derived fibroblastic cells can enhance cancer cell proliferation, angiogenesis, and invasion and metastasis19.
VI. Immune inflammatory cells are the most diverse type of cells in TME. They have
shown a dual role of tumour antagonizing and tumour promoter, depending on which type of immune cells infiltrates the cancer mass. Cytotoxic T lymphocytes (CTLs) and natural killer (NK) cells are associated with tumour antagonizing abilities while macrophage subtypes, mast cells, and neutrophils, as well as T and B lymphocytes are proven to be tumour promoters20,21. They can release into the TME pro-tumour factors, such as epidermal growth factor (EGF), VEGF, FGF2, matrix-degrading enzymes and chemokines22.
5
1.2.2 Cancer evolution and Hallmarks of cancer
Several theories have been proposed to explain cancer complexity and heterogeneity.
In model of clonal evolution, sub sequential acquisition of genetic mutations and functions alterations, leads to a selection of sub-clones capable of co-existing in an altered tumour micro-environment23. However, as depicted by Fouad et al. (2017), the clonal evolution theory is not
able to explain why the alterations are undertaken in the first place24.
In the model of stem cells, proposed by Tomasetti and Vogelstein (2015), is stated that only a minor number of cells, with self-renewable capacity, is capable of initiating and progressing tumour status25. These tumour cells have specific surface proteins (CD133, CD166, or CD44) and after chemotherapy have been shown to be more resistant, explaining relapse following treatments26.
A third theory by Sottoriva et al. (2015), the big bang model, sustain that the fundamental mutations, happens early in cancer development, thus explaining why some tumour might overgrow without presenting metastasis and other small tumours present metastasis at early phases27.
These three theories can be considered complementary one to each other and there is no doubt that the comprehension of tumour cell origin and heterogeneity is the key for cancer diagnosis and treatment.
Subsequently, among these theories Hanahan and Weinberg (2000) followed by update in 2011, proposed a new model, called the hallmarks of cancer 7,28.
In their claim, cancer cells must go through 10 different transformation to form a malignant environment: they sustain that the passage from a normal to a malignant cell is the result of accumulation of defective traits, in a continuous evolution of the TME (Figure 1.2).
In this sense, their theory has common points with the previously proposed clonal evolution. The hallmarks of cancers have represented the first big step towards cancer understanding and personalized therapy. Presently, being aware of how genetic and epigenetic alterations are associated with specific hallmarks of cancer, authors are completing the proposed model by correlating behaviour of different molecules, useful for diagnosis or treatment (i.e. miRNA29, targeted drug delivery30, the CRISPR generation31 and glycosylation32,33).