Maximum Power Point Tracker Applied in Batteries
Charging with PV Panels
José António Barros Vieira1, Alexandre Manuel Mota2
1
Escola Superior de Tecnologia de Castelo Branco,
Departamento de Engenharia Electrotécnica, Av. Empresário, 6000 Castelo Branco, Portugal, Tel: +351 272 330300, Email: [email protected]
2
Universidade de Aveiro, Departamento de Electrónica Telecomunicações e Informática, 3810 Aveiro, Portugal, Tel: +351 234 370383, Email: [email protected]
Abstract —This work deals with the design and a prototype implementation of a real time maximum power point tracker (MPPT) for photovoltaic (PV) panel aiming to improve energy conversion efficiency. This MPPT algorithm is integrated in the charging process of lead-acid batteries making an autonomous system that can be used to feed any autonomous application.
The photovoltaic system exhibits a non-linear i-v characteristic and its maximum power point varies with solar insolation and temperature. To control the maximum transfer power from a PV panel the Perturbation and Observation (P&O) MPPT algorithm is executed by a simple microcontroller ATMEL ATTINY861V using the PV voltage and current information and controlling the duty cycle of a pulse width modulation (PWM) signal applied in to a DC/DC converter. The schematic and design of the single-ended primary inductance converter (SEPIC) is presented. This DC/DC converter is chosen because the input voltage can be higher or lower than the output voltage witch presents obvious design advantages.
With the P&O MPPT algorithm implemented and executed by the microcontroller, the different charging stages of a lead-acid battery are showed and executed. Finally, experimental results of the performance of the designed P&O MPPT algorithm are presented and compared with the results achieved with the direct connection of the PV panel to the battery.
I. INTRODUCTION
Recently, the concern for environmental issue has been rising in the world such as global warming by exhausting carbon dioxide (CO2) and breaking of ozone layer by freon gas. On December 1997, during the Kyoto Conference on Climate Change (COP3) it was agreed that by the year 2012 the developed countries would reduce at least 5% of the green house gases compared with year 1990 [1]. Moreover, the global energy shortage and the need for sustainable energy systems enforce the development of power supply structures that are based mainly on renewable resources.
Photovoltaic (PV) system is gaining increased importance as a renewable source due to advantages such as the absence of fuel cost, little maintenance and no noise and wear due to absence of moving parts. But there are still two principal barriers to the use of photovoltaic systems: the high installation cost and the low energy conversion efficiency.
A PV panel is a non-linear power source, i.e. its output current/power depends on the terminal operating voltage and the maximum power generated by the system changes with solar radiation and temperature. To increase the ratio output power/cost of installation it is important that PV panel operates in maximum output power (MPP).
This paper will aboard two principal subjects: the MPPT algorithms using a DC/DC converter and the lead-acid batteries charging process. Thus, this work shows the design and the prototype implementation of a MPPT algorithm for photovoltaic system with the objective to improve energy accumulation. This MPPT algorithm is integrated in one of the main stages of the charging process of lead-acid batteries making an autonomous system that can be used to feed any autonomous application. The P&O MPPT algorithm is used to control the maximum transfer power from a PV panel. This algorithm is executed by a microcontroller using the PV voltage and current data to control the duty cycle of a pulse width modulation signal applied in to a DC/DC converter. The schematic and design of the DC/DC converter is explained. The DC/DC converter used is the SEPIC because it easily adapts any PV output voltage to any battery input voltage. This MPPT algorithm is used in one of the two main charging stages of a lead-acid battery. Finally, the two main charging stages of a lead-acid battery are presented and experimental results of the performance of the designed P&O MPPT algorithm are presented and compared with the results achieved with the direct connection of the PV panel to the battery.
One of the most frequently used MPPT methods is the perturbation and observation algorithm, although this algorithm has some converging problems with rapidly insolation changes. This problem can be solved using the solution presented in [2]. In this work, PV voltage and current are measured in the middle of the sampling period, making possible to determine if the verified changes are due to perturbation algorithm or shadows that cover the PV panel.
Another popular MPPT algorithm is the incremental conductance method (IncCond) [3]. The authors developed the incremental conductance MPPT algorithm avoiding the drawbacks of the P&O MPPT algorithm. It is based on the fact
that the derivative of the output power P with respect to the panel voltage V is equal to zero at the maximum power point (MPP). The solar panel's P-V characteristics presented in Fig. 2 show further that the derivative is greater than zero to the left of the MPP and less than zero to the right of the MPP. This algorithm shows that enough information is gathered to determine the relative location of the MPP by measuring only the incremental and instantaneous panel conductance’s dI/dV and I/V, respectively.
In this work the Perturb and Observe MPPT algorithm was chosen, due to its simplicity and to its low computational power needs [4]. This work will also show and explain the different charging stages of a lead-acid battery.
This paper is divided in 8 sections, as follows: section 2 presents the panel characteristics, section 3 presents the DC/DC SEPIC schematic and design, section 4 shows the perturbation and observation maximum power point tracking algorithm. Section 5 presents the algorithm proposed to the different stages of the lead-acid battery charging process, section 6 shows the implemented prototype board, section 7 discuss the experimental results of charging with the P&O MPPT algorithm and with out it ending with the conclusions presented in section 8.
II. SOLAR ARRAY CHARACTERISTICS
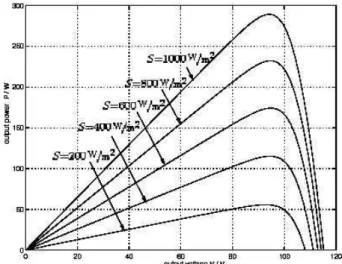
The maximum power point of a solar panel changes in accordance with changes in the solar irradiance and panel temperature. The typical characteristic curves current versus voltage, power versus voltage at different levels of solar irradiation and power versus voltage at different temperatures, are illustrated in Fig. 1, Fig. 2 and Fig.3, respectively.
Fig. 1 illustrates the operating characteristic of the panel under several given solar insolations. It consists of two regions: one is the current source region, and the other is the voltage source region. In the voltage source region, the internal impedance of the panel is low. That region is the right side of the current-voltage curve. The current source region, in which the internal impedance of the panel is high, is at the left side of the current-voltage curve. The MPP of the panel is located at the knee of the current-voltage curve. According to the maximum power transfer theory, the power delivered to the load is maximum when the source internal impedance matches the load impedance.
Thus, the impedance seen from the converter input side (can be adjusted by PWM control signal) needs to match the internal impedance of the panel if the system is required to operate at or near the MPP of the solar array. If the system operates on the voltage source region (namely low impedance region) of panel characteristic curve, the panel terminal voltage will collapse [5].
Fig.1. - I-V characteristics of a photovoltaic panel for various values of irradiance S at a temperature of 25 ºC.
Fig. 3. - P-V characteristics of a photovoltaic panel for various values of temperature T at an irradiance of 1000W/m2.
Fig. 2. - P-V characteristics of a photovoltaic panel for various values of irradiance S at a temperature of 25 ºC.
From Fig. 2 and Fig. 3, it is observed that each curve has a maximum power point (MPP), which is the optimal point for the efficient use of the panel and this point depends of the values of the temperature. The main function of a MPPT is to adjust the panel output voltage to a value which the panel supplies the maximum energy to the load [6]. The applied MPPT algorithm will be explained in section 4.
III. DC/DC SEPIC CONVERTER
To implement the MPPT algorithm it is used the SEPIC (single-ended primary inductance converter). This DC/DC converter is in an increasingly popular topology, particularly in battery powered applications, as the input voltage can be higher or lower than the output voltage which presents obvious design advantages. In this work, for implementation of maximum power point tracker, a SEPIC working in continuous conduction mode is used as the power-processing unit. Switch mosfet M1 the PWM is controlled with switching frequency of 125kHz. The power flow is controlled by adjusting the on/off duty ratio of the switch M1. Fig. 4 shows the schematic of the DC/DC converter implemented.
Using a PV panel with the following characteristics: maximum power Pmax=9.31 W, maximum voltage Vmp=17.4 V, maximum current Imp=0.54 A, open circuit voltage Voc = 21.2 V, curt circuit current Icc=0.66 A, the DC/DC design starts with the selection of the two separate inductors L1 and L2. For a general working point with:
Input voltage (Vin) – 12V – 16V; Output (Vout & Iout) – 12V, 0.6A; Switching frequency (Fs) – 125kHz; Expected efficiency - 90%
First it is need to calculate the duty cycle; D = Vout/(Vout + Vin); The worst case condition for inductor ripple current is at maximum input voltage so; D = 12/(12 + 16) = 0.429;
Calculating the value of L2: V = L di/dt
Where V is the voltage applied to the inductor, L in the inductance, di is the inductor peak to peak ripple current and dt is the duration the voltage is applied for. Hence:
L = V.dt/di
dt = 1/Fs x D dt = 1/(125 x 103) x 0.428 = 3.42 µs V = Vin during the switch ON time so;
L2 = 16 x (3.42 x 10 -6
/0.4) L2 = 136.8 µH
Using the nearest preferred value would lead to the selection of a 150 µH inductor. It is common practice to select the same
value for both input and output inductors in SEPIC designs although when two separate parts are being used it is not essential.
Having selected the inductance value we now need to calculate the required RMS and peak current ratings for both inductors. For input inductor L1:
Irms = (Vout x Iout)/(Vin (min) * efficiency) Irms = (12 x 0.6)/(12 x 0.9) = 0.667A Ipeak = Irms + (0.5 x Iripple)
Although worst case ripple current is at maximum input voltage the peak current is normally highest at the minimum input voltage.
Iripple = (V.dt)/L
Iripple = (12 x 3.42 x 10-6)/ 150 x 10-6 = 0.27A Ipeak = 0.667 + 0.135 =0.804A
So a 150µH, 0.667Arms and 0.804Apk rated inductor is required. For the output inductor L2:
Irms = Iout = 0.6A
Iripple = (16 x 3.42 x 10-6)/ 150 x 10-6 = 0.365A Ipeak = 0.6 + 0.182 = 0.782A
So a 150µH, 0.6Arms and 0.782Apk rated inductor is required.
Finally, the SEPIC components used are: L1 = 150µH L2 = 150µH with Isat = 2.0A because if Vin = 6V Irms will be near to the double of the calculated current for Vin = 12V, C1 = 47 µF, C2 = 47µF, C3 = 47µF, M1 of Imax = 2.0A and a shotkhy diode D1 of Imax 2.0A.
IV. THE P&O MAXIMUM POWER POINT TRACKING ALGORITHM
The P&O is one of the so called ‘hill-climbing’ methods, which are based on the fact that in case of the V-P characteristic, on the left of the MPP the variation of the power against voltage dP/dV > 0, while at the right, dP/dV <0 Fig. 2 [7].
In Fig. 2, if the operating voltage of the PV panel is perturbed in a given direction and dP/dV > 0, it is known that the perturbation moved the panel's operating point toward the MPP. The P&O algorithm would then continue to perturb the PV panel voltage in the same direction. If dP/dV < 0, then the change in operating point moved the PV panel away from the MPP, and the P&O algorithm reverses the direction of the perturbation [8].
The main advantage of the P&O method is that it is easy to implement, and its low computational demand. However, it has some limitations, like oscillations around the MPP in steady state operation, slow response speed, and tracking in wrong way under rapidly changing atmospheric conditions. [8][9][10].
To reduce the presented limitations it will be useful to use a small sampling rate. In this work it was used a sampling rate of 100 ms.
Using the SEPIC with current and voltage resistance sensors illustrated in Fig. 5, the P&O MPPT algorithm was implemented. The MPPT algorithm needs only the PV voltage Fig. 4. - SEPIC DC/DC converter circuit.
and current information, the battery voltage and current information will be needed for the battery charging process.
R0=R5=0.01Ω and R1=R3=910kΩ R2=R4=150kΩ
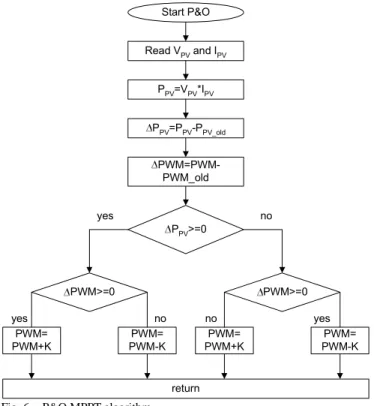
The flow chart of the P&O MPPT implemented algorithm is illustrated in Fig. 6.
The parameter K is the step given to the PWM signal. This parameter can vary depending of the working point of the DC/DC converter, linear or no linear region.
The MPPT control circuit is implemented in a microcontroller ATTINY861V, that has ten 10-bits analog-to-digital (A/D) converters and two fast PWM mode signals. The control circuit compares the PV output power before and after a change in the duty ratio of the DC/DC converter control signal. It is expected that the MPP presents a constant oscillation inherent to the algorithm.
V. BATTERY CHARGING ALGORITHM
The complete battery charging demands to the controller a complex control strategy, in witch it would be possible to charge the battery, between its limits, in the faster possible way thus daily period of energy generation of the PV panel is limited [11].
To achieve a fast, safe and complete battery lead-acid charging process, some of the manufacturers recommend dividing the charging process in four stages that are designated by: (i) trickle charge, (ii) bulk charge, (iii) over charge and (iv) float charge [12] and [13]. Fig. 7 show the curves of current and voltage applied to the battery during the charging process.
A. 1º Stage (from T0 to T1) – Trickle Charge
This first stage appears when the battery voltage is below the value VCHGENB, This voltage value, specified for the manufacturers, shows that the battery arrives at its critical discharge capacity. In this condition the battery should receive a small charge current defined by ITC that has a typical value of C/100 where C is the normal battery capacity with a 10 hours charging process. This small current ITC is applied until the battery voltage reaches the value of VCHGENB. This stage also avoids that some accident could happens in the case of the one battery element is in curt circuit, therefore if this really happens the battery voltage will not grow and then the battery charging process does not pass for the next stage.
B. 2º Stage (from T1 to T2) – Bulk Charge
After the battery voltage reaches the value VCHGENB will be delivered to the battery a constant current IBULK. The IBULK is the maximum charge current that battery supports with out a big water losing, and its value is specified by the manufacturers. This current is applied until the battery voltage reaches the maximum value of over charge voltage, defined by VOC, and specified by the manufacturers.
C. 3º Stage (from T2 to T3) – Over Charge
During this stage the control algorithm should regulate the battery voltage in the VOC for the complete charge has been reached. When the charging current fall down to a pre-established value IOTC and the voltage stays in the value VOC, the next stage will be executed. The value of IOCT is around 10% of the IBULK.
Fig. 7. - Current and voltage curves in the four stages of battery charging.
Start P&O Read VPV and IPV PPV=VPV*IPV PWM>=0 PWM= PWM-K return yes no no yes PWM>=0 PPV>=0 PWM= PWM+K PWM= PWM+K PWM= PWM-K yes no PPV=PPV-PPV_old PWM=PWM-PWM_old
Fig. 6. - P&O MPPT algorithm.
Fig. 5. - Voltage and current sensors for MPPT and battery charging algorithms.
D. 4º Stage (from T3 until the end) –Float Charge
In this stage the control algorithm will apply in the battery a constant voltage VFLOAT which is a specified value by the battery manufacturers. This voltage is applied to the battery with the objective of avoid its auto-discharge. During the discharging process the battery voltage will fall down and when it achieves 0.9 VFLOAT the control algorithm will execute again the 2º stage providing the IBULK current. The control algorithm only returns to the 2º stage if the PV panel is producing energy, if not the battery will continue the discharge process that could reach a voltage below to the value VCHGENB, in this situation the control algorithm should restart the charging process in 1º stage when the PV panel will have energy again.
In this work there were made some simplifications in the implementation of the four different charging stages of a lead-acid battery. The 1º stage was not implemented because the discharge batteries with this prototype board do not pass below VFLOAT. The possible applied load is disconnected from the battery by the control algorithm avoiding reaching critical discharge. The value of VFLOAT depends or it is a function of the battery temperature.
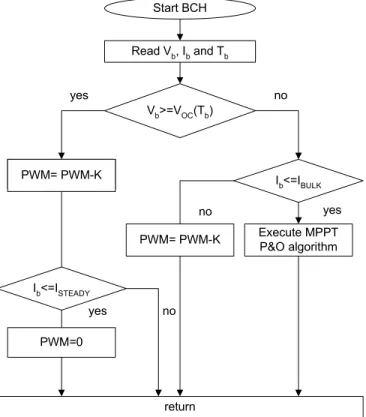
The 4º stage was not implemented but the 3º stage is continued until the charge current reach ISTEADY and finally the charging process is ended. When the PV panel has energy to delivery and the battery voltage is below the VOC the control algorithm executes the 2º stage.
The battery charging implemented algorithm can be seen in Fig. 8. Where Vb and Ib are the battery voltage an delivered current and Tb is the battery temperature. The maximum value of the VOC depends of the battery temperature. From Fig. 8 it is clear that only the 2º and the 3º stages are implemented from the four stages proposed in [12] and [13].
VI. IMPLEMENTED PROTOTYPE BOARD
The implemented prototype board is illustrated in Fig. 9. It can be seen the PV panel connection in the right side of the photo and in the left side the connection to the battery and to the possible load. The latest described charging process of lead-acid batteries is executed with the MPPT algorithm integrated to make an autonomous system that can be used to feed any autonomous load application. This board was developed for feeding led light autonomous signalisation systems.
VII.P&O MPPT EXPERIMENTAL RESULTS
The experimental results of battery charging using the P&O MPPT algorithm are divided in two separated tests. First test, using one PV panel with Pmax=9.31 W, Vmp=17.4 V, Imp=0.54 A, and one lead-acid battery with V = 12 V and Imax = 7.5Ah, that consists, first, the PV panel is connected directly to the battery (first 85x100mseconds) and, second, the PV panel is connected to the battery using the developed interface board running the MPPT algorithm (next 115x100mseconds). Second test, is equal to the one made in the first test but now using one PV panel with Pmax=9.31 W, Vmp=17.4 V, Imp=0.54 and four lead-acid batteries with V = 6 V and Imax = 1.8Ah connected in parallel.
The tests results are illustrated in Fig 10 first, using one 12V battery and second, using four 6V batteries connected in parallel.
Fig. 9. - Photo of the MPPT and battery charger prototype board. Start BCH Read Vb, Ib and Tb PWM= PWM-K return no no yes Ib<=IBULK Vb>=VOC(Tb) PWM=0 yes no Execute MPPT P&O algorithm PWM= PWM-K yes PWM= PWM-K Ib<=ISTEADY
From first test it can be seen that charging the 12V battery with the P&O algorithm, the absorbed power from the PV panel is around 8W, thus the PV panel operates oscillating around the maximum power point. The algorithm takes about 60x100mseconds from zero to the MPP. In the test with the direct connection of the PV panel to the battery, the absorbed power from the PV panel is around 7W.
From second test it can be seen that charging the four 6V batteries with the P&O algorithm, the absorbed power from the PV panel is around 7.5W. The algorithm takes about 40x100mseconds from zero to the MPP. In the test with the direct connection of the PV panel to the batteries, the absorbed power from the PV panel is around 4.5W.
The experimental setup with the MPPT has provided always more delivered energy to the battery than the direct connection. The MPPT has increased the PV panel capacity of supply energy in 12.5% using a 12V battery and 40% using four 6V batteries connected in parallel.
VIII. CONCLUSIONS
This work presented a prototype board based in a small microcontroller that controls the lead acid battery charging
process and also the correct used of the lead-acid battery. The control algorithm executes the P&O maximum power point tracking function allowing, according to solar irradiance, the transfer of maximum energy generated by photovoltaic panel to the battery. This P&O algorithm increase the efficiency power transference in comparison to systems that have not a MPPT (direct connection), reducing the size and the cost of the PV panel. The used of the SEPIC has some advantages because it easily adapts any PV output voltage to any battery input voltage as showed in the presented experiments.
This board assures the fast, safe and complete battery lead-acid charging process and also monitor its discharge. For future work the complete charging process should be analysed to compare with another system working with out P&O MPPT algorithm. From the preliminary results it is expect that the charging process using the MPPT algorithm will be faster.
REFERENCES
[1] Riza M., et al., “A maximum power point tracking for photovoltaic-SPE system using a maximum current controller”, Solar Energy Materials & Solar Cells,vol.75 , pp 697–706, 2003.
[2] D. Sera, T. Kerekes, R. Teodorescu, and F. Blaabjerg, Aalborg “Improved MPPT method for rapidly changing environmental conditions”, IEEE International Symposium on Industrial Electronics, vol. 2, pp 1420–1425, 9-13 July 2006.
[3] K.H. Hussein, I. Muta, T. Hoshino and M. Osakada, “Maximum photo- voltaic power tracking: an algorithm for rapidly changing atmospheric conditions”, In IEE Proceedings Generation, Transmission and Distribution, vol. 142(1), pp 59-64, IEE,Steven age, Herts, U.K., January, 1995.
[4] H. Knop, Analysis, Simulation, and evaluation of maximum power point tracking (MPPT) methods for a solar powered vehicle, Mater of Science Thesis in Electrical and Computer Engineering, Portland State University, 1999.
[5] C. Hua and J. Lin, “An on-line MPPT algorithm for rapidly changing illuminations of solar arrays”, Renewable Energy, vol. 28, pp 1129–1142, 2003.
[6] A. M. Torres, Aproveitamento Fotovoltaico Controlado por Redes Neurais Artificiais Interligado ao Sistema Elétrico, MSc Thesis, GPEC – DEE – UFC, Spt/98 (in Portuguese).
[7] X. Weidong, W.G. Dunford, “A modified adaptive hill climbing MPPT method for photovoltaic power systems” Power Electronics Specialists Conference PESC 04, vol. 3, 20-25, pp 1957–1963, June 2004.
[8] D.P Hohm, M. E. Ropp, “Comparative Study of Maximum Power Point Tracking Algorithms Using an Experimental, Programmable, Maximum Power Point Tracking Test Bed”, Photovoltaic Specialists Conference, 2000. Conference Record of the Twenty-Eighth IEEE, pp 1699 – 1702, 15-22 Sept. 2000.
[9] N. Femia, G. Petrone, G. Spagnuolo and M. Vitelli: “Optimizing sampling rate of P&O MPPT technique” Power Electronics Specialists Conference, PESC04, vol. 3, pp 1945-1949, 20-25 June 2004.
[10] A. Brambilla, M. Gambarara, A.Garutti and F. Ronchi: “New approach to photovoltaic arrays maximum power point tracking”. Power Electronics Specialists Conference, PESC 99, vol. 2, pp 632–637, 27 June-1 July 1999.
[11] M. A. E. Galdino, C. M. Ribeiro, “A Intelligent Battery Charge Controller for Small Scale PV panel”, 12th European Photovoltaic Solar Energy Conference and Exhibition, 1994.
[12] K. Hesse, An off-line lead -acid charger based on the UC3909, Technical report, Unitrod Company, 1997.
[13] R. H. Rosemback, Conversor CC-CC Bidirecional Buck-Boost atuando como Controlador de Carga de Baterias em um Sistema Fotovoltaico, Mater of Science Thesis in Electrical Engineering, University Federal de Juiz de Fora, 2004. 12V Battery 0 2 4 6 8 10 12 14 16 18 1 21 41 61 81 101 121 141 161 181 t (x100m s)
Iin (/10 A) Vout (V) Vin (V) Pin (W)
6V Battery 0 2 4 6 8 10 12 14 16 18 1 21 41 61 81 101 121 141 161 181 t(x100ms)
Iin (/10 A) Vout (V) Vin (V) Pin (W)