Monitoring sodium chloride during cod fish desalting process by flow
injection spectrometry and infrared spectroscopy
Andrea C. Galvis-Sánchez
a,b, Ildikó V. Tóth
c, Ana Portela
b,d, Ivonne Delgadillo
b,
António O.S.S. Rangel
a,*aCBQF/Escola Superior de Biotecnologia, Universidade Católica Portuguesa, R. Dr. António Bernardino de Almeida, 4200-072 Porto, Portugal bDepartamento de Química, Universidade de Aveiro, Campus Universitário de Santiago, 3810-193 Aveiro, Portugal
cREQUIMTE, Departamento de Química, Faculdade de Farmácia, Universidade de Porto, Rua Aníbal Cunha, 164, 4050-047 Porto, Portugal dPascoal e Filhos S.A. Cais dos Bacalhoeiros Apartado 12, Gafanha da Nazaré, 3834-908 Aveiro, Portugal
a b s t r a c t
In order to adapt to the market trends that are moving towards ready-to-use products cod fish industry is including into their industrial operations as the desalting step. The desalting process is a high cost and time demanding operation. The optimization of the desalting process is of vital importance for the fish industry in order to assure the homogeneity and predictable concentration of sodium chloride in the final hydrated cod fish product. On the other hand, consumers are more aware about the necessity to bring sodium consumption down to healthy levels to prevent cardiovascular diseases. The application of rapid and simple analytical methodologies that permit the control of the process and ensure food quality is essential in the food industries.
This work reports the optimization and application of two analytical methodologies with the objective of monitoring the variation of sodium chloride concentration during cod desalting process. A flow injection analysis system was developed based on the reaction between chloride and silver nitrate, and the formed precipitate was assessed spectrophotometrically as a turbidity change. A Fourier-mid infrared spectroscopy attenuated total reflection method was also applied. Different chemical and physical parameters of the flow injection system were studied and the analytical characteristics of both systems were compared.
1. Introduction
Salted cod is one of the principal heavy-salted products consumed in Mediterranean countries (Barat, Rodrígues-Barona, Castelló, Andrés, & Fito, 2004). Salted cod is usually desalted prior to its consumption, and the desalting process is normally accom-plished at home by soaking the product in tap water for at least 24 h. Consumers’ trends and dietary habits are moving to ready-to-use, high nutritional and safe food products. The relationship between high consumption of salt and cardiovascular diseases has been demonstrated and has been the principal reason for the decreasing consumption of salted food products (World Health Organization, 2007). In this context, food companies are facing considerable challenges in the innovation and reformulation of their products in order to satisfy consumers’ demands without compromising the role that salt plays as bacteriostatic and fla-vouring agent in food products.
Sodium and chloride ions are necessary in the human organism as they play important roles in the circulatory and digestive systems. Sodium ions are required to maintain the pressure and the volume of the blood and chloride ions maintain the acid-base balance necessary for the formation of hydrochloric acid in the stomach, needed in the digestive process.
The classical volumetric determinations for chloride based on Mohr and Volhard methods (AOAC, 1995) are very precise but are time consuming and difficult to perform for routine analysis. The potentiometric methods based on chloride ion-selective electrodes are relatively simple and low cost, but are also labour intensive, unless expensive instrumentation like an automatic titrator is involved (Pérez-Olmos, Herrero, Lima, & Montenegro, 1997). Other methods, like flameemission (FES) and atomic absorption (AAS) spectrophotometry, are very precise but require relatively high investment costs. Automated systems have already been developed for chloride determination using flow injection analysis (FIA), a methodology which presents significant advantages when compared to conventional methods, related to simplicity, auto-mation, reduction in sample and reagents consumption. Some of
* Corresponding author. Tel.: þ351 225580001; fax: þ351 225090351. E-mail address:aorangel@esb.ucp.pt(A.O.S.S. Rangel).
these systems involve the reaction between chloride and mercury thiocyanate with subsequent colorimetric measurement of iron (III) thiocyanante (Wolfgang & Lindholm-Franzén, 1980). In the recent years, a pronounced tendency towards “clean methods” was observed and efforts to replace toxic reagents as mercury induced the development of a simple and versatile turbidimetric procedure for chloride determination. The flow injection turbidimetric determination of chloride is a method based on the precipitation of silver chloride and the measurement of the decrease in the inten-sity of the incident radiation caused by scattering by a spectro-photometer and under acidic conditions (Morais, Tóth, & Rangel, 2006). This precipitation reaction was applied successfully for the determination of chloride in waters using FIA (Miró, Estela, & Cerdà, 2004) and SIA (Mesquita & Rangel, 2009) methods.
Infrared (IR) spectroscopy is a versatile analytical technique for the structure elucidation of a large variety of organic, inorganic and biological samples. The principle of the IR spectroscopy is the measurement of the amount of IR radiation, which is absorbed by a sample as a function of the wavelength. For food analysis the most utilised are the NIR (Cen, Bao, He, & Sun, 2007) and MID-IR (Tóth, Segundo, & Rangel, 2008).
Each of the mentioned techniques has been proposed as an analytical methodology for in-situ monitoring and real-time analytical determination such as saccharin in low calorie products (Capitán-Vallvey, Valencia, & Arana-Nicolás, 2004) and during wine fermentation process (Urtubia, Pérez-Correa, Meurens, & Agosin, 2004). Some work was done by using NIR infrared techniques for the determination of sodium chloride in raw meat (Begley, Lanza, Norris, & Hruschka, 1984), in cured salmon (Huang et al., 2001) and in smoked salmon (Lin, Cavinato, Huang, & Rasco, 2003). The applications of flow injection analysis and MID-IR to the cod fish desalting process merge to solve some of the local fish industry necessities of optimize the process itself and assure the final quality of the product.
The main objective of the present work was the optimization and application of two methodologies: a flow injection (FIA) system, a simple and versatile methodology that can be used as a tool for the optimization of the cod fish desalting process and a mid-infrared (MID-IR) spectroscopy procedure, a straightforward and fast methodology for the determination of sodium chloride in the cod muscle and in the cod fish desalting solutions.
2. Materials and methods 2.1. Cod desalting experiments
Dry salted cod (Gadus morhua) was bought at a local market in Portugal with an initial NaCl content between 12 and 16% (w/w). For the desalting experiments cod loins, from three different cod fillets, were cut in parallelepipeds (dimension 9.5 " 3.5 " 2.0 cm3 and an average weight of 110.0 g). Then, the pieces were submerged in stagnant distilled water at a 1:9 (w/w) fish to water ratio, without stirring, at 8#C for 30 h.
Three pieces of cod were randomly selected and weighed peri-odically after 1, 3, 6, 24 and 30 h of desalting process to determine weight changes. Along this period cod pieces and brine aliquots were taken, frozen and kept for further NaCl determinations. 2.2. Sample preparation
The procedure for the sample preparation was according to the methodology referred by (Decreto-Lei No 25/2005 Diário da República No 20, I-A Série, 2005/01/28, 2005). One cod sample of 10 $ 0.1 g taken from one of the randomly selected cod pieces was minced and mixed with 800 mL of distilled water and subsequently
boiled for 45 min. The sample was left to cool down and it was filtered through cotton gauze then the volume was made up to 1000 mL with water. The same extract was used for the NaCl determination by FIA, MID-IR spectroscopy and by the reference method. Prior NaCl determinations the desalting solution was filtered through a 0.45
m
m cellulose acetate filter (Whatman plc, Kent, UK).2.3. Standards and reagents
All reagent solutions were prepared from analytical reagent grade chemicals and deionised water. A standardized stock NaCl solution with concentration of 0.1 mol L%1 was prepared by dis-solving 5.8448 g of NaCl in a 1000 mL of water; this solution was used to prepare a series of working standard solutions ranging from 50 to 600 mg L%1. A stock solution of 0.1 mol L%1silver nitrate was prepared by dissolution of 8.5 g AgNO3 in 500 mL of water. Subsequently, it was titrated against a standard NaCl solution.
Two different colloid protectors, polyvinyl alcohol (PVA) and gelatine were compared. The precipitant reagent using PVA was prepared using a 1 " 10%2mol L%1AgNO3solution in 2 mol L%1 HNO3and 1 g L%1polyvinyl alcohol. To prepare this reagent, 0.25 g of PVA was dissolved in boiling water and allowed to cool. After cooling, 35 mL of concentrated HNO3(d ¼ 1.40; 65%) and 0.42 g of AgNO3were added and the volume was made up to 250 mL with water. For the gelatine precipitant solution, 2.5 g L%1of gelatine was used and the concentration of the other reagents was maintained. A 2 mol L%1HNO3solution was prepared by appropriate dilution of the concentrated HNO3reagent.
2.4. FIA system
The flow system set up comprised a manually operated injector commutator (Bergamin F#, Zagatto, Krug, & Reis, 1978), a peristaltic
pump (Gilson, Minipuls 3) with Tygon pumping tubes, an Ocean Optics cuvette holder with a flow cell (inner volume of 80
m
L and 10 mm light path) connected to reaction coils built up with 0.8 mm i.d. PTFE tubing. The turbidity spectra were recorded using a fiber optic spectrophotometric system, composed of a CCD-array detector (Ocean Optics model HR4000) spectrophotometer with spectral range 200e1100 nm, a couple of optical fibers (id: 300m
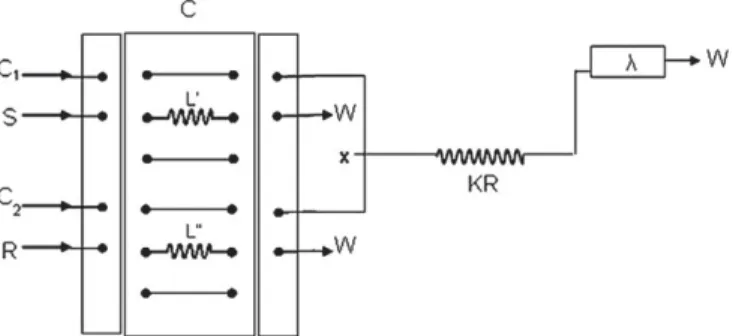
m) and a Mikropack DH-200 combined deuterium and tungsten/ halogen light source. The spectrometer was interfaced with a computer via USB port allowing the signal acquisition by the SpectraSuite Spectroscopy Operating Software.The manifold for the turbidimetric determination of Cl%in salt samples is depicted inFig. 1. The flow rate of the carrier solutions
Fig. 1.Flow injection analysis (FIA) manifold (loading position) for the turbidimetric determination of chloride: S, sample or standard; C1, water; C2, nitric acid (2 mol L%1);
R, reagent (1 " 10%2mol L%1AgNO
3, 2 mol L%1HNO3and 1 g L%1polyvinyl alcohol); L0,
sample loop (15mL); L00, reagent loop (60mL); C, commutator injector; KR, 200 cm
was set at 2.40 mL min%1. The precipitating reagent in nitric acid solution and the working standard solutions (in the range of 50e600 mg L%1) or samples were injected simultaneously into two carrier channels and mixed at the confluent point x. By using the injector commutator device, the reagent is consumed only when the sample is injected, and can otherwise be recovered continu-ously and therefore reducing reagent consumption (Krug, Bergamin F#, & Zagatto, 1986). In this way, the sample zone was overlapped
with the acidic silver chloride solution, then the processed sample passed through the flow cell and the absorbance change caused by the formed AgCl crystals was detected. The transient signal was monitored at 425 nm and maximum peak height was recorded. Quantification of the analyte was based on the interpolation of the recorded signal of the sample solutions on the calibration curve established using standards of known concentrations.
2.5. Mid-infrared spectroscopy analysis
All spectra were acquired using a spectrometer PerkineElmer (Spectrum BX) set up for mid-infrared measurement equipped with a horizontal one single reflection ATR Golden Gate (Specac, Germany). A 50
m
L of standard, desalting solution or cod extract samples were deposited on the surface of the crystal. The spectra was registered between 4000 and 600 cm%1 and collected at a resolution of 4 cm%1; and 32 scans were co-added before Fourier transformation. A total of five replicates for each sample were registered.2.6. Reference method
In order to evaluate the accuracy of the alternative methods (FIA and MID-IR spectroscopy), the results obtained with the proposed methods were compared with those obtained by a reference volumetric procedure (AOAC, 1995).
2.7. Data processing
Spectra analysis was performed using the program CATS 97 (Barros et al., 1997). Principal component analysis (PCA) was used to reduce the dimensionality of the data and to extract the main sources of variability. The PLS1 algorithm was used for modelling the regression. Standard errors of calibration and cross-validation were calculated to asses the quality of the regression.
3. Results and discussion 3.1. Optimization of the FIA system
The proposed FIA system based on a turbidimetric reaction was designed and dimensioned to allow chloride determination over a wide concentration range (50e600 mg L%1).
Certain physical parameters, such as flow rate and coil dimen-sions (length and coil configuration) were studied. A knitted coil reactor of 200 cm was selected. The volume of the precipitating reagent (AgNO3prepared in PVA or gelatine and HNO3) was set to 60
m
L. The sample volume was varied between 60 and 15m
L in orderto study its influence on the sensitivity and repeatability of the system, the volume selected was set to 15
m
L.The wavelength for signal recording was selected based on the maximum sensitivity obtained within the studied wavelength range (390e450 nm varied with increments of 10 nm) and it was set at 425 nm (Table 1).
The use of two different colloid protectors, polyvinyl alcohol (PVA) and gelatine was compared. Although the limit of detection (LOD) values for the FIA with PVA and with gelatine were comparable (0.039 and 0.035 g L%1, respectively), the sensitivity of the FIA with PVA was higher than the one of the FIA with gelatine system.
Zhang and Xia (2008) studied the effect of different colloid protectors on the turbidimetric batch determination of sodium chloride for salted fish. Although significant differences were not found between gum Arabic and gelatine, they recommended the use of gelatine based on economical considerations.
The reproducibility of the developed system with the two colloid protectors was assessed from five calibration curves performed during two months period; sensitivity and standard deviation values of 0.0020 $ 0.0003 L mg%1and 0.00064 $ 0.0005 L mg%1for the systems using PVA and gelatine were obtained, respectively.
The repeatability (RSD) was assessed from six consecutive injections of three dilutions of cod fish extracts after 1 h of desalting. The values for the FIA with PVA system ranged between 2.6 and 3.8% (n ¼ 6) and for the FIA with gelatine the RSD values were between 4.0 and 8.3% (n ¼ 6). Based on these considerations the PVA was selected for further studies.
3.2. Interferences
The potential interfering capacity from certain species was also evaluated in the turbidimetric chloride determination using the proposed FIA methodology with PVA colloid. The effects of protein (bovine serum albumin, BSA) and bromide which might act as interfering agents were studied (Zhang & Xia, 2008). The inter-fering species were added to a standard solution containing chlo-ride at 243 mg L%1and at concentration levels normally found in salted cod fish (Thorarinsdottir, Arason, Geirsdottir, Bogason, & Kristbergsson, 2002). The results (Table 2) showed that the BSA interferes with the determination of chloride causing signal alter-ation of the pure standard outside $ 5%. However, at molar ratio BSA/Cl%
of 1.1, the protein did not interfere with the detection of chloride. This molar ratio is the normal ratio found in the cod fish at various stages of the salting and desalting process (Thorarinsdottir et al., 2002).
Table 1
Optimization of a FIA system for chloride determination.
Variable Ranged studied Selected value Wavelength (nm) 450e390 425 Sample volume (mL) 60e15 15 Reactor length (m) 2.75e1.50 2.0 Concentration of AgNO3(mol L%1) 1 " 10%3e1"10%4 1 " 10%2
Table 2
Effect of the BSA on the determination of chloride at concentration of 243 mg L%1
Added BSA (mg) Molar Ratio BSA/Cl%
Absorbancea
0 e 0.463 $ 0.006
281 1.1 0.458 $ 0.003
402 1.6 0.539 $ 0.004
603 2.5 0.639 $ 0.008
aValues of mean (5 replicates) $ SE (standard error).
Table 3 Effect of the Br%
on the determination of chloride at concentration of 243 mg L%1
Added Br% (mg) Molar Ratio Br% /Cl% Absorbancea 0 e 0.274 $ 0.008 0.67 0.003 0.274 $ 0.003 1.34 0.005 0.311 $ 0.004 2.68 0.010 0.391 $ 0.008
The results (Table 3) showed that Br% interferes with the determination of chloride at molar ratios Br%
/Cl%
higher than 0.003. In the case of cod fish those levels are not expected to interfere since Br%
is a trace element in cod fish.
3.3. Application of the FIA system for chloride determination in cod fish and desalting solution samples
The proposed FIA system was applied to the analysis of cod fish muscle and desalting solutions samples after 30 h of process.Table 4 summarizes the results obtained. The relative deviation (RD) found between the FIA methodology for the cod extracts vs. the reference methodology along desalting process showed values between -2.9 and -30.9% (Table 4). The large RD variation could be due to other elements (Oehlenschläger & Rehbein, 2009) that interfered with the determination and which are part of the cod fish muscle. The protein variation seemed not to interfere with the analytical determination, as it was reported by di Luccia et al. (2005)who found similar amounts of protein in salted cod fish before and after re-hydration, results that were explained by the concomitant aggregation and precipitation of the denaturized proteins, caused by salting, which creates a barrier against more internal proteins being drawn into the soaking medium.
Recovery studies were carried out by spiking, with Cl%
standard solutions in the range between 50 and 120 mg L%1, the different cod
muscle extracts collected along desalting process and the mean recovery found in the spiked extracts was 86.2% (RSD ¼ 6.7%, n ¼ 18). This slightly low recovery might also indicate a systematic error occurring during the FIA determination.
In the case of the determinations of chloride in the desalting solution, the calculated RD values were within the range of 9.5% (Table 4), indicating a better agreement with the results obtained by the reference method.
A complete analytical cycle took about 90 s for any of the samples analysed. The time spent in the analytical cycle is the sum of the time needed for each step until the analytical signal is acquired. Thus, based on the time spent per cycle, the sample frequency was 40 determinations per hour. The overall consump-tion of reagents per hour of work was: 0.24 g of silver nitrate, 0.14 g of PVA and 90 mL of nitric acid (2 mol L%1).
Table 4
Determination of chloride (g NaCl 100 g%1fish) in cod fish muscle extracts and in
desalting solution samples by FIA and reference procedure and corresponding relative deviations.
Sample Time (h) FIAa Reference
methodb RD% Codfish muscle 1 10.9 $ 0.3 11.7 $ 0.7 %6.8 3 7.9 $ 0.3 6.7 $ 0.2 þ17.9 6 6.5 $ 0.3 6.7 $ 0.2 %2.9 24 2.9 $ 0.1 4.2 $ 0.1 %30.9 30 3.3 $ 0.1 3.4 $ 1.3 %2.9 Desalting solutions 1 1.2 $ 0.03 1.3 $ 0.00 %7.7 3 1.6 $ 0.1 1.6 $ 0.03 0.0 6 1.9 $ 0.1 2.1 $ 0.02 %9.5 24 2.0 $ 0.2 2.1 $ 0.04 %4.8 30 2.0 $ 0.1 2.1 $ 0.04 %4.8
a Values of mean (5 replicates $ sd). b Values of mean (3 replicates $ sd).
Fig. 2.Mid-infrared spectrum of NaCl standard solutions ranging from 0 to 200 g L%1.
0 5 10 15 20 25 0 5 10 15 20
Reference NaCl concentration (%)
n oit art n e c n o c l C a N d et ci d er P (% )
Fig. 3.PLS1 regression of spectral data of sodium chloride in cod fish muscle extracts.
-0.1 0.4 0.9 1.4 1.9 2.4 2.9 3.4 0 0.5 1 1.5 2 2.5 3 3.5
Reference NaCl concentration (%)
) %( n oit art n e c n o c l C a N d et ci d er P
Fig. 4.PLS1 regression of spectral data of sodium chloride in desalting solution samples.
3.4. MID-IR for chloride determination in cod fish and desalting solution samples
The capability of using mid-infrared spectroscopy for the quantification of sodium chloride (NaCl) was initially evaluated in preliminary studies (Delgadillo, Vieira, Portela, & Ganito, 2005). The spectra of standard solutions of NaCl in a concentration range between 0 and 200 g L%1were acquired.Fig. 2shows the typical spectra of sodium chloride standard solutions. The analysis of the whole spectra showed differences in the shape and on the form of the water bands at 3700e2800 cm%1and 1600 cm%1. Some studies reported the applicability of NIR and SW-NIR for the prediction of sodium chloride content in meat (Begley et al., 1984) and salmon (Huang et al., 2001; Lin et al., 2003).Begley et al. (1984)detected difference in the absorption bands of water at 1806 nm that were well correlated with different concentrations of NaCl.
Based on the positive results using NaCl standard solutions the determination of NaCl in cod fish and desalting solutions was performed using the MID-IR methodology. Spectra analysis of cod fish extracts after 30 h of desalting process showed changes in the region between 3400 and 3200 cm%1; those changes could be associated to the OH shifting of water due to variation in the amount of hydrogen bonding caused by sodium chloride (Begley et al., 1984).
Cross-validation was carried out for cod fish spectrum (4000e600 cm%1) using “a leave-3-out” spectral analysis and the number of latent variables chosen were 2 (Barros et al., 1997). Results of PLS1 analysis are displayed in theFig. 3which shows that exist correlation between the spectral cod fish data and the refer-ence NaCl concentration (R2¼0.981) with a low calibration error (RMSEC %) of 1.81%. The mean recovery of cod fish extracts was 112.8% (RSD ¼ 11.3%, n ¼ 11). This value indicates the absence of systematic errors during the MID-IR determination.
In the same manner, PLS1 modelling was performed using the spectrum of desalting solutions for predicting the NaCl concen-tration.Fig. 4shows that a correlation between the spectral of the desalting solutions and the reference NaCl concentration is observed, PLS1 results are shown inTable 5. The mean recovery of desalting solutions was 92.5% (RSD ¼ 16.3%, n ¼ 12).
Some analytical characteristics of MID-IR procedure were calculated (Long & Winefordner, 1983) as limit of detection (LOD) and limit of quantification (LOQ), with a LOD of 5 g L%1and LOQ of 16 g L%1. The determination frequency was 20 h%1and no reagents were used for the determinations with a minimum environmental impact.
4. Conclusions
The present work demonstrated the potentiality of a flow analysis system for the determination of the variation of sodium chloride concentration during a desalting/re-hydrating process of cod fish. It was shown to be a convenient alternative presenting low reagent consumption, fast response, possibility of on-line monitoring and
portability. Technological aspects associated to cod fish processing (i.e. cod freshness, salting and drying methods) will influence the desalt-ing process and might also affect the turbidimetric NaCl determina-tion for this type of product.
Salt content in desalting cod solutions and cod fish muscle was predicted with good results by using MID-IR, with high sample through put and no use of reagents.
Both methodologies are convenient alternatives for a real-time NaCl analytical determination with a demonstrated minimization of environmental impact and time saving when compared with the traditional analytical determination. Probably the flow system could be more suitable for real-time monitoring of NaCl content for desalting cod fish solutions and MID-IR could offer more advan-tages for the analysis of cod muscle and additionally could be used in the analysis of other quality parameters in the fish (i.e. humidity). However, the selection of any of the presented methodologies will depend on the specific analytical necessities of the cod fish industry.
Acknowledgments
The first author acknowledges the Fundação para a Ciência e a Tecnologia (FCT), Portugal, for the financial support via the grant Ref. SFRH/BPD/37890/2007. I. V. Tóth thanks FSE and MCTES (Ministério da Ciência, Tecnologia e Ensino Superior) for the financial support through the POPH-QREN program.
References
AOAC e; Association of Official Analytical Chemists. (1995). Salt (chloride as sodium chloride) in seafood. Method No 937.09. In P. Cunniff (Ed.), Fish and other marine products, chap.35 (pp. 7). Gaithersburg: Maryland, USA.
Barat, J. M., Rodrígues-Barona, S., Castelló, M., Andrés, A., & Fito, P. (2004). Cod desalting process as affected by water management. Journal of Food Engineering, 61, 353e357.
Barros, A. S., Safar, M., Devaux, M. F., Robert, P., Bertrand, D., & Rutledge, D. N. (1997). Relations between mid-infrared and near infrared spectra detected by analysis of variance of an intervariable data matrix. Applied Spectroscopy, 51(9), 1384e1393.
Begley, T. H., Lanza, E., Norris, K. H., & Hruschka, W. R. (1984). Determination of sodium chloride in meat by near-infrared diffuse reflectance spectroscopy. Journal of Agricultural and Food Chemistry, 32, 984e987.
Bergamin F#, H., Zagatto, E. A. G., Krug, F. J., & Reis, B. F. (1978). Mergin zones in flow
injection analysis: part 1. Double proportional injector and reagent consump-tion. Analytica Chimica Acta, 101, 17e23.
Cen, H., Bao, Y., He, Y., & Sun, D. W. J. (2007). Visible and near infrared spectroscopy for rapid detection of citric and tartaric acids in orange juice. Journal of Food Engineering, 82, 253e260.
Capitán-Vallvey, L. F., Valencia, M. C., & Arana-Nicolás, E. (2004). Flow-through spectrophotometric sensor for the determination of saccharin in low-calorie products. Food Additives and Contaminants, 21, 32e41.
Diário da República No 20, I-A Série, 2005/01/28. (2005). Retrieved March 04, 2009 from http://portal.min-agricultura.pt/portal/page/portal/MADRP/PT/ser-vicos/legislacao/conteudos/F_LEGIS_2005/DL_25.htm.
Delgadillo, I., Vieira, J., Portela, A., & Ganito, S. (2005). Estudo piloto de polifosfatos e cálcio e cinética e mecanismo de demolha do bacalhau. e Project 22-04-06-IFP-0005 e Interim Report Estudo da demolha do bacalhau. Portugal: University of Aveiro.
Huang, Y., Rogers, T. M., Wenz, M. A., Cavinato, A. G., Mayers, D. M., Bledsoe, G. E., et al. (2001). Detection of sodium chloride in cured salmon roe by SW-NIR spectroscopy. Journal of Agricultural and Food Chemistry, 49, 4161e4167. Krug, F. J., Bergamin F#, H., & Zagatto, E. A. G. (1986). Commutation in flow injection
analysis. Analytica Chimica Acta, 179, 103e118.
Lin, M., Cavinato, A. G., Huang, Y., & Rasco, B. A. (2003). Predicting sodium chloride content in commercial king (Oncorhynchus tshawytscha) and chum (O. keta) hot smoked salmon fillet portions by short-wavelength near-infrared (SW-NIR) spectroscopy. Food Research International, 36, 761e766.
Long, G. L., & Winefordner, J. D. (1983). Limit of detection a closer look at the IUPAC definition. Analytical Chemistry, 55, 712Ae724A.
di Luccia, A., Alviti, G., Lamacchia, C., Faccia, M., Gambacorta, G., Liuzzi, V., et al. (2005). Effects of the hydration process on water-soluble proteins of preserved cod products. Food Chemistry, 93, 385e393.
Mesquita, R. B. R., & Rangel, A. O. S. S. (2009). A review on sequential injection methods for water analysis. Analytica Chimica Acta, 648, 7e22.
Table 5
PLS1-regression statistics of cod fish muscle and desalting solution samples collected along 30 h of process.
Sample solution LVa R2b RMSEC
(%)c
Cod fish muscle 2 0.981 1.81
Desalting 4 0.930 3.42
aLatent variables.
b Coefficient of determination. c Root means square error of calibration.
Miró, M., Estela, J. M., & Cerdà, V. (2004). Application of flowing-stream techniques to water analysis part II. General quality parametres and anioic compounds: halogenated, sulphur and metalloid species. Talanta, 62, 1e15.
Morais, I. P. A., Tóth, I. V., & Rangel, A. O. S. S. (2006). Turbidimetric and nephelometric flow analysis: concepts and applications. Spectroscopy Letters, 39, 547e579. Oehlenschläger, J., & Rehbein, H. (2009). Nutritional composition. In H. Rehbein, &
J. Oehlenschläger (Eds.), Fishery products quality, safety and authenticity, chap. 1, basic facts and figures (1st ed). (pp. 4e5). Oxford, UK: Wiley-Blackwell Publishing Ltd.
Pérez-Olmos, R., Herrero, R., Lima, J. L. F. C., & Montenegro, M. C. B. S. M. (1997). Sequential potentiometric determination of chloride and nitrate in meat products. Food Chemistry, 59, 305e311.
Thorarinsdottir, K. A., Arason, S., Geirsdottir, M., Bogason, S. G., & Kristbergsson, K. (2002). Changes in myofibrillar proteins during processing of salted cod (Gadus morhua) as determined by electrophoresis and differential scanning calorim-etry. Food Chemistry, 77, 377e385.
Tóth, I. V., Segundo, M. A., & Rangel, A. O. S. S. (2008). Food, beverages and agri-cultural applications. In S. D. Kolev, & I. D. Mckelvie (Eds.) (1st ed).Advances in flow injection analysis and related techniques, included in the series of Wilson & Wilson’s comprehensive analytical chemistry, Vol. 54 (pp. 513e549). Amsterdam, The Netherlands: Elsevier.
Urtubia, A., Pérez-Correa, J. R., Meurens, M., & Agosin, E. (2004). Monitoring large scale wine fermentation with infrared spectroscopy. Talanta, 64, 778e784. Wolfgang, J. K., & Lindholm-Franzén, I. (1980). Spectrophotometric determination of
chloride, bromide, and iodine with an improved mercury-iron-tryocyanate method. Microchemical Journal, 25, 240e245.
World Health Organization. (2007). Reducing salt intake in populations. World Health Organization Technical Report Service 2006/10/5e7 Edition. Retrieved July 22, 2009 from.www.who.int/dietphysicalactivity/reducingsaltintake_EN.pdf. Zhang, Y., & Xia, W. (2008). A novel method for the determination of sodium
chloride in salted fish. International Journal of Food Science and Technology, 43, 927e932.