Article
Printed in Brazil - ©2017 Sociedade Brasileira de Química0103 - 5053 $6.00+0.00
*e-mail: [email protected]
Multifunctional Nanocomposites between Different Carbon Nanostructures and
Styrene Acrylic Latex
Carolina F. Matos,a Fernando Galembeckb and Aldo J. G. Zarbin*,a
aDepartamento de Química, Universidade Federal do Paraná (UFPR), 81531-990 Curitiba-PR, Brazil
bInstituto de Química, Universidade Estadual de Campinas (UNICAMP), 13083-861 Campinas-SP, Brazil
This work describes the preparation, characterization and properties study of multifunctional nanocomposites between poly(styrene-co-butyl acrylate) latex and different carbon nanostructures: iron-filled carbon nanotubes (CNT), graphene or graphene oxide. Different approaches were employed to prepare stable aqueous dispersions of these nanostructures, according to the specificity of each nanomaterial. The nanocomposites were characterized by Raman and Fourier transform infrared (FTIR) spectroscopy, as well as by scanning probe microscopy (SPM) at different modes, providing information regarding the nature of the interaction between the carbon nanostructures and the polymeric matrix. The synergistic effect between the components results in improved mechanical, electrical, thermal and chemical properties of the nanocomposites, when compared to the neat polymer. In addition, the iron species into CNT cavities provide an interesting and unusual magnetic property of the nanocomposites. Results show that the properties of the nanocomposites can be modulated aiming desired application by simply selecting the amount and/or the kind of carbon nanostructure. This work provides information on the features of the three systems used, showing the range of properties that can be covered by using the three nano-fillers.
Keywords: multifunctional nanocomposites, acrylic latex, carbon nanotubes, graphene, graphene oxide
Introduction
The utilization of carbon nanostructures as fillers in polymeric nanocomposites, mainly fullerenes, carbon nanotubes (CNTs) and graphene-based species (graphene, reduced graphene oxide, graphene oxide and others) have attracted a great deal of interest.1-3 Due to the π conjugation
extended over sizeable areas, these materials exhibit unusual electronic, electrical, mechanical and thermal properties, with a large number of potential applications.4
Several carbon-based nanocomposites, starting from different polymeric matrices, have been studied, using different types of modification, with functionalized nanostructures or combined with surfactants, using different polymers and blends, different ratios of filler/ polymer and different preparation methods, in order to obtain the best homogeneity and consequently the desired properties to the final material.5-9 Researches on polymeric
nanocomposites have generated new technologies and
business opportunities, particularly regarding the concept of multifunctional nanocomposite materials.10,11
Several papers involving multifunctional polymer nanocomposites, with specific properties, have been
described in the last years. Antunes and Velasco12
described in a latter-day review a wide compilation of the applicability of carbon nanoparticles multifunctional polymer foams, with particular emphasis on the electrical and transport properties of these materials. Leung et al.13
showed the development of multifunctional polymer nanocomposites with uniaxially aligned liquid crystal polymer fibrils and graphene. The materials obtained were quite versatile with good processability and good electrical and thermal properties. Asthana et al.14 presented an easy,
environmentally friendly, and inexpensive fabrication of highly electrically conductive, polymer-based super-hydrophobic coatings, using carbon black, carbon nanotubes, graphene nanoplatelets and their combinations with fluoroacrylic polymer.
graphene oxide,16 based on the latex-technology. The
nanocomposites presented novel and improved chemical, electrical, mechanical and magnetic properties. Moreover due its biodegradability and “green” route of preparation, these samples proved to be environmentally benign materials. In this paper we extend that preparative approach to nanocomposites based on a synthetic polymeric latex poly(styrene-co-butyl acrylate), referred hereafter as SA, and three different carbon nanostructures: iron-filled carbon nanotubes, reduced graphene oxide (rGO) and graphene oxide (GO). The preparation, characterization and study of properties of these different materials are presented, and the results are discussed, emphasizing the possibility to modulate the properties of these materials as a function of the amount and/or characteristics of the filler.
Experimental
Materials
The nanocomposites were prepared starting from a commercial latex Denvercril RA 193, supplied by Denver (Brazil) and formed by a colloidal particles of copolymer of poly(styrene-co-butyl acrylate), with a solid content of 51 wt.% and diameter of the latex particles of 117 ± 23 nm. This latex was designated as SA. The multi-walled carbon nanotubes (MWCNTs) were synthesized by chemical vapor deposition (CVD) starting from pure ferrocene according to our previous work.17 The graphene species were obtained
by a modified Hummers method, according to our previous work.18 The surfactants sodium dodecyl sulfate (SDS) and
hexadecyltrimethylammonium bromide (CTAB) were supplied by Sigma-Aldrich. H2SO4 (Merck) and HNO3
(Merck) analytical grade were used as received.
Preparation of the aqueous dispersions
Two aqueous dispersions of CNTs have been prepared: (i) pristine CNTs dispersed in water in the presence of SDS. CNTs were dispersed in 20 mL of an aqueous solution of SDS, maintaining the CNT/SDS ratio of 1/1.5 wt.%. The mixture was sonicated for 2 hours in an ultrasound bath (UNIQUE-USC 1880, 37 kHz, 154 W). The nanotubes prepared by this way will be referred here as pCNT (p from pristine); (ii) CNTs chemically treated in an aqueous solution of HNO3 (3 mol L-1) and H2SO4 (3 mol L-1).19 These
CNTs will be referred here as aCNT (a from acidic treated). Aqueous solution of GO was prepared in the concentration of 1 mg mL-1, at pH = 9 (previously adjusted with a NaOH
0.1 mol L-1 aqueous solution). The dispersion of rGO were
carried out in 20 mL of an aqueous solution of CTAB
0.5 wt.%, in an ultrasonic probe (Cole Parmer CP505, 20 kHz, 500 W) for 10 min. The best surfactant for each carbon nanostructure, as well as the carbon nanostructure/ surfactant ratio were determined based on preliminary experiments (not shown) to optimize the aqueous dispersion for each filler.
Preparation of nanocomposites
The aqueous dispersion of each nanostructure was directly mixed with the polymeric latex, under magnetic stirring. The CNT-based nanocomposites were stirred by 3 hours at 2000 rpm, followed by 1 hour under sonication in an ultrasonic bath (UNIQUE-USC 1880, 37 kHz, 154 W), in order to remove the bubbles produced during the magnetic stirring. Both the GO- and rGO-based nanocomposites were stirred by 60 min followed by additional 30 min of sonication in the same ultrasonic bath described before. Finally, the mixtures were dried at 70 °C for 24 hours.
The experimental conditions and amounts of nanostructures and latex used in the preparation of all nanocomposites discussed in this work are summarized in Table S1. Samples will be referred here according the following: SA for the polymer without filler used as a control sample; SAaCNT for nanocomposites with aCNT; SApCNT for nanocomposites prepared with pCNT. SAGO for nanocomposites prepared with graphene oxide; SArGO for nanocomposites prepared with reduced graphene oxide. The number preceding the abbreviation represents the amount of the filler (in weight percent of the dry polymer) added to the composite. For example, the sample 1SAGO was prepared with 1 wt.% of graphene oxide.
Characterization
Scanning electron microscopy (SEM) images from fracture surfaces (in liquid N2) of the samples were
obtained in a FEG-SEM MIRA microscope. All samples were coated with chromium. The voltage used was 15 kV. Scanning probe microscopy images were obtained using a Shimadzu SPM-9700 microscope at different modes: lateral (LFM), Kelvin (KFM) and magnetic (MFM) force microscopy. For LFM images, both neat latex and freshly prepared nanocomposite mixtures were dripped onto cleaved mica, and dried at 70 °C for 24 h. Images were acquired using a silicon tip (Nanoworld) with k = 0.2 N m-1 and a
k = 2.8 N m-1 and a frequency of 5 kHz. MFM images were
obtained at the fracture surface (in liquid N2) of the sample
10SApCNT, using a cobalt-coated silicon tip (Nanoworld) with k = 2.8 N m-1 and a frequency of 75 kHz, at 50 nm of
lift height. Raman spectra were obtained using a Raman Renishaw Microscope Imaging System 3000 coupled to an optical microscope with an Ar+ (514.5 nm) laser. The
Fourier transform infrared (FTIR) spectra were obtained in a Vertex-70 (Bruker) equipment in attenuated total reflectance (ATR) mode, using an ATR (Pike Technologies) accessory. The thermogravimetric analyses (TGA) were performed in a Q600 SDT equipment (TA Instruments) under atmosphere of synthetic air (100 mL min-1, White Martins) from room
temperature to 800 °C at a heating rate of 5 °C min-1. The
electrical resistivity of the samples was obtained directly from the films (1 × 1 cm lateral size, 0.5 mm thick) by the four-point technique, using a Universal probe Jandel equipment. The dynamical mechanical analyses were performed in a DMA Netzsch model 242, using a frequency of 1 Hz, following the standard ASTM D5026-01. Swelling experiments were carried out using square samples (1 × 1 cm lateral size, 0.5 mm thick). Both the weight and physical dimensions of the samples were initially determined (using an analytical balance and a caliper rule, respectively), and the samples were further immersed in xylene. The samples were periodically removed from the
solvent and gently dried, their weight and dimensions were both determined, and the samples were immersed in xylene over again.
Results and Discussion
Microstructure and electrostatic interaction between the nanostructures and SA latex
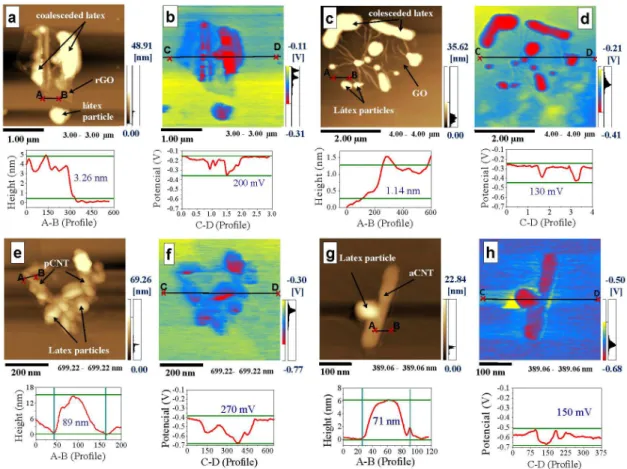
Figure 1 shows the topographic and the KFM images of the nanocomposites 1SAGO (Figures 1a and 1b), 1SArGO (Figures 1c and 1d), 5SApCNT (Figures 1e and 1f) and 5SAaCNT (Figures 1g and 1h) freshly prepared, diluted, dripped and dried over mica. The topographic and KFM images were obtained simultaneously in the same region. All topographical images demonstrate that latex particles adhere to graphene and CNTs, beyond coalescing with other latex particles. The thicknesses of rGO and GO observed in these images by topographic profile are 3.3 and 1.1 nm, respectively (profile Figures 1a and 1c). The first one indicates a multilayer of rGO and the second one corresponds to a monolayer of GO. The CNTs in turn exhibit diameters between 71 and 90 nm (profile Figures 1e and 1g).
The KFM images of all samples reveal non-uniform charge distribution along the analyzed surfaces. Analogously
to the well-known natural rubber latex, the SA latex is not an homogeneous material, with a pronounced amount of negative charges inside of the particles,20 as can be seen
on Figure 1. There is also evidence for positive charge in the edges of rGO but more so over the mica substrate. This is assigned to adsorbed CTAB, suggesting that this surfactant does not accumulate at the surfaces of the rGO or latex particles. This fact may have a negative effect on rGO dispersion in the nanocomposite, affecting the material properties. On the surface of the SAGO sample (Figure 1d) the potential difference showed in the line scan below the image is slightly lower, around 130 mV. Differently from the rGO sample, SAGO does not contain CTAB. The same characteristics of SAGO surface are observed in the sample SAaCNT (with ca. 150 mV, Figure 1h). The SApCNT showed a potential difference of ca. 270 mV (Figure 1f, profile), probably due to the inclusion of a larger amount of negative charges, resulting from the anionic surfactant that remains adhered to the CNTs providing a greater delta of potential between both the nanotubes and latex and the substrate.
Morphology and dispersion of the fillers on SA latex
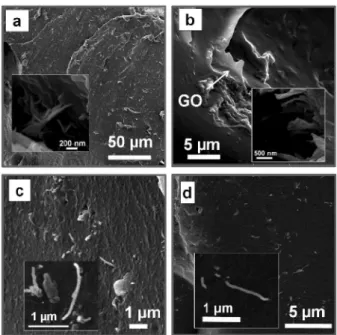
The SEM images of the fracture surfaces of samples 5SArGO, 5SAGO, 5SApCNT and 5SAaCNT are presented in Figure 2. The fracture surfaces are fairly homogeneous with few regions containing larger filler aggregates, mainly in the nanocomposites with oxygenated fillers (SAaCNT and SAGO). At higher magnification, some filler particles are seen protruding out of the matrix, indicating a good interface interaction with the polymer matrix. The variation in the surface roughness, comparing the graphene species and the CNTs nanocomposites, suggests different fracture pathways,21 as expected considering the pronounced
geometrical differences between the nanofiller species. The use of vibrational techniques allows the elucidation of many of the mechanisms of the interactions between the polymer matrix and the filler, providing information on the quality of dispersion of the fillers in the polymer, as well as on the stress transfer from the matrix to the filler. All the samples prepared in this work have been characterized by Raman spectroscopy, and the results are presented and fully discussed in the Supplementary Information (Figure S1). CNTs bands were red-shifted in the nanocomposites spectra, as a result of the compression forces of the polymer on the CNTs, due the effective interaction between both the components.
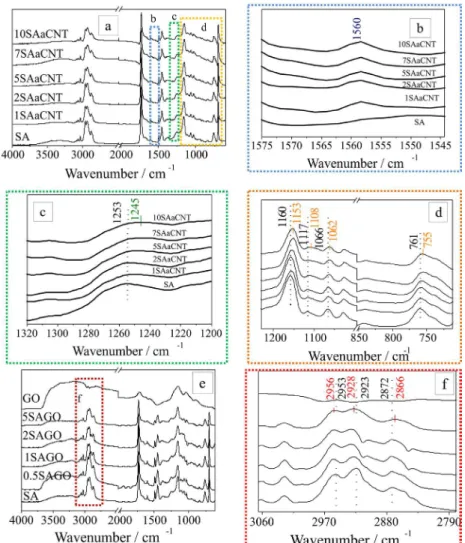
Figure 3 shows the FTIR-ATR spectra of SA and the aCNT- and GO-based nanocomposites, respectively. Spectra were normalized in respect to the band at 1738 cm-1.
The spectra of all samples show all the characteristic bands of SA: the bands associated to styrene fragments appear in the range of 3150-3000 cm-1 and 900-675 cm-1,
corresponding to the C−H stretching of aromatic ring, and
in the range of 1605-1595 cm-1 due to the C−C stretching
of aromatic ring; the butyl acrylate copolymer shows bands in the range of 1730-1720 cm-1 due to the carbonyl group
and around 1250-1240 cm-1, attributed to the −C−O−C
asymmetric stretching. In the CNTs-based nanocomposites, a CNTs band at approximately 1560 cm-1 can also be
seen besides the bands of the copolymer. Increasing the percentage of CNTs in the nanocomposite, a proportional shift of some bands to lower wavenumbers can be observed in both SAaCNT (Figures 3c and 3d) and SApCNT (Figure S2) samples. For example, comparing neat polymer and the sample 10SAaCNT: (i) the υ(−CO) band
at 1253 cm-1 in the neat polymer is shifted to 1245 cm-1;
(ii) the δ(−COC) band at 1160 cm-1 moves to 1153 cm-1
in the nanocomposite; (iii) the υ(−CO) bands at 1117 and
1066 cm-1 shift to 1108 and 1062 cm-1, respectively.
These shifts refer to vibrational modes associated with polar portions of the polymer, and can be indicative of the occurrence of interactions between the molecules of the copolymer and the groups present on the CNTs surface (such as hydroxyl and carboxyl). The displacements of the band at 761 to 755 cm-1 (υ(−CH) out of the plane of
the aromatic ring) should be an indicative of π interaction,
caused possibly by alignment of the polymer ring with the CNTs.
In the spectra of nanocomposites with GO and rGO the shifts are related to C−H stretching bands of the groups in
the SA. For the samples with GO (Figure 3f) the bands at 2953 and 2923 cm-1 were shifted to 2956 and 2928 cm-1,
respectively. In turn, the band at 2872 cm-1 was shifted to
lower energy values (2866 cm-1). These changes suggest the
existence of a non-polar interaction between GO and the polymer. In the nanocomposites with rGO (Figure S2f) the band displacement appears on in the aromatic CH stretching vibration (2923 to 2930 cm-1), suggesting that in this case
the interaction is between the rGO rings (without CTAB, as seen by KFM) and the styrene portion of the SA.
Electrical resistivity and swelling
Figure 4 shows the effect of the amount of filler on the electrical resistivity of the nanocomposites. The resistivity value of the neat polymer was collected from literature (ca. 1012Ω cm)22-24 because our equipment was
not configured to measure so high-resistive materials. The four families of samples display similar behavior. At low filler concentration, the resistivity of the nanocomposites is close to that of the neat insulating polymer, but a decrease
in the electrical resistivity is observed as the either CNTs or rGO concentration exceeds the percolation threshold. The percolation thresholds of these samples are less than 1 wt.% of both CNTs and rGO. Similar results were obtained by Pham et al.25 to poly(methyl methacrylate)-rGO
nanocomposites showing percolation threshold as low as 0.16 vol%. These low percolation thresholds reflect the good dispersion of the fillers in the matrix. The sample containing 10 wt.% of CNTs exhibits a decrease in electrical resistivity of eleven orders of magnitude, relative to the neat matrix (from 1012 to 101Ω cm). These values agree with
those found by Dufresne et al.23 that reported a resistivity
of approximately 102Ω cm for SA/CNTs and a percolation
threshold below 3 wt.% for nanocomposites that contained the same amount of CNTs. The decrease in the resistivity in the nanocomposites with rGO was not as significant as in the case of CNTs (from 1012 to 106Ω cm) and filler addition
beyond 2 wt.% did not result in further change. This best improvement in the electrical property of the CNT-based nanocomposites (compared to the rGO ones) was also verified by Tkalya et al.26 in polystyrene latex-based nanocomposites.
The filler network that provides the improvement in the electrical properties also contributes to increase the swelling resistance of the nanocomposites. Figure S3 shows that xylene absorption decreases when the filler concentration increases: after 60 minutes of immersion in xylene, SA weight increases more than eight-fold while the 5SArGO and 5SAGO weight increases by only 199 and 166% (Figure 5 and Table S2). Figure S4 shows a large difference between the neat polymer and the nanocomposites after only one hour immersed in xylene. Similar results have been previously reported in other studies involving the incorporation of carbon nanostructures in different polymers, mainly in elastomeric matrices.27,28
The lower solvent sorption observed in the nanocomposite samples is because the fillers act as a physical barrier, hindering permeation of the solvent. This effect is also due to the formation of a three-dimensional nanostructure inside of the nanocomposite, opposing latex swelling.
Although the mechanism involved in the electrical resistivity and swelling is different, it is noted that the inflections in both curves appear in almost the same filler concentration ranges (Figure S5). The two curves for the SAGO, for example, overlap almost perfectly. Again, these effects are because such properties are related to the formation of three-dimensional nanostructure network inside of the polymeric matrix, essential for a significant increase in both electrical conductivity and the sorption resistance.
Mechanical properties
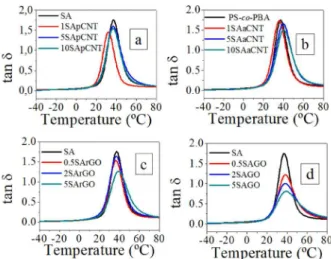
Aiming the investigation of the effect of carbon fillers in the reinforcement of SA, dynamic mechanical analyses (DMA) were performed. The damping factor (tan δ),
storage (E’) and loss (E”) modulus in function of the temperature were evaluated. These parameters provide information regarding molecular mobility, elastic responses against deformation and heat dissipation, respectively. In addition, the glass transition temperature (Tg) of the
polymer can be determined from the onset temperature of the tan δ curve. Figure 6 shows the curves of tan δ and
Figures S6 and S7 shows the storage (E’) and loss modulus (E”), respectively, obtained by DMA.
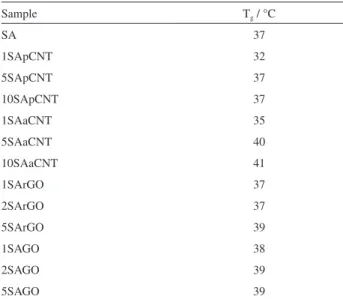
The unfilled SA matrix exhibits typical behavior of amorphous thermoplastic polymer. For the samples with CNTs and rGO the curves (Figure 6) indicate that there were no significant changes in glass transition temperature (Table 1) and the storage and loss moduli in the polymer with addition of these nanostructures. Most nanocomposites have a slight increase in their storage modulus below Tg.
The composite modulus increases up to about 0.7 GPa for example in the sample 5SApCNT. Above Tg only GO filled
materials have a greater increase in the storage (Figure S6d) and loss (Figure S7d) moduli observed with increasing weight fraction of filler, reaching 160% in E’ for sample 5SAGO (at 50 °C, from 3.2 to 8.4 MPa). Similar results obtained for SAGO samples were observed by Dufresne et al.23
for nanocomposites between SA and MWCNT, and by Etmimi and Sanderson29 for nanocomposites between SA
and graphite oxide, which stated that this improvement in mechanical properties of the polymer is because of the good dispersion of the nanosheets and strong interaction between the polar groups of SA and the polar groups of Figure 4. Resistivity as a function of fillers loading for SA-based
nanocomposites.
Figure 5. Xylene sorption after one hour of immersion as a function of
filler content.
Figure 6. Damping curves as function of temperature for SA and
GO. There is abundant information on the nature and distribution of the polar groups over the GO sheets, and we follow Dreyer et al.30 emphasizing carboxylic, epoxy and
hydroxyl groups. Thus, different kinds of interactions can be considered to account for GO binding to SA: electrostatic interactions, as in the case of latex-clay nanocomposites,31,32
hydrogen bonds and Lewis acid-base interactions, beyond the usual van der Waals interfacial interactions. This is also in accordance with data obtained by FTIR.
In the damping curves of these nanocomposites with GO (Figure 6d) the height of tan δ peaks were enlarged and
reduced, as a function of filler content. This can be explained considering that the polymeric fraction decreases in the nanocomposites, and that GO is not a viscoelastic solid. An additional contribution to hysteresis comes from GO particle alignment in the stretched nanocomposite.32 A previous
work of our group16 showed that the high aspect ratio of the
graphene species restricts the mobility of the polymer chain segments near the graphene/polymer interface, resulting in increased storage capacity and loss modulus. The data presented before makes clear that GO is the best filler to improve the mechanical properties of the polymer.
A novel way to evaluate the mechanical properties of this kind of material is through the measurement of the fluctuations in the frictional forces using lateral force microscopy (LFM). This technique is based on the torsional
strain of the cantilever resulting from lateral forces acting between the tip and the sample surface (surface adhesion). In the LFM images presented in this paper the adhesive regions, i.e., with more positive frictional potential (see the scale bar beside the images), will appear brighter, whereas regions with low coefficient of friction (which cause a lower tip torsion) will appear darker. Figure 7 shows topography and LFM images of SA (Figures 7a and 7b) and the composites 5SAGO (Figures 7c and 7d), 5SArGO (Figures 7e and 7f), 5SApCNT (Figures 7g and 7h) and 5SAaCNT (Figures 7i and 7j).
The topographic image of the SA (Figure 7a) shows a very smooth film with approximately 14 nm maximum height difference. On the other hand, LFM micrograph (Figure 7b and inset) shows that the film contains many particles that did not coalesce, showing the capability of this technique to provide information that is not discerned by conventional topographic image. Moreover, these particles have a lower friction coefficient and they are probably stiffer particles. The surface of the sample 5SAGO (Figure 7c) is rougher and contains some holes, which may have been originated from trapped air bubbles. LFM images of the same region (Figure 7d and inset) show GO sheets (with lateral size of ca. 2 µm), not detected in the topography image and partly covered by polymer, as expected due to the lower surface tension of the latter. Isolated polymer particles are not observed at the surface of this sample. The GO sheets have a lower friction coefficient than the polymer matrix. Again, this is expected considering the lower modulus of the latter.
LFM image for 5SArGO (Figure 7f) also shows the presence of rGO (with lateral size of ca. 2-5 µm), not detected in the topography image (Figure 7e). These rGO sheets appear to be uncoated by the polymer and this is consistent with the previous explanation presented for Figure 7d, since the surface tension for rGO should be lower than GO. Friction follows the same trends as in SAGO. The LFM images of the SApCNT (Figure 7h) and SAaCNT (Figure 7j) nanocomposites allow the identification of carbon nanotubes, which are hardly distinguished in the topographic images (Figures 7g and 7i, respectively) and shows that their friction to the tip is also lower than the polymer, the same as GO and rGO. However, friction in the polymer matrix in the three nanocomposites is higher than in the pure polymer, showing that the matrix itself underwent some structural or compositional change, likely associated to the new interfaces formed with GO, rGO and CNT.
Thermal properties
Nanocomposites often display higher thermal stability than the pure polymers. The thermogravimetric analysis Table 1. Tg values of SA nanocomposites
Sample Tg / °C
SA 37 1SApCNT 32 5SApCNT 37 10SApCNT 37 1SAaCNT 35 5SAaCNT 40 10SAaCNT 41 1SArGO 37 2SArGO 37 5SArGO 39 1SAGO 38 2SAGO 39 5SAGO 39
S A : p o l y m e r w i t h o u t fi l l e r u s e d a s a c o n t r o l s a m p l e ; SAaCNT: nanocomposites with aCNT; SApCNT: nanocomposites prepared with pCNT; SAGO: nanocomposites prepared with graphene oxide; SArGO: nanocomposites prepared with reduced graphene oxide. The number preceding the abbreviation represents the amount of the filler (in weight percent of the dry polymer) added to the composite. Tg: glass
(TGA) curves of the SA, carbon nanostructures and nanocomposites are given in Figure 8. Table 2 sums up the thermogravimetric data including T10% and T90% of
SA and nanocomposites. T10% is the onset temperature at
which 10% of the material degradation occurs, and T90%is
the temperature at which 90% of degradation occurs. The
non-volatile material remaining above 700 °C is considered residue. The residue (iron oxide for the CNTs samples) increased proportionally to the increase of nanotube concentration. Table 2 shows that all nanocomposites with CNTs present lower thermal properties than the neat SA copolymer that can be assigned to the Fe content. The T10%
of all the synthesized nanocomposite with CNT decreased by 5 to 22 °C compared to pure SA, but the T90% increased
at approximately 60 °C for samples more concentrated, indicating that the range in which degradation of the material occurs is broader, i.e., the degradation of the polymer in the nanocomposites occurs more slowly than the pure polymer. This effect can be due the filler barrier that inhibits mass transfer and provides thermal insulation to protect the underlying polymer from the heat source.33
We observed this same behavior for nanocomposites prepared with these same carbon nanotubes and natural rubber latex.15
For samples with graphene species, the T10% of all
nanocomposites (except for sample 5SArGO) increased by 15 °C and the T90% increased by approximately 42 °C,
compared to pure SA copolymer. This clearly shows that the thermal stability of the SA increases in the presence of this kind of nanostructure. Similar behavior were described to nanocomposites between graphite oxide and SA, obtained by different approaches29,33-36 and this may be assigned to
the slower gas diffusion in and out the nanocomposite.
Magnetic properties
The use of carbon nanotubes with cavities filled with magnetic species adds magnetic properties to the resulting nanocomposites, providing a new function to these multifunctional materials. To prove the magnetic nature of Figure 7. Topographic (a,c,e,g,i) and LFM (b,d,f,h,j) images of (a,b) SA
and nanocomposites, (c,d) 5SAGO, (e,f) 5SArGO, (g,h) 5SApCNT and (i,j) 5SAaCNT.
Figure 8. TGA curves of the SA, carbon nanostructures and nanocomposites
these nanocomposites, magnetic mapping was done using magnetic force microscopy (MFM). Figure 9a shows the topography image, Figures 9b and 9c give the magnetic maps of sample 10SApCNT. In the topographic image only
the fracture pattern of the sample is observed. However, in the MFM images of the same region, the presence of “magnetic wires” (darker portion of the MFM image) is clearly noted, which is interpreted as resulting from the magnetic iron species encapsulated inside of the tubes.
Nanocomposites containing more than 2 wt.% of CNTs are easily attracted by simple magnets, as shown in Figure 9d. The simultaneous magnetism and conductivity of the nanocomposite makes it potentially useful in coatings, inks and paints where each or both properties are desirable, e.g. to avoid the effects of electromagnetic interference and electrostatic charging.
Conclusions
The development of multifunctional materials presenting two or more functions, which can be performed simultaneously or sequentially in time, is an important issue related to the development of advanced materials. In this paper multifunctional nanocomposites between styrene-acrylic latex and four different aqueous colloidal dispersions of three carbon nanostructures have been prepared by a simple and “green” route. In addition to the improvements in the mechanical, thermal, chemical and electrical properties of the polymer, owing to a good interfacial interaction, one kind of these materials also exhibit magnetic properties due to the specific family of Table 2. Data obtained from thermogravimetric curves of SA and its
nanocomposites
Sample T10% / °C T90% / °C Residue / %
SA 324 397 < 1
1SApCNT 319 452 1.7
5SApCNT 308 445 3.3
10SApCNT 302 456 3.7
1SAaCNT 312 435 < 1
5SAaCNT 313 453 1.7
10SAaCNT 314 454 < 1
0.5SAGO 326 401 < 1
2SAGO 332 405 < 1
5SAGO 337 400 < 1
0.5SArGO 331 398 < 1
2SArGO 339 439 < 1
5SArGO 307 405 < 1
S A : p o l y m e r w i t h o u t fi l l e r u s e d a s a c o n t r o l s a m p l e ; SAaCNT: nanocomposites with aCNT; SApCNT: nanocomposites prepared with pCNT; SAGO: nanocomposites prepared with graphene oxide; SArGO: nanocomposites prepared with reduced graphene oxide. The number preceding the abbreviation represents the amount of the filler (in weight percent of the dry polymer) added to the composite. T10%: onset temperature at which 10% of the material degradation occurs;
T90%: temperature at which 90% of degradation occurs.
CNTs employed in its preparation. Except by the novel magnetic property, the improvement in these properties was consistent with other studies involving similar materials described in the literature. However it is noteworthy that for many of these properties, the improvements presented here were more significant.
This paper presented also, for the first time, the use of lateral force microscopy technique to evidence the synergistic effects between the polymer and the carbon nanostructures that affects the mechanical properties of these kinds of nanocomposites. Results showed that the polymer itself undergoes some change in the presence of the added nanoparticles. This may be the outcome of two different basic factors: adsorption of specific polymer components (ions, chain segments) and/or the nucleation of segregated polymer domains endowed with special properties.
Another key point here was to demonstrate the possibility to combine the properties of the nanocomposites according to the desired application, simply by selecting the concentration and/or the nature of the filler. For example, rGO is the best filler for applications that requires both good electrical conductivity and good thermal stability. Otherwise, GO is the best choice for improvement in the mechanical resistance and/or lower solvent sorption. Carbon nanotubes are the most versatile fillers and suitable for many possibilities of application.
Supplementary Information
Supplementary information is available free of charge at http://jbcs.sbq.org.br as PDF file.
Acknowledgments
We gratefully acknowledge the financial support of CNPq, CAPES, the INCT of Carbon Nanomaterials (CNPq), NENNAM (Pronex F. Araucária/CNPq), INCT of Complex Functional Materials (Inomat and Fapesp) and LACTEC for DMA.
References
1. Potts, J. R.; Dreyer, D. R.; Bielawski, C. W.; Ruoff, R. S.;
Polymer2011, 52, 5.
2. Rahmat, M.; Hubert, P.; Compos. Sci. Technol.2011, 72, 72.
3. Tian, M.; Zhang, J.; Zhang, L.; Liu, S.; Zan, X.; Nishi, T.; Ning, N.; J. Colloid Interface Sci.2014, 430, 249.
4. Xu, J.-Z.; Zhong, G.-J.; Hsiao, B. S.; Fu, Q.; Li, Z.-M.; Prog. Polym. Sci.2014, 39, 555.
5. Dong, B.; Liu, C.; Zhang, L.; Wu, Y.; RSC Adv.2015, 5, 17140.
6. Verdejo, R.; Bernal, M. M.; Romasanta, L. J.; Lopez-Manchado, M. A.; J. Mater. Chem.2011, 21, 3301.
7. Spitalsky, Z.; Tasis, D.; Papagelis, K.; Galiotis, C.; Prog. Polym. Sci.2010, 35, 357.
8. Chang, J.; Ho, A.; Chin, W.-K.; J. Polym. Sci., Part B: Polym. Phys.2007, 45, 322.
9. Tan, B.; Thomas, N.; J. Membr. Sci.2016, 514, 595. 10. Gibson, R. F.; Compos. Struct.2010, 92, 2793.
11. Leng, J.; Lau, A. K.-t.; Multifunctional Polymer Nanocomposites; CRC press: Boca Raton, 2010.
12. Antunes, M.; Velasco, J. I.; Prog. Polym. Sci.2014, 39, 486. 13. Leung, S.; Khan, M.; Naguib, H.; Dawson, F.; Appl. Phys. Lett.
2014, 104, 081904.
14. Asthana, A.; Maitra, T.; Büchel, R.; Tiwari, M. K.; Poulikakos, D.; ACS Appl. Mater. Interfaces2014, 6, 8859.
15. Matos, C. F.; Galembeck, F.; Zarbin, A. J. G.; Carbon2012,
50, 4685.
16. Matos, C. F.; Galembeck, F.; Zarbin, A. J. G.; Carbon2014,
78, 469.
17. Schnitzler, M. C.; Oliveira, M. M.; Ugarte, D.; Zarbin, A. J. G.;
Chem. Phys. Lett.2003, 381, 541.
18. Mehl, H.; Matos, C. F.; Neiva, E. G.; Domingues, S. H.; Zarbin, A. J. G.; Quim. Nova2014, 37, 1639.
19. Moraes, R. A.; Matos, C. F.; Castro, E. G.; Schreiner, W. H.; Oliveira, M. M.; Zarbin, A. J. G.; J. Braz. Chem. Soc. 2011, 22, 2191.
20. Galembeck, F.; Leite, C. A. P.; do Carmo, M.; da Silva, V.; Keslarek, A. J.; Costa, R.; Teixeira‐Neto, É.; Rippel, M. M.; Braga, M.; Macromol. Symp.2002, 189, 15.
21. Gong, X.; Liu, J.; Baskaran, S.; Voise R. D.; Young, J. S.; Chem. Mater.2000, 12, 1049.
22. Shin, B.; Bae, W.; Lee, H.; Kim, H. In Studies in Surface Science and Catalysis, vol. 153; Park, S.-E.; Chang, J.-S.; Lee, K.-W., eds.; Elsevier: Amsterdam, 2004, p. 381.
23. Dufresne, A.; Paillet, M.; Putaux, J.; Canet, R.; Carmona, F.; Delhaes, P.; Cui, S.; J. Mater. Sci.2002, 37,3915.
24. Shamir, D.; Siegmann, A.; Narkis, M.; J. Appl. Polym. Sci.2010,
115, 1922.
25. Pham, V. H.; Dang, T. T.; Hur, S. H.; Kim, E. J.; Chung, J. S.;
ACS Appl. Mater. Interfaces2012, 4, 2630.
26. Tkalya, E.; Ghislandi, M.; Alekseev, A.; Koning, C.; Loos, J.;
J. Mater. Chem.2010, 20, 3035.
27. Wu, J.; Huang, G.; Li, H.; Wu, S.; Liu, Y.; Zheng, J.; Polymer
2013, 54, 1930.
28. Cui, Y.; Kundalwal, S. I; Kumar, S.; Carbon2016, 98, 313. 29. Etmimi, H. M.; Sanderson, R. D.; Macromolecules2011, 44,
8504.
30. Dreyer, D. R.; Park, S.; Bielawski, C. W.; Ruoff, R. S.; Chem. Soc. Rev.2010, 39, 228.
32. Rezende, C. A.; Bragança, F. C.; Doi, T. R.; Lee, L.-T.; Galembeck, F.; Boué, F.; Polymer2010, 51, 3644.
33. Patole, A. S.; Patole, S. P.; Kang, H.; Yoo, J.-B.; Kim, T.-H.; Ahn, J.-H.; J. Colloid Interface Sci.2010, 350, 530.
34. López-Manchado, M. A.; Biagiotti, J.; Valentini, L.; Kenny, J. M.; J. Appl. Polym. Sci. 2004, 92, 3394.
35. Song, S. H.; Kim, J. M.; Park, K. H.; Lee, D. J.; Kwon, O. S.; Kim, J.; Yoon, H.; Chen, X.; RSC Adv. 2015, 5, 81707.
36. Higginbotham, A. L.; Lomeda, J. R.; Morgan, A. B.; Tour, J. M.; ACS Appl. Mater. Interfaces2009, 1, 2256.