Printed in Brazil - ©2007 Sociedade Brasileira de Química 0103 - 5053 $6.00+0.00
A
r
t
ic
le
A
r
t
ic
le
A
r
t
ic
le
A
r
t
ic
le
A
r
t
ic
le
*e-mail: [email protected]
Methods for Vanadium Determination in Fuel Oil by GF AAS
with Microemulsification and Acid Digestion Sampling
Fábio Alan C. Amorim,a,b Daniel C. Lima,Joana A. A. Amaro,a Maria Goreti R. Valea,c and Sérgio L. C. Ferreira*,a
a
Instituto de Química, Universidade Federal da Bahia, Campus Universitário de Ondina, 40170-290 Salvador-BA, Brazil
b
Instituto de Ciências Ambientais e Desenvolvimento Sustentável, Universidade Federal da Bahia, Campus Universitário Edgard Santos, 47805-100 Barreiras-BA, Brazil
c
Petrobrás-Petróleo Brasileiro, Refinaria Landulfo Alves, Rodovia BA 523 Km 4, 43970-000 São Francisco do Conde-BA, Brazil
d
Instituto de Química, Universidade Federal do Rio Grande do Sul, Av. Bento Gonçalves, 9500, 91501-970 Porto Alegre-RS, Brazil
Dois métodos para determinação de vanádio em óleo combustível são propostos utilizando GF AAS. O primeiro é baseado na preparação de uma microemulsão da amostra que é diretamente injetada no tubo de grafite. As temperaturas de pirólise e atomização, 1500 e 2700 °C, respectivamente, foram otimizadas a partir das curvas de temperatura. Para este procedimento obteve-se um limite de detecção de 0,10 µg g-1 e uma massa característica de 87 pg. O outro
método utiliza digestão da amostra com ácido sulfúrico, ácido nítrico e peróxido de hidrogênio. As temperaturas de pirólise e atomização, otimizadas, foram 1000 e 2700 °C, respectivamente. Para este procedimento, obteve-se um limite de detecção de 0,25 µg g-1 e uma massa característica
de 63 pg. A exatidão de ambos os métodos foi confirmada pela análise do material de referência certificado NIST SRM 1634c-trace metals in fuel oil.
Two methods for vanadium determination in fuel oil are proposed using GF AAS. The first is based on the preparation of a microemulsion followed by direct injection into the graphite tube. The pyrolysis and atomization temperatures, 1500 and 2700 °C, respectively, were chosen from the temperature curves. This procedure allows determination of vanadium with a detection limit of 0.10 µg g-1 and characteristic mass of 87 pg. The other method uses total acid digestion
of the sample with sulfuric acid, nitric acid and hydrogen peroxide. In this procedure, the pyrolysis and atomization temperatures recommended were 1000 and 2700 °C, respectively. Among the analytical characteristics for this method are a detection limit of 0.25 µg g-1 and a characteristic
mass of 63 pg. The accuracy of both procedures was confirmed by the determination of vanadium in the certified reference material NIST SRM 1634c-trace metals in fuel oil.
Keywords: vanadium, fuel oil, microemulsion, digestion sample, GF AAS
Introduction
The determination of metals and non-metals in petroleum and its derivatives is of great interest regarding the quality of oil and for environmental aspects. The most difficult part is usually the sample preparation, the most reliable procedure being ashing of the sample and analysis of the residue after taking up in hydrochloric acid.1
However, this procedure is quite tedious and requires careful control to avoid analyte losses, and even microwave-assisted digestion procedures require relatively long time.2
Graphite Furnace Atomic Absorption Spectrometry (GF AAS) is offering advantages over other techniques since the results from a simple dilution with an organic solvent and ashing were found to be practically identical.3,4
under these conditions.5,6 The formation and analysis of
an oil-in-water emulsion or microemulsion instead of a dilution of the oil sample with an organic solvent has been proposed to avoid this problem.7-11
Fuel oil is a highly viscous residual fraction of petroleum distillation, containing parafinic, naphthenic, and aromatic hydrocarbons. It is mainly used in equipment for heat generation (ovens and boilers), thermal energy and as raw material for obtaining of diesel, lubricating oil, coke and asphalt.12
Vanadium is one of the most abundant metals in petroleum and has been evaluated carefully in order to reduce problems during the industrial production process, since it is a catalyst poisoning and causes corrosion.13
Considering the importance of vanadium, several methods have been proposed for its determination in crude oil14-18
and petroleum products, such as: lubricating oil,19,20 heavy
oil,21,22 diesel and asphaltene,8 naphtha and gas oil,23,24
gasoline.25 The content of vanadium in fuel oil has to be
controlled because it can cause incrustation, corrosion and also efficiency loss in furnaces and boilers,26 besides its
contribution to the environmental pollution27 and of cause
problems to human health.28-30 There are few works
developed for the determination of vanadium in fuel oil using spectroanalytical techniques such as flame atomic absorption spectrometry (FAAS),31 inductively coupled
plasma optical emission spectrometry (ICP OES),11
inductively coupled plasma mass spectrometry (ICP-MS),32
and GF AAS.23
In the present paper, two sample treatment approaches based on sample microemulsification and acid digestion aiming at the vanadium determination in fuel oil by GF AAS were established and compared.
Experimental
Instrumentation
All experiments were carried out using a Varian Model Spectra AA 220Z electrothermal atomic absorption spectrometer with Zeeman-effect background correction, equipped with a Model PSD 100 auto sampler. Pyrolytic graphite coated tubes without platform, were used throughout. Argon 99.996% was used as the purge gas. The vanadium hollow cathode lamp (Varian) was operated with a current of 20 mA, and the analytical line at 318.5 nm was used with a spectral bandwidth of 0.2 nm. An Ultrasonic Benchtop Cleaner VWR Model 75 D (Cortland, New York, USA) was used for microemulsion preparation. The sample acid digestion was carried out in a hot-plate QUIMIS model Q 313/22 (Diadema, São Paulo).
Reagents and solutions
Aqueous vanadium standards were prepared by sequential dilution of a 1000 mg L-1 atomic absorption
stock solution (Merck, Darmstadt, Germany). Xylene, propan-1-ol, MIBK, hydrogen peroxide, and concentrated nitric and sulfuric acids of suprapur quality (Merck) were used. Ultrapure water was obtained from an Easypure RF
water purification system (18.3 MΩ cm, Barnstedt,
Dubuque, IA, USA).
Laboratory glassware was kept overnight in 10% (v/v) nitric acid solution. Before use the glassware was rinsed with deionized water and dried in a dust-free environment.
The standard reference material SRM 1634c trace metals in fuel oil (National Institute Standards and Tecnology, NIST) was used to check the accuracy.
Preparation of microemulsions
The composition and mode of preparation of the microemulsion was based on previous work described by Aucélio and Curtius.33 About 0.1 g of the sample or
base mineral oil (in case of the blank) was dissolved in 2.0 mL of xylene to reduce the viscosity. An aliquot of 0.5 mL of concentrated nitric acid was added and the mixture placed in an ultrasonic bath for 5 min. Then, 0.5 mL of water and 2.0 mL of MIBK were added, and completed to 10.0 mL with propanol. The mixture was then vigorously shaken, for 1 min, in order to mix the components and a one-phase micro-emulsion was obtained. All calibration solutions were prepared in the same way as microemulsions using inorganic standards and base mineral oil.
Acid digestion procedure
Temperature program
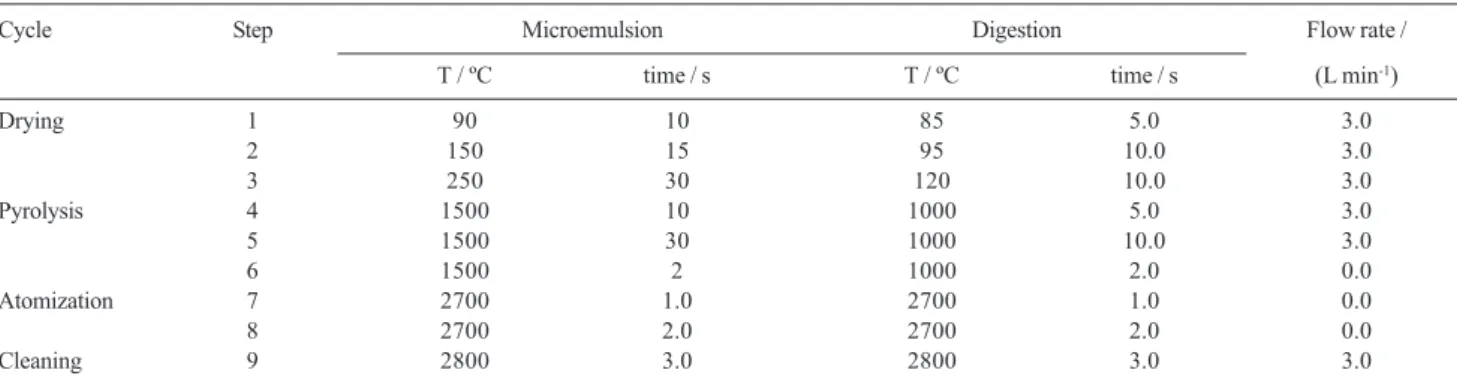
Pyrolysis and atomization curves were established for the microemulsified samples and acid digested samples to optimize these temperatures. The drying time, drying temperature, pyrolysis time, gas flow and clean step were fixed as recommended by the instrument manufacturer for each matrix type, and are listed in Table 1. Integrated absorbance (peak area) was used exclusively for signal evaluation and quantification.
Results and Discussion
Temperature curves
The pyrolysis and atomization curves for fuel oil sample in microemulsion and after digestion are shown in Figure 1. Vanadium was stable up to a pyrolysis temperature of 1600 ºC. Considering the organic load in the matrix, a pyrolysis temperature of 1500 ºC for microemulsions was established to guarantee the complete elimination of the matrix without loss of signal. For the digested samples the temperature was fixed in 1000 ºC, considering the pyrolysis curve and the recommendation of the instrument manufacturer for this matrix type. An atomization temperature of 2700 ºC was used for both methods, which is in agreement with literature data for longitudinally heated graphite tubes.34
The optimized graphite furnace temperature program is given in Table 1.
Analytical characteristics
The linear regression equations, the correlation coefficient, the characteristic mass and limit of detection for the two sample preparation procedures are presented in Table 2.
The method based on direct analysis of the sample in microemulsion showed a linear response from 0.3 µg g-1 to at least 30 µg g-1 with a correlation coefficient of
0.9989. The repeatability, expressed as relative standard deviation (RSD%) for eight consecutive measurements of solutions containing 5.0 and 20 µg g-1 of vanadium
was 1.9% and 0.8%, respectively. The limit of detection (LOD), based on three times the standard deviation of the blank signals (n=8), the limit of quantification (LOQ), based on ten times the standard deviation of the blank signals (n=8), and characteristic mass (m0) were 0.10 µg g-1, 0.3 µg g-1 and 87 pg, respectively.
The calibration curves for inorganic vanadium standards in digested blank showed a linear response from 0.8 µg g-1 to 30 µg g-1 with a correlation
coefficient of 0.9978. The repeatability was 5.1% and 5.0%, respectively, for solutions containing 5.0 and 20 µg g-1 of vanadium. The limit of detection, limit of
quantification and characteristic mass were 0.25 µg g-1, 0.8 µg g-1 and 63 pg, respectively.
Table 1. Graphite furnace temperature program for determination of vanadium in fuel oil samples using microemulsions and acid digested samples
Cycle Step Microemulsion Digestion Flow rate /
T / ºC time / s T / ºC time / s (L min-1)
Drying 1 90 10 85 5.0 3.0
2 150 15 95 10.0 3.0
3 250 30 120 10.0 3.0
Pyrolysis 4 1500 10 1000 5.0 3.0
5 1500 30 1000 10.0 3.0
6 1500 2 1000 2.0 0.0
Atomization 7 2700 1.0 2700 1.0 0.0
8 2700 2.0 2700 2.0 0.0
Cleaning 9 2800 3.0 2800 3.0 3.0
Figure 1. Pyrolysis and atomization curves for an estimated content (18 µg g-1) of vanadium in fuel oil sample prepared in (z) microemulsion and (U)
Accuracy of the methods and application
The accuracy of the methods was evaluated by the analysis of the certified reference material NIST 1634c Traces Elements in Fuel Oil. The results obtained with both methods are shown in Table 3. Statistical evaluation using a t-student test showed that there is no significant difference between the values obtained from the proposed methods and the certified value, adopting a 95% confidence level.
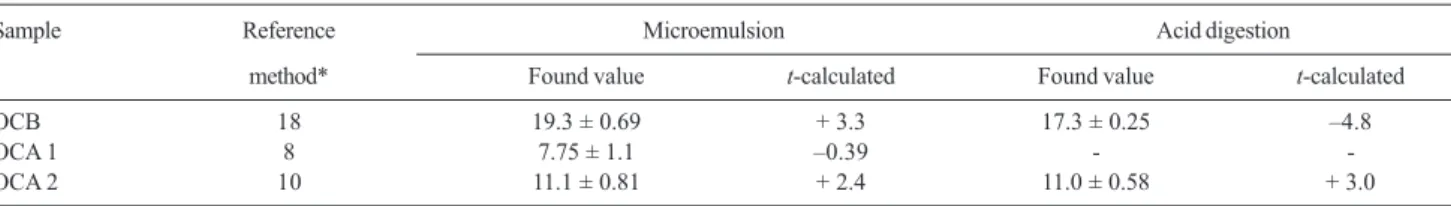
The methods were applied to determine the concentration of vanadium in three fuel oil samples, one of fuel oil with low content of sulphur (OCB), and two of fuel oil with high content of sulphur (OCA 1 and OCA 2). The vanadium content of which has been determined previously in a different laboratory, using a reference method based in open vessel acid digestion on hot plate until drying, throughout calcinations in oven muffle about 12 h followed of acid dissolution and determination of vanadium by FAAS.35 The results are presented in Table 4. The statistical
comparison by t-student test showed no significant difference between the methods on a 95% confidence level.
Conclusions
The analytical features (precision, limit of detection and accuracy) demonstrated the feasibility of the proposed procedure using microemulsions for the direct determination of vanadium in fuel oil samples using GF
AAS. The use of the standard calibration technique with microemulsions, prepared using inorganic standards and base mineral oil makes the procedure quite simple and fast. The results demonstrated that the methods could be satisfactorily applied for analysis of fuel oil samples.
Acknowledgments
The authors are grateful to Conselho Nacional de Desenvolvimento Científico e Tecnológico (CNPq/CT-PETRO), to Coordenação de Aperfeiçoamento de Pessoal de Nível Superior (CAPES) and to Fundação de Amparo à Pesquisa do Estado da Bahia (FAPESB) for financial support. We are also indebted to Prof. Dr. Bernhard Welz for the revision and contributions on this manuscript.
References
1. Platteaub, O.; Carrillo, M.; Fuel 1995, 74, 761.
2. Costa, L. M.; Ferreira, S. L. C.; Nogueira, A. R. A.; Nóbrega, J. A.; J. Braz. Chem. Soc. 2005, 16, 1269.
3. Bruhn, C. F.; Cabalín, V. G.; Anal. Chim. Acta 1983, 147, 193. 4. Bermejo-Barrera, P.; Pita-Calvo, C.; Bermejo-Martínez, F.; Anal.
Lett. 1991, 24, 447.
5. Aucelio, R. Q.; Doyle, A.; Pizzorno, B. S.; Tristão, M. L. B.; Campos, R. C.; Microchem. J. 2004, 78, 21.
6. Vale, M. G. R.; Damin, I. C. F.; Klassen, A.; Silva, M. M.; Welz, B.; Silva, A. F.; Lepri, F. G.; Borges, D. L. G.; Heitmann, U.; Microchem. J. 2004, 77, 131.
Table 4. Results found for vanadium determination (mg g–1) in fuel oil samples by reference method and proposed procedures (n=3)
Sample Reference Microemulsion Acid digestion
method* Found value t-calculated Found value t-calculated
OCB 18 19.3 ± 0.69 + 3.3 17.3 ± 0.25 –4.8
OCA 1 8 7.75 ± 1.1 –0.39 -
-OCA 2 10 11.1 ± 0.81 + 2.4 11.0 ± 0.58 + 3.0
*Results achieved using a reference method.35
Table 3. Vanadium concentration (mg g–1) in certified reference material NIST 1634c trace elements in fuel oil, determined by proposed procedures (n=3)
Method Vanadium concentration t-calculated
Certified value (mean ± S.D.*) Found value (mean ± S.D.)
Microemulsion 28.19 ± 0.4 29.0 ± 2.5 +0.56
Acid digestion 28.19 ± 0.4 27.6 ± 0.56 –1.82
*Standard deviation.
Table 2. Analytical characteristics for determination of vanadium in fuel oil using microemulsions and acid digestion of samples
Method Linear regression equation R LOD / (µg g–1) m
0 / pg
Microemulsion A = 0.00164 + 0.01268 [V / µg g–1] 0.9989 0.10 87
7. Aucélio, R. Q.; Curtius, A. J.; Welz, B.; J. Anal. At. Spectrom. 2000, 15, 1389.
8. Borszéki, J.; Knapp, G.; Halmos, P.; Bartha, L.; Microchim. Acta 1992, 108, 157.
9. Horvath, W. J.; Huie, C. W.; Naslund, H. R.; Microchim. Acta 1995, 17, 207.
10. Aucélio, R. Q.; Curtius, A. J.; J. Anal. At. Spectrom. 2002, 17, 242. 11. Souza, R. M.; Mathias, B. M.; Scarminio, I. S.; da Silveira, C.
L. P.; Aucélio, R. Q.; Microchim. Acta 2006, 153, 219. 12. Farah, M. A.; Characterization of Petroleum and their Products,
Part 1-Fuels, Petrobrás-Petróleo Brasileiro, 1985.
13. Amorim, F. A. C.; Welz, B.; Costa, A. C. S.; Lepri, F. G.; Vale, M. G. R.; Ferreira, S. L. C.; Talanta 2007, 72, 349.
14. Duyck, C.; Miekeley, N.; da Silveira, C. L.; Szatmari, P.; Spectrochim. Acta 2002, 57B, 1979.
15. Molinero, A. L.; Castillo, J. R.; Anal. Lett. 1998, 31, 903. 16. Damin, I. C. F.; Vale, M. G. R.; Silva, M. M.; Welz, B.; Lepri, F.
G.; dos Santos, W. N. L.; Ferreira, S. L. C.; J. Anal. At. Spectrom. 2005, 20, 1352.
17. Lepri, F. G.; Welz, B.; Borges, D. L. G.; Silva, A. F.; Vale, M. G. R.; Heitmann, U.; Anal. Chim. Acta 2006, 558, 195.
18. Souza, R. M.; Saraceno, A. L.; da Silva, C. L.; Aucélio, R. Q.; J. Anal. At. Spectrom. 2006, 21, 1345.
19. Souza, R. M.; Silva, C. L.; Aucélio, R. Q.; Anal. Sci. 2004, 20, 351.
20. Bressani, F. A.; Silva, H. O.; Nóbrega, J. A.; Costa, L. M.; Nogueira, A. R. A.; Quim. Nova 2006, 29, 1210.
21. Nakamoto, Y.; Ishimaru, T.; Endo, N.; Matsusaki, K.; Anal. Sci. 2004, 20, 739.
22. Turunen, M.; Peräniemi, S.; Ahlgrén, M.; Westerholm, H.; Anal. Chim. Acta 1995, 311, 85.
23. Gonzáles, M. C.; Rodríguez, A. R.; Gonzales, V.; Microchem. J. 1987, 35, 94.
24. Meeravali, N. N.; Kumar, S. J.; J. Anal. At. Spectrom. 2001, 16, 527.
25. Santos, D. S. S.; Teixeira, A. P.; Korn, M. G. A.; Teixeira, L. S. G.; Spectrochim. Acta 2006, 61B, 592.
26. Administrative Rule No. 80 of April 30, 1999. Brazilian National Oil Agency (ANP) No. 3/99 Technical Procedure.
27. Pyrzynska, K.; Wierzbicki, T.; Talanta 2004, 64, 823. 28. Barceloux, D. G.; J. Toxicol-Clin. Toxicol. 1999, 37, 265. 29. Sabbioni, E.; Kuèera, J.; Pietra, R.; Vesterberg, O.; Sci. Total
Environ. 1996, 188, 49.
30. Lin, C. Y.; Chiu, C. H.; J. Environ. Sci. Health - Part A: Toxic/Hazard. Subst. Environ. Eng. 1995, 30, 133.
31. Bettinelli, M.; Tittarelli, P.; J. Anal. At. Spectrom. 1994, 9,805. 32. Bettinelli, M.; Spezia, S.; Baroni, U.; Bizzarri, G.; J. Anal. At.
Spectrom. 1995, 10,555.
33. Aucélio, R. Q.; Curtius, A. J.; Analyst 2000, 125, 1673. 34. Welz, B.; Sperling, M.; Atomic Absorption Spectrometry,
3rd ed., Wiley-VCH: Weinheim, 1999.
35. Method UOP 391-91; Trace Metals in Petroleum Products or Organics by AAS, Universal Oil Products Company, 1991.