Article
0103 - 5053 $6.00+0.00
*e-mail: [email protected]
Application of an Accurate and Validated Method for Identification and
Quantification of Acrylamide in Bread, Biscuits and Other Bakery Products Using
GC-MS/MS System
Mioara Negoiță and Alina Culețu*
National Institute of Research & Development for Food Bioresources, IBA Bucharest, 6 Dinu Vintila, 021102 Bucharest, Romania
A gas chromatography tandem mass spectrometry has been developed and validated for the separation, detection, identification and quantification of acrylamide in bread, biscuits and similar products. The method showed good precision with values lower than 6%. A good sensitivity was achieved for bread with 2.41 and 7.23 µg kg-1 limit of detection (LOD) and limit of quantification
(LOQ), respectively, while for biscuits, LOD and LOQ were 4.63 and 13.89 µg kg-1, respectively.
Accuracy obtained through the bias of 2 certified reference materials (“crisp bread - ERM®
-BD272” and “rusk - ERM®-BD274”) gave a value below 1.68-2.52%. The method was applied
by analyzing 49 types of bread, biscuits and other similar products. The results showed different levels of acrylamide in bread (values ranged between 7.6 and 165.6 µg kg-1), biscuits (between
LOD and 2405.0 µg kg-1), sandwich biscuits with cream (112.6-570.4 µg kg-1), biscuits for infants
and young children (between LOD and 801.7 µg kg-1), gingerbread (349.5-955.5 µg kg-1) and
crackers (347.8-366.1 µg kg-1).
Keywords: acrylamide (AA), validation, bread, biscuits, GC-MS/MS
Introduction
Acrylamide (AA) is a chemical that can be formed in some foods during certain types of high-temperature cooking. The neurotoxicity of AA in humans is well established from occupational and accidental exposures, and experimental studies have shown reproductive, genotoxic and carcinogenic effects in animals. AA has been classified as probably carcinogenic to humans by the International Agency for Research on Cancer (IARC).1
The possible public health risks from dietary exposure to AA attracted concern by public authorities all over the world.2
Based on the expert committee evaluation of FAO/ WHO, 1 µg kg-1 body weight (bw) day-1 is considered as
an average exposure to AA while 4 µg kg-1 bw day-1 is
considered as high exposure to AA.3 The mean dietary
exposure range to AA is 0.2-1.0 µg kg-1 bw day-1 for the
general adult population while 95th-percentile range is 0.6-1.8 µg kg-1 bw day-1.4 In 2013, the U.S. Food and Drug
Administration (FDA)5 issued draft guidance to help the
food industry to reduce the amount of AA in certain foods.
Commission Recommendation 2013/647/EU established, based on the monitoring results received from the Member States during the period 2007-2012, the “indicative values” for AA in different foods. The “indicative values” are not safety thresholds, but their aim is to indicate the need for an investigation in the case the values are exceeded and to take appropriate measures to control the formation of AA.6
Taking into account that the presence of AA in food products could increase the risk of cancer in consumers of all ages,7,8 an internationally priority is to develop reliable
analysis method to quantify low concentrations of AA in foods (dozens of ppb) and to find solutions to reduce this contaminant. Worldwide, in recent years several methods have been developed for the determination of AA from food products.9-11
Although in the last decade were published a large number of analytical methods based on gas chromatography
(GC)12-17 and liquid chromatography (LC) coupled with
mass spectrometry (MS; MS/MS),18-22 the methods are
of AA with quantification limits from 30 to 50 µg kg-1 for
HPLC-MS, 4 to 30 µg kg-1 for GC-MS and LC-MS/MS.
Commission recommendation of 2 June 2010, states that for ensuring comparability of analytical results, methods that can achieve a limit of quantification (LOQ) of 30 µg kg-1
for bread and foods for infants and young children and 50 µg kg-1 for potato products, other cereal products, coffee
and other products should be chosen.23
The aim of this study is to present the results obtained on internal validation of GC-MS/MS method for determination of AA in bread, biscuits and other similar products with LOQ below the above recommended values. Moreover, assessing the level of AA in some bakery products from the Romanian market was performed.
Experimental
Sampling
Seventeen types of bread and similar products, 18 types of biscuits, 5 types of biscuits for infants and young children, 4 types of sandwich biscuits, 2 crackers and 3 gingerbread were studied. Samples were either purchased in local market (various types produced in different countries) or produced on a pilot plant of the National Research & Development Institute for Food Bioresources (Romania).
Chemicals and reagents
Native acrylamide (min. 99% purity, concentration 1000 mg L-1 in methanol) (AA) was purchased from Ultra
Scientific (N. Kingstown, Rhode Island, USA), internal standard of labeled acrylamide (1,2,3-13C labelled AA) (IS),
min. 99% purity (+100 ppm hydroquinone) of concentration of 1000 mg L-1 in methanol was from Cambridge Isotope
Laboratories, Inc. (Andover, MA, USA). All other reagents used during the validation of the method for determination of AA were of chromatographic purity from Merck (Darmstadt, Germany), LGC Promochem GmbH (Wesel, Germany) and Scharlau (Sentmenat, Spain). Ultrapure water was obtained through a PURELAB Option-S7 and PURELAB Ultra Ionic system (Elga Labwater, High Wycombe, UK).
Carrez I and II solutions were prepared by dissolving 28.8 g of potassium hexacyanoferrate and 57.6 g of zinc sulfate in 100 mL of water, respectively.
Helium as mobile phase (min. 99.9995%) and argon (min. 99.9995%) as collision gas were used. Samples concentration was achieved under a stream of nitrogen (min. 99.9995%).
Reference test materials ERM-BD272 crispbread
(AA content of 980 ± 90 µg kg-1) and ERM
-BD274 rusk
(AA content of 74 ± 7 µg kg-1) were certified at the BAM
Federal Institute for Materials Research and Testing (Berlin, Germany) to verify the accuracy of the method.
Preparation of stock and working solutions
Stock solution of AA (100 mg L-1) and IS (100 mg L-1)
were prepared in amber vials by dissolving in ultrapure water. Working solutions I, II and III (10, 1 and 0.1 mg L-1
of AA, respectively) and working solution I (10 mg L-1)
of IS were prepared by diluting the stock solution with ultrapure water. All stock and working solutions were kept in a refrigerator at 4 °C.
Sample preparation
The procedure of sample preparation for AA quantification in bread, biscuits and other bakery products was according to previous study13-15 with some
modifications24,25 regarding sample preparation (sample
preparation for soft bread, sample weight taken for analysis, quantities and volumes for reagents) and AA analysis by GC-MS/MS in selected reaction monitoring (SRM) acquisition mode, respectively. Briefly, the steps were as follow:
Drying, milling and weighting
Only fresh bread samples were dried in an oven at 90 °C, for 120 min, while biscuits and other similar products were used as they were. The samples were fine milled using a Retch GM 200 mill (Germany) and an ultra centrifugal ZM 200 mill (Germany). In a centrifuge vial of 50 mL, 3 g of “bread and other similar products” and 1.5 g from “biscuits and other similar products” category were weighed for AA analysis, respectively.
AA extraction in water
Over the sample weighed, working solution I of the IS of 10 mg L-1 (110 µL) and 30 mL ultrapure water at 60 °C
were added. Extraction in water at pH 4-5 was achieved by addition of 20-40 µL of glacial acetic acid, followed by deproteinization with 400 µL Carrez I and II solutions and centrifugation (6000 × g) at 5 °C, for 30 min.
AA derivatization
The supernatant obtained was derivatized with 7.5 g KBr, 40-100 µL HBr (pH 1-3), 10 mL saturated bromine-water solution (around 1.6%) on a shaking water bath below 4 °C, for at least 2 h. After the end of the derivatization reaction, bromine in excess was removed by adding around 1-2.5 mL of 1 mol L-1 sodium thiosulfate,
Extraction of dibromo derivative of AA 2,3-dibromopropanal (2,3-DBPA)
It was achieved with 70 mL mixture of ethyl acetate and hexane (4:1, v/v).
2,3-DBPA
The concentrationwas achieved in a first step using a vacuum evaporation system (Rotovapor R-210, BUCHI Labortechnik AG, Germany) till 2 mL, followed in a second step by dryness under a stream of nitrogen.
2,3-DBPA purification and concentration
The residue dissolved in 50 mL hexane was purified on a glass column filled with activated Florisil and calcinated sodium sulfate, previously conditioned with 20 mL hexane. The 2,3-DBPA derivative was eluted with acetone, then concentrated till dryness and the residue was redissolved in 400 µL ethyl acetate and 40 µL triethylamine. The final solution was filtered through a 0.2 µm regenerated cellulose microfilter (17 mm diameter, Spartan 13RC, Whatman GmbH, Dassel, Germany) directly in a vial and analyzed by GC-MS/MS in SRM mode.
Preparation of the calibration solutions
A blank and 7 calibration levels in the range 0.1-7.5 mg L-1
were prepared in flasks of 250 mL. In each flask, the following were added: 100 mL ultrapure water, 110 µL IS of 10 mg L-1 and working solution II/I of AA (1 mg L-1per
10 mg L-1) according to the calibration level. These solutions
were derivatized in the same manner as the derivatization steps described for bread, biscuits and other similar samples, without purification and the final residue was redissolved in 1000 µL ethyl acetate and 100 µL triethylamine.
GC-MS/MS-SRM analysis
The calibration solutions and the derivatized sample extracts were analyzed using a gas chromatograph (TRACE GC ULTRA) coupled with triple quadrupole mass spectrometer (TSQ Quantum XLS) from Thermo Fisher Scientific (USA). The analysis was performed in the electron impact positive ionization mode (EI+);
acquisition mode: “selected reaction monitoring-SRM” and ion scanning mode: “product”.
The determination was carried out with a capillary column based on polyethylene-glycol (30 m × 0.25 mm internal diameter; 0.25 µm) (TraceGOLD™ TG-WaxMS, Thermo Fisher Scientific, USA). The mobile phase was helium with a constant flow rate of 1.6 mL min-1. 1 µL
sample was injected in a Right PTV type injector using
TriPlus AS autosampler (Thermo Fisher Scientific, USA), in a split mode with a split ratio of 1:10 and injector temperature of 220 °C. Under these conditions, the retention time of AA and of the IS was of 10.65 ± 0.5 min. AA and IS were identified by the ion fragments corresponding to the derivatized ions, 2-BPA (2-bromopropenamide) and 2-BP(13C
3)A. The fragmentation of the precursor ions
with m/z 151 and 154 was achieved with argon (1 mTorr), leading to the formation of product ions (daughter) with m/z 70 (2-BPA) and 73 (2-BP(13C
3)A), being used for
quantification. The calculation of the AA concentration in the test samples was based on the ratio of the peak area corresponding to the product ions, with m/z 70 and 73 for 2-BPA and 2-BP(12C
3)A, respectively.
For bread samples and other similar products, AA concentration was calculated based on equation 1, while for biscuits and other similar products using equation 2.
Ccalc. = [440 × C× (100 – U1)]/[w × (100 – U2)] µg kg-1 (1)
Ccalc.= C× 440/wµg kg-1 (2)
where Cis the 2-BPA concentration measured by the instrument in the food sample (mg L-1), C
calc. is the 2-BPA
concentration calculated for the food sample (µg kg-1), U 1
is the moisture content of the bread sample before drying (%), U2 is the moisture content of the bread sample after
drying (%), w is the weight of the sample (g), 440 is the final volume of the sample extract (µL).
Validation procedure
The method was validated according to the guides and recommendations for methods validation.26-31 The following
performance parameters were assessed:
Calibration curve and linearity
Calibration curve and linearity were verified by the method of least squares in the range 0.1-7.5 mg L-1, choosing
the method of the internal standard. The calibration curve was obtained based on derivatized standard solutions and plotting the ratio of the peak area of 2-BPA and 2-BP(13C)A
against the concentration of 2-BPA. The calibration model was considered correct if relative standard deviation (RSD) in repeatability conditions was within the limits of ± 15% for all the levels investigated. The correlation was assessed to be linear for a value greater than 0.99 for the correlation coefficient (R).
Linearity range
native AA (10 mg L-1) at different levels of concentration:
40; 75; 80; 150; 225 and 300 µg kg-1 (bread and other
similar products) and 250; 500; 750; 1000 and 2000 µg kg-1
(biscuits and other similar products). The ratio of the peak area of 2-BPA and 2-BP(13C)A against the concentration
of 2-BPA from the food samples studied was plotted. The correlation was assessed to be linear for a value greater than 0.99 for the correlation coefficient (R).
Sensitivity
Sensitivity was characterized by limit of detection (LOD) and limit of quantification (LOQ). Assessment of LOD and LOQ for AA analysis in bread and similar products by GC-MS/MS were performed applying IUPAC approach, while ICH approach was used for biscuits and other similar products. The criteria imposed for LOQ were: precision (expressed as relative standard deviation, RSD ≤ 20%) and accuracy (expressed as recovery in the range 80-120%).
Selectivity
Selectivity was verified by observing the possible interference given by AA in bread, biscuits and other similar products.32 Specificity was achieved by SRM detection.
Precision
Precision was determined by repeatability (injection and analysis repeatability), inter-laboratory reproducibility and intermediate precision. Injection repeatability was achieved by carrying out between 9 and 10 consecutive injections in a short period of time (the same day). Analysis repeatability (intra-day) was determined by 5-6 repeated analyses of the same sample, in the same day by the same analyst and under the same experimental conditions. Inter-laboratory reproducibility (inter-day) was achieved through Food Analysis Performance Assessment Scheme (FAPAS)33 of the Central Science
Laboratory (FERA). Intermediate precision (inter-day) was carried out by repeated analyses of the same sample in 3 different days by the same analyst and under the same experimental conditions. Repeatability and intermediate precision was expressed as RSD (%), while inter-laboratory reproducibility as z-score.
Accuracy
The accuracy of the method was evaluated with recovery and bias measurements for 2 reference test materials. The recovery percentage (R%) of the method was established from minimum 6 repeated analysis of the same sample fortified with working solution II of AA at different concentrations.
Robustness
To assess the robustness of the method developed in the laboratory, the following parameters were varied: volume of hexane used in the purification of the extracts, derivatization time and mobile phase flow. It was considered that the method is robust for the parameters investigated, whether obtained under repeatability conditions RSD or reproducibility was below 2%.
Measurement uncertainty
The uncertainty sources were identified and analyzed and the uncertainty budget was estimated, according to the reference documents.34,35 Expanded uncertainty (U
∆) was calculated by multiplying the combined standard uncertainty (Uc) with a coverage factor (k = 2) for a
confidence level of 95%.
Method application
The validated and developed method was applied by analyzing different products presented in Tables 1-8. The AA level was also studied in different batches of the same brand (3 batches × 2 types of breads; 2 batches × 5 types of biscuits).
Statistical analysis
AA content was expressed as mean ± standard deviation. The differences among sample groups were analyzed by one-way ANOVA (analysis of variance) followed by Tukey’s test, p < 0.05 was considered statistically significant.
Regarding validation parameters, average for concentration values, Ccalc (µg kg-1), standard deviation in
repeatability SD(r) and reproducibility conditions SD(R) in µg kg-1 as well as relative standard deviation in repeatability
RSD(r) and reproducibility conditions RSD(R) in % were calculated using Microsoft Excel. The repeatability and reproducibility limits in µg kg-1 were also considered,
where the ratio between repeatability and reproducibility is 2.8 × SD(r)/SD(R) for a confidence level of 95%.
Results and Discussion
An overview of the test samples together with their coding and AA content is given in Tables 1-8.
Calibration curve and linearity
The calibration curve for the determination of AA in bread, biscuits and other similar products by GC-MS/MS analysis (y = 0.8613x + 0.0332) was linear over the range of 0.1-7.5 mg L-1. R was between 0.9996-1, which proves
a high linearity degree. The results showed that RSD(r) for all the levels of concentration studied ranged between 0.1 and 7.8%, being within the limits of ± 15%.
The linearity range was verified according to ISO36 for
bread, biscuits and other similar products, respectively. The linearity range of the method for AA analysis was in the range of: 7.23-312.88 µg kg-1 (R > 0.998) for bread
and similar products (n = 23) and 17.59-2191.41 µg kg-1
(R > 0.999) for biscuits and similar products (n = 42), respectively, n denotes the number of the analyzed samples. The results obtained are in line with a recent study,37 which
reported an LC-MS/MS method for AA determination
in different types of breads, with a linear range of up to 750 µg kg-1 food and a determination coefficient of 0.999.
Sensitivity
For bread and similar products, LOD and LOQ obtained were 2.41 and 7.23 µg kg-1, respectively. For
biscuits and similar products,LOD and LOQ were: 4.63 and 13.89 µg kg-1, respectively. LOQ valuesfulfilled the
two criteria (RSD < 10% and recovery between 93.68 and 102.93%).
LOQ value for the present method was below 30 µg kg-1
which fulfils the criteria defined in European Commission recommendation on the monitoring of AA levels in food.23
Also, the results obtained are in accordance with a previous GC-MS study, which reported LOD and LOQ values of 2 and 5 µg kg-1, respectively for bread samples.14
The working range reached from 2.41-2191.41 µg kg-1
AA in a food sample.
Selectivity
Selectivity was demonstrated by chromatographic separation of AA in the presence of other components from the food matrix (bread, biscuits and similar products).
For specificity, SRM detection and the use of IS method lead to a specific analysis. The retention time of AA within laboratory condition for the samples was almost identical with the retention time of the IS, which fits in the Table 1. Bread and similar products produced in the pilot plant
Main ingredients AAa / (µg kg-1)
Pan bread white wheat flour type 550, type 2200
19.5 ± 0.5 a
White bread white wheat flour type 550 11.3 ± 0.4 b Bread stick white wheat flour, dark wheat
flour
26.2 ± 1.1 c
Bread stick with olive white wheat flour 47.9 ± 1.5 d Bread stick with nut white wheat flour 41.6 ± 1.6 e Bread stick with onion white wheat flour 87.3 ± 1.8 f
aAA: acrylamide; data shown as mean ± SD (n = 3) for the amount of AA;
means followed by different letters are significantly different (p < 0.05).
Table 2. Bread and similar products (origin: retail store, produced in Romania)
Sample, producer
code Main ingredients AA
a / (µg kg-1)
White bread 60/R white wheat flour 7.6 ± 0.3 a
Round sliced bread 31/M whole wheat flour, dark wheat flour 61.3 ± 0.7 b
Whole toasted bread 32/M whole wheat flour, dark wheat flour, malt flour different batches
115.2 ± 0.3 c
33/M 49.7 ± 0.3 d
34/M 57.2 ± 0.4 e
White bread with sage seeds 35/M white wheat flour 28.0 ± 0.5 f
Hypoglucidic sliced bread 36/M white wheat flour, bran, dark wheat flour 104.5 ± 0.3 g
Whole wheat toasted bread 37/T whole wheat flour, fermented wheat flour, soy flour 165.6 ± 1.3 h Whole wheat bread 38/T whole wheat flour, fermented wheat flour, soy flour
different batches
56.9 ± 0.3 i
39/T 62.2 ± 0.1 b
47/T 79.8 ± 0.2 j
German bread with seeds 40/T dark wheat flour, rye flour, wheat bran, wheat malt flour 52.2 ± 0.4 k
Transylvanian dark bread 41/U dark wheat flour 21.3 ± 0.1 l
Bread with dark flour and bran 42/V dark and white wheat flour, wheat bran, malt flour 37.4 ± 0.1 m Whole toasted bread 43/S dark and white wheat flour, rye flour, soy flour, malt flour, rice flour 46.0 ± 0.3 n
tolerance of ± 0.5% imposed by Commission Decision (2002/657/CE).30 For AA quantification, ion m/z 70
(2-BPA) and ion m/z 73 for IS (2-BP(12C
3)A) were used.
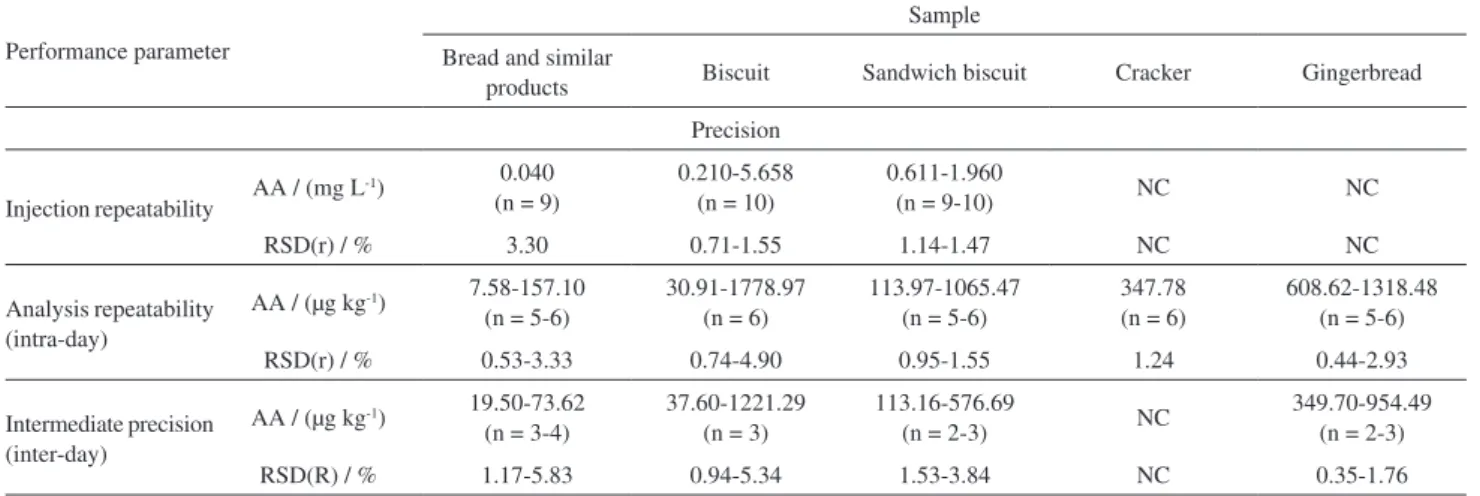
The values obtained for injection and analysis repeatability, intermediate precision are presented in Table 9.
RSD(r) was between 0.71 and 3.30% for injection repeatability and between 0.44 and 4.90% for repeatability analysis, respectively. The RSD(R) intermediate precision was between 0.35 and 5.83%. The applied method showed a good precision, RSD < 10% for AA analysis in bread, biscuits and similar products and the results were within the limits set by the following regulations: VICH GL49,28
CAC/GL 16,29 EC.30
The AA result for crispbread sample from the FAPAS proficiency test (laboratory No. 24) showed a value of 193.77 µg kg-1 (z-score of 0.2), which fulfilled the
acceptability criteria from the organization.33
Method accuracy
The bias obtained for the two reference materials were: 1.68% (n = 39) for ERM
-BD272 crispbread and 2.52% (n = 30) for ERM-BD274 rusk, respectively. The
described method demonstrated a satisfactory accuracy, between 99.59 and 102.28% for bread and similar products and between 95.44 and 104.63% for biscuits and similar products.
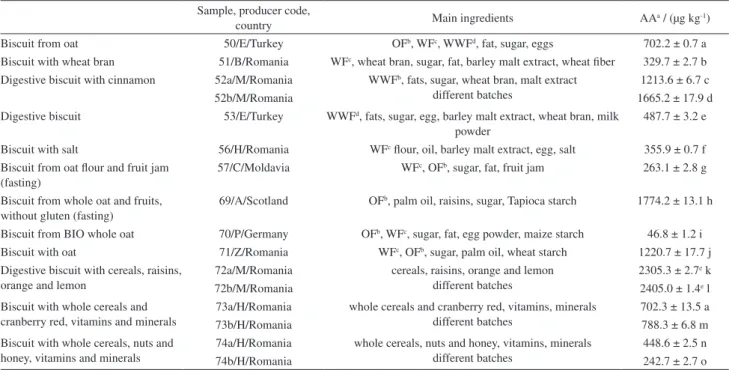
Table 4. Biscuits samples (origin: retail store, produced in different countries)
Sample, producer code,
country Main ingredients AAa / (µg kg-1)
Biscuit from oat 50/E/Turkey OFb, WFc, WWFd, fat, sugar, eggs 702.2 ± 0.7 a
Biscuit with wheat bran 51/B/Romania WFc, wheat bran, sugar, fat, barley malt extract, wheat fiber 329.7 ± 2.7 b
Digestive biscuit with cinnamon 52a/M/Romania WWFb, fats, sugar, wheat bran, malt extract
different batches
1213.6 ± 6.7 c
52b/M/Romania 1665.2 ± 17.9 d
Digestive biscuit 53/E/Turkey WWFd, fats, sugar, egg, barley malt extract, wheat bran, milk
powder
487.7 ± 3.2 e
Biscuit with salt 56/H/Romania WFc flour, oil, barley malt extract, egg, salt 355.9 ± 0.7 f
Biscuit from oat flour and fruit jam (fasting)
57/C/Moldavia WFc, OFb, sugar, fat, fruit jam 263.1 ± 2.8 g
Biscuit from whole oat and fruits, without gluten (fasting)
69/A/Scotland OFb, palm oil, raisins, sugar, Tapioca starch 1774.2 ± 13.1 h
Biscuit from BIO whole oat 70/P/Germany OFb, WFc, sugar, fat, egg powder, maize starch 46.8 ± 1.2 i
Biscuit with oat 71/Z/Romania WFc, OFb, sugar, palm oil, wheat starch 1220.7 ± 17.7 j
Digestive biscuit with cereals, raisins, orange and lemon
72a/M/Romania cereals, raisins, orange and lemon different batches
2305.3 ± 2.7e k
72b/M/Romania 2405.0 ± 1.4e l
Biscuit with whole cereals and cranberry red, vitamins and minerals
73a/H/Romania whole cereals and cranberry red, vitamins, minerals different batches
702.3 ± 13.5 a
73b/H/Romania 788.3 ± 6.8 m
Biscuit with whole cereals, nuts and honey, vitamins and minerals
74a/H/Romania whole cereals, nuts and honey, vitamins, minerals different batches
448.6 ± 2.5 n
74b/H/Romania 242.7 ± 2.7 o
aAA: acrylamide; data shown as mean ± SD (n = 3) for the amount of AA; means followed by different letters are significantly different (p < 0.05); bOF:
oat flour; cWF: wheat flour; dWWF: whole wheat flour; ethe AA levels were higher than the maximum value of the working range, but in order to quantify
it, the samples weight taken for analysis was lower (0.75 g instead of 1.5 g). Table 3. Biscuits samples produced in the pilot plant
Main ingredients AAa / (µg kg-1)
Biscuit from rice flour RFb, fat, sugar, eggs 31.3 ± 0.6 a
Biscuit from white wheat flour WFc, fat, sugar, eggs 152.0 ± 2.9 b
Biscuit from white wheat and oat flour WFc 75%, OF 25%, fat, sugar, eggs 148.9 ± 2.7 b
Biscuit from white wheat and oat flour WFc 50%, OF 50%, fat, sugar, eggs 359.0 ± 4.2 c
Biscuit from whole oat flour OFd 100%, fat, sugar, eggs 346.3 ± 2.3 d
Biscuit from oat and bran flour OFd 70%, oat bran 30%, fat, sugar, eggs < LOQe e
aAA: acrylamide; data shown as mean ± SD (n = 3) for the amount of AA; means followed by different letters are significantly different (p < 0.05); bRF:
Robustness
The small variations in the volume of hexane used in the purification of the extracts, derivatization time and mobile phase flow are not susceptible to variations in the area corrected. Standard deviation was between 1.79 and 2.07%.
Measurement uncertainty
The uncertainty of results for AA determination in bread, biscuits and similar products by GC-MS/MS was ± 21% as estimated by budget uncertainty.
Table 8. Gingerbread samples (origin: retail store)
Sample, producer code, country Main ingredients AAa / (µg kg-1)
Gingerbread 58/N/Romania WFb, rye flour, sugar, honey 955.5 ± 2.9 a
Gingerbread 59/C/Moldavia WFb, sugar, sorbitol 588.8 ± 16.8 b
Gingerbread 90/C/Moldavia WFb, sugar, sorbitol 349.5 ± 3.9 c
aAA: acrylamide; data shown as mean ± SD (n = 3) for the amount of AA; means followed by different letters are significantly different (p < 0.05); bWF:
wheat flour.
Table 7. Crackers samples (origin: retail store)
Sample, producer code, country Main ingredients AAa / (µg kg-1)
Cheese cracker 3437/O/Romania WFb, oil, cheese powder, pea flour, corn starch 347.8 ± 4.3 a
Caraway cracker 3438/O/Romania WFb, oil, caraway, cheese powder, pea flour 366.1 ± 21.3 a
aAA: acrylamide; data shown as mean ± SD (n = 6) for the amount of AA; values with the same letter denote no significant difference (p > 0.05) between
samples; bWF: wheat flour.
Table 6. Sandwich biscuits with cream filling (origin: retail store)
Sample, producer code, country Main ingredients AAa / (µg kg-1)
Biscuit with cocoa cream 80/L/Romania WFb, fat, sugar 527.2 ± 5.8 a
Biscuit with honey and milk cream 81/M/Romania WFb, fat, sugar, honey, powder milk, starch 570.4 ± 7.2 b
Biscuit with sour cream 82/B/Romania WFb, sugar, fat, cocoa powder, milk powder,
cream powder
112.6 ± 3.1 c
Vanilla biscuit with cocoa cream 76a/I/Romania WFb, sugar, palm oil, maize starch, cocoa
different batches
243.7 ± 5.8 d
76b/I/Romania 177.8 ± 6.0 e
aAA: acrylamide; data shown as mean ± SD (n = 5) for the amount of AA; means followed by different letters are significantly different (p < 0.05); bWF:
wheat flour.
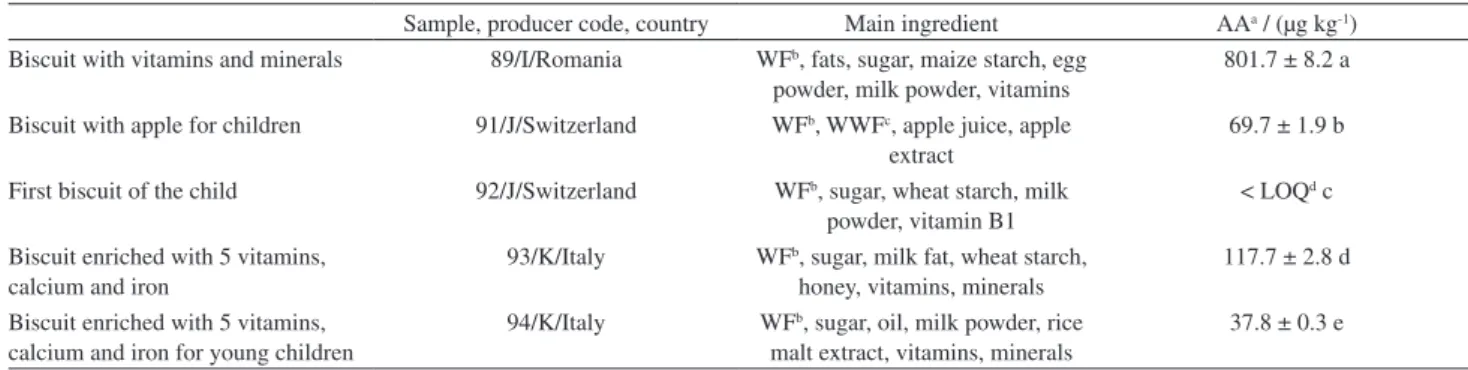
Table 5. Biscuits for infants and young children (origin: retail store, produced in different countries)
Sample, producer code, country Main ingredient AAa / (µg kg-1)
Biscuit with vitamins and minerals 89/I/Romania WFb, fats, sugar, maize starch, egg
powder, milk powder, vitamins
801.7 ± 8.2 a
Biscuit with apple for children 91/J/Switzerland WFb, WWFc, apple juice, apple
extract
69.7 ± 1.9 b
First biscuit of the child 92/J/Switzerland WFb, sugar, wheat starch, milk
powder, vitamin B1
< LOQd c
Biscuit enriched with 5 vitamins, calcium and iron
93/K/Italy WFb, sugar, milk fat, wheat starch,
honey, vitamins, minerals
117.7 ± 2.8 d
Biscuit enriched with 5 vitamins, calcium and iron for young children
94/K/Italy WFb, sugar, oil, milk powder, rice
malt extract, vitamins, minerals
37.8 ± 0.3 e
aAA: acrylamide; data shown as mean ± SD (n = 6) for the amount of AA; means followed by different letters are significantly different (p < 0.05); bWF:
Method application
As it can be noticed from Tables 1-8, the results for the AA content in the different food samples studied, varied greatly not only from one type of product to another one, but also in the same type of product coming from different brands or the same product with different batches. From the 49 types of bread, biscuits, crackers and gingerbread analyzed coming from 20 different suppliers, 16 of them (4 bread samples, 11 biscuits and sandwich biscuits and 1 biscuit for infants and young children) had an AA level higher than the “indicative values” provided in the Commission Recommendation (EC 2013).6 The indicative
values were for soft bread obtained from wheat flour were set at a value of 80 µg kg-1, biscuits for infants and young
children at 200 µg kg-1, biscuits and crackers at 500 µg kg-1
and gingerbread at 1000 µg kg-1, respectively.
Bread products manufactured in the pilot plant under controlled conditions (Table 1) do not exceed the indicative values, except the bread sample prepared with onion. This could be explained by the fact that onion contributes to AA formation. It was shown38 that onion among other
ingredients used for seasoning increased the AA content. Analysis of the AA content in the same type of food from the market (the same receipt and manufacturing process according to the producer declaration) with different batches showed differences in the AA content. For example, for 3 batches of bread (code 32, 33 and 34) coming from the same producer, M, the AA level showed significant differences, while for another 3 batches of bread (code 38, 39 and 47, from producer T), the AA levels showed similar values (Table 2). This could be explained by the technological conditions (temperature, time) which could vary or by variation in the quality of the raw materials.
Adult chronic dietary exposure estimated by EFSA39 was
between 0.4 and 0.9 µg kg-1 bw per day. Considering than
in Romania, the bread intake for an adult weighing 80 kg is 300 g per day and based on the average level of AA obtained in this study for the breads from the market (62.99 µg kg-1,
Table 2), it can be concluded that bread contributes to a chronic dietary exposure of 0.9 µg kg-1 bw per day with
about 26%. The same procedure was applied for biscuits and similar products. Thus, for a daily intake of 5.8 g and an average for AA obtained for these products (456.01 µg kg-1,
Tables 3-8), the biscuits contributes to a chronic dietary exposure of 0.9 µg kg-1 bw per day with about 3.7%.
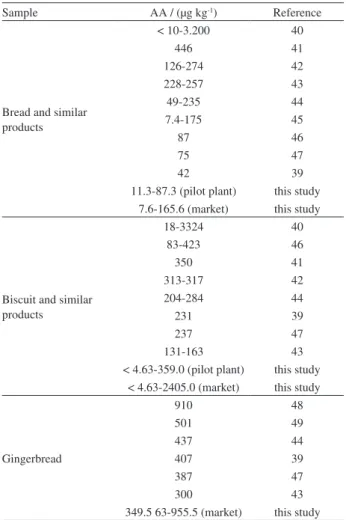
The AA content obtained for bakery products are in accordance with the data presented in literature (Table 10).
Conclusions
The proposed GC-MS/MS method corresponds to the validation parameters imposed and it was applied with good results to determine AA content in bread, biscuits and other similar products. The LOD and LOQ values were 2.41 and 7.23 µg kg-1 for bread and similar
products, while for biscuits and similar products were 4.63 and 13.89 µg kg-1, respectively. This study assesses the
presence of AA in foods found on the Romanian market. Taking into account the consumption of bakery products among adults and children, establishment of measures is necessary in order to protect consumer health. In this respect, an important measure is to control in order to avoid the sale of foods with high levels of AA.
Considering all of the above data for method performance and proficiency test, the GC-MS/MS method and sample pretreatment employed in the present work can be regarded as being sensible, precise and robust.
Table 9. Performance parameters of the method
Performance parameter
Sample Bread and similar
products Biscuit Sandwich biscuit Cracker Gingerbread
Precision
Injection repeatability AA / (mg L
-1) 0.040
(n = 9)
0.210-5.658 (n = 10)
0.611-1.960
(n = 9-10) NC NC
RSD(r) / % 3.30 0.71-1.55 1.14-1.47 NC NC
Analysis repeatability (intra-day)
AA / (µg kg-1) 7.58-157.10
(n = 5-6)
30.91-1778.97 (n = 6)
113.97-1065.47 (n = 5-6)
347.78 (n = 6)
608.62-1318.48 (n = 5-6)
RSD(r) / % 0.53-3.33 0.74-4.90 0.95-1.55 1.24 0.44-2.93
Intermediate precision (inter-day)
AA / (µg kg-1) 19.50-73.62
(n = 3-4)
37.60-1221.29 (n = 3)
113.16-576.69
(n = 2-3) NC
349.70-954.49 (n = 2-3)
RSD(R) / % 1.17-5.83 0.94-5.34 1.53-3.84 NC 0.35-1.76
Acknowledgments
This study was financially supported by the Ministry of National Education-State Authority for Scientific Research, Technological Development and Innovation, through Nucleu Program PN 12 48 (contract No. 48N/2012).
References
1. International Agency for Research on Cancer (IARC);
Monographs on the Evaluation of Carcinogenic Risks of Chemicals to Humans, Vol. 60; Lyon, France, 1994, p. 389. 2. Friedman, M.; J. Agric. Food Chem.2003, 51, 4504.
3. Joint FAO/WHO Expert Committee on Food Additives (JECFA); Evaluation of Certain Food Contaminants: Sixty-Fourth Report of the Joint FAO/WHO Expert Committee on Food Additives;WHO: Geneva, 2006. Available at http://apps. who.int/iris/bitstream/10665/43258/1/WHO_TRS_930_eng. pdf accessed on February 7, 2016.
4. Joint FAO/WHO Expert Committee on Food Additives (JECFA);
Evaluation of Certain Contaminants in Food: Seventy-Second Report of the Joint FAO/WHO Expert Committee on Food Additives; WHO: Geneva, 2011. Available at http://www. inchem.org/documents/jecfa/jecmono/v959je01.pdf accessed on February 7, 2016.
5. US Food and Drug Administration; Draft Guidance for Industry: Acrylamide in Foods; 2013. Available a t w w w . f d a . g o v / F o o d / G u i d a n c e R e g u l a t i o n / GuidanceDocumentsRegulatoryInformation/ucm374524.htm accessed on February 7, 2016.
6. European Commission; Commission Recommendation on Investigations into Levels of Acrylamide in Food;(2013/647/ UE), 2013. Available at http://eur-lex.europa.eu/legal-content/ EN/TXT/PDF/?uri=CELEX:32013H0647&from=EN accessed on February 7, 2016.
7. European Commission; Opinion of the Scientific Committee on Food on New Findings Regarding the Presence of Acrylamide in Food; 2002. Available at http://ec.europa.eu/food/fs/sc/scf/ out131_en.pdf accessed on February 7, 2016.
8. Hogervorst, J. G. F.; Baars, B. J.; Schouten, L. J.; Konings, E. J. M.; Goldbohm, R. A.; van den Brandt, P. A.; Crit. Rev. Toxicol.
2010, 40,485.
9. Oracz, J.; Nebesny, E.; Zyzelewicz, D.; Talanta2011, 86, 23. 10. Elbashir, A. A.; Omar, M. M. A.; Ibrahim, W. A. W.; Schmitz,
O. J.; Aboul-Enein, H. Y.; Crit. Rev. Anal. Chem.2014, 44, 107. 11. Hu, Q.; Xu, X.; Fu, Y.; Li, Y.; Food Control2015, 56, 135. 12. Tareke, E.; Rydberg, P.; Karlsson, P.; Eriksson, S.; Trnqvist,
M.; J. Agric. Food Chem. 2002, 50, 4998.
13. Nemato, S.; Takatsuki, S.; Sasaki, K.; Maitani, T.; J. Food Hyg. Soc. Jpn. 2002, 43, 371.
14. Pittet, A.; Périsset, A.; Oberson, J. M.; J. Chromatogr. 2004,
1035, 123.
15. Cheng, W. C.; Hsiao, S. W.; Chou, S. S.; Sun-Hwang, L.; Lu, T. J.; Yeh, A.-I.; J. Food Drug Anal.2006, 14, 207.
16. Omar, M. M. A.; Ibrahim, W. A. W.; Elbashir, A. A.; Food Chem.
2014, 158, 302.
17. Zhu, Y. H.; Li, G.; Duan, Y. P.; Chen, S. Q.; Zhang, C.; Li, Y. F.; Food Chem.2008, 109, 899.
18. Claus, A.; Weisz, G. M.; Kammerer, D. R.; Carle, R.; Schieber, A.; Mol. Nutr. Food Res.2005, 49, 918.
19. Hoenicke, K.; Gatermann, R.; Harder, W.; Hartig, L.; Anal. Chim. Acta2004, 520, 207.
20. Nielsen, N. J.; Granby, K.; Hedegaard, R. V.; Skibsted, L. H.;
Anal. Chim. Acta2006, 557, 211.
21. Zhang, Y.; Jiao, J.; Cai, Z.; Zhang, Y.; Ren, Y.; J. Chromatogr. A2007, 1142, 194.
22. Wenzl, T.; Karasek, L.; Rosen, J.; Hellenaes, K.-E.; Crews, C.; Castle, L.; Anklam, E.; J. Chromatogr. A2006, 1132, 211. 23. European Commission; Commission Recommendations of 2
June 2010 on the Monitoring of Acrylamide Levels in Food; Official Journal of the European Union, L 137, 4-10 (2010/307/ Table 10. Survey of AA content in bakery products
Sample AA / (µg kg-1) Reference
Bread and similar products
< 10-3.200 40
446 41
126-274 42
228-257 43
49-235 44
7.4-175 45
87 46
75 47
42 39
11.3-87.3 (pilot plant) this study 7.6-165.6 (market) this study
Biscuit and similar products
18-3324 40
83-423 46
350 41
313-317 42
204-284 44
231 39
237 47
131-163 43
< 4.63-359.0 (pilot plant) this study < 4.63-2405.0 (market) this study
Gingerbread
910 48
501 49
437 44
407 39
387 47
300 43
EU), 2010. Available at http://eur-lex.europa.eu/legal-content/ EN/TXT/PDF/?uri=CELEX:32010H0307&from=EN accessed on February 7, 2016.
24. Negoita, M.; Catana, M.; Iorga, E.; Catana, L.; Adascalului, A.; Belc, N.; Rom. Biotechnol. Lett.2014, 19, 9561.
25. Negoita, M.; Adascalului, A.; Iorga, E.; Catana, L.; Catana, M.; Belc, N.; Rev. Chim.2015, 66, 464.
26. ISO/IEC 17025: General Requirements for the Competence of Testing and Calibration Laboratories, ISO: Geneva, 2005. 27. International Conference on Harmonisation of Technical
Requirements for Registration of Pharmaceuticals For Human Use (ICH); Validation of Analytical Procedures: Text and Methodology Q2(R1); ICH: London,2005.
28. Veterinary International Conference on Harmonization (VICH);
VICH GL49-Guidance for Industry Studies to Evaluate the Metabolism and Residue Kinetics of Veterinary Drugs in Food-Producing Animals: Validation of Analytical Methods Used in Residue Depletion Studies, VICH: Rockville, 2015.
29. CAC/GL 16: Codex Guidelines for the Establishment of a Regulatory Programme for Control of Veterinary Drug Residues in Foods, Part III-Attributes of Analytical Methods for Residue of Veterinary Drugs in Foods, Rome, 1993, p. 41.
30. European Commission; Commission Decision of 12 August 2002 Implementing Council Directive 96/23/EC Concerning the Performance of Analytical Methods and the Interpretation of Results, (2002/657/CE), L 221/8-36. Available at http://eur-lex.europa.eu/legal-content/EN/TXT/PDF/?uri=CELEX:3200 2D0657&from=EN accessed on February 7, 2016.
31. ISO/TS 21748: Guidance for the Use of Repeatability, Reproducibility and Trueness Estimates in Measurement Uncertainty Estimation, ISO: Geneva, 2004.
32. Vessman, J.; Stefan, R. I.; van Staden, J. F.; Danzer, K.; Lindner, W.; Burns, D. T.; Fajgelj, A.; Müller, H.; Pure Appl. Chem. 2001,
72, 1381.
33. FAPAS: Acrylamide Report 3056; FAPAS Proficiency Testing, Fera Science Ltd: Sans Hutton, York, UK, 2015.
34. EURACHEM/CITAC Guide; Quantifying Uncertainty in Analytical Measurement, 3rd ed.; UK, 2011.
35. ISO/IEC Guide 98-3:2008: Uncertainty of Measurement -- Part 3: Guide to the Expression of Uncertainty in Measurement (GUM:1995), ISO: Geneva, 2008.
36. ISO 8466-1:1990: Water Quality. Calibration and Evaluation of Analytical Methods and Astimation of Performance Characteristics, Part 1: Statistical Evaluation of the Linear Calibration Function, ISO: Geneva, 2010.
37. Alpözen, E.; Güven, G.; Özdestan, Ö.; Üren, A.; Acta Aliment.
2015, 44, 221.
38. Tateo, F.; Bononi, M.; Andreoli, G.; J. Food Compos. Anal.
2007, 20, 232.
39. European Food Safety Authority (EFSA); Outcome of the Public Consultation on the Draft Scientific Opinion of the EFSA Panel on Contaminants in the Food Chain on Acrylamide in Food; EFSA Supporting Publication: Parma, 2015. Available at http:// www.efsa.europa.eu/sites/default/files/scientific_output/files/ main_documents/817e.pdf accessed on February 7, 2016. 40. Krishnakumar, T.; Visvanathan, R.; J. Food Process. Technol.
2012, 5, 344.
41. Keramat, J.; LeBail, A.; Prost, C.; Soltanizadeh, N.; Food Bioprocess Technol. 2011, 4, 340.
42. European Food Safety Authority (EFSA); Scientific Report of EFSA: Results on the Monitoring of Acrylamide Levels in Food; The EFSA Scientific Report 285: Parma, 2009, p. 1. Available at http://www.efsa.europa.eu/sites/default/files/scientific_output/ files/main_documents/293r.pdf accessed on February 7, 2016. 43. Mojska, H. In Acrylamide in Food; Gökmen, V., ed.; Academic
Press: Amsterdam, 2015, p. 39.
44. European Food Safety Authority (EFSA); Scientific Report of EFSA: Results on Acrylamide Levels in Food from Monitoring Year 2008; EFSA Journal: Parma, 2010, p. 1599. Available at http://www.efsa.europa.eu/sites/default/files/scientific_output/ files/main_documents/1599.pdf accessed on February 7, 2016. 45. Sadd, P.; Hamlet, C. In Chemistry and Safety of Acrylamide
in Food, Vol. 561; Friedman, M.; Mottram, D., eds.; Springer: New York, 2005, p. 415.
46. Ruan-Henares, J.-A.; Arribas-Lorenzo, G.; Morales, F. J.; Food Addit. Contam.2007, 24, 343.
47. European Food Safety Authority (EFSA); Scientific Report of EFSA: Update on Acrylamide Levels in Food from Monitoring Years 2007 to 2010; EFSA Journal: Parma, 2012, p. 2938. Available at http://www.efsa.europa.eu/sites/default/files/ scientific_output/files/main_documents/2938.pdf accessed on February 7, 2016.
48. Amrein, T. M.; Schönbächler, B.; Escher, F.; Amadò, R. In Chemistry and Safety of Acrylamide in Food, Vol. 561; Friedman, M.; Mottram, D., eds.; Springer: New York, 2005, p. 431.
49. Amrein, T. M.; Schönbächler, B.; Escher, F.; Amadò, R.; J. Agric. Food Chem. 2004, 52, 4282.