Article
Printed in Brazil - ©2016 Sociedade Brasileira de Química0103 - 5053 $6.00+0.00
*e-mail: [email protected]
Ibuprofen, Carbamazepine and
β
-Estradiol Determination Using Thin-Film
Microextraction and Gas Chromatography-Mass Spectrometry
Ady Giordano,*,a José Vásquez,b Mauricio Retamala and Loreto Ascarc
aDepartamento de Química Inorgánica, Facultad de Química, Pontificia Universidad Católica de
Chile, CP22, 7810000 Santiago, Chile
bFacultad de Ciencias Naturales, Matemáticas y del Medio Ambiente, Universidad Tecnológica
Metropolitana, 7810000 Santiago, Chile
cFacultad de Ciencias Químicas y Farmacéuticas, Universidad de Chile, 8380000 Santiago, Chile
The use of thin-film microextraction for the extraction of selected pharmaceutical compounds followed by gas chromatography-mass spectrometry detection was evaluated. A segment of polysiloxanes polymer sheet was used as low cost, single use, disposable extraction phase, while Milli-Q water spiked at 20 µg L−1 with the analytes was used for the optimization assays. The controlling parameters for the extraction were optimized via experimental design and it was found that an extraction time of 3 h using a sample volume of 1000 mL at pH 4 with the addition of 20% methanol and 20% sodium chloride provided the greatest extraction efficiency. Recoveries between 67.1 and 85.0% were achieved, with a repeteability lower than 20% (expressed as coefficient of variation) and limit of detection ranged from 0.41 and 0.92 µg L−1. The proposed method show similar analytical performance when compared to the determination of the analytes using stir bar sorptive extraction.
Keywords: thin-film extraction, β-estradiol, carbamazepine, ibuprofen
Introduction
A wide variety of pharmaceutical and personal care products (PPCPs) and their metabolites are continuously introduced in the environment through human excretion,
washing and manufacturing.1 In recent years, the interest
in these compounds has increased, with special attention
paid to their presence in the aquatic environment.2 However,
there is little information about the adverse effects of
human pharmaceuticals on aquatic organisms.3 Indeed
it is known that even though the concentrations found in surface water are very low, the constant introduction of low concentrations represents a risk; compounds such as
β-estradiol, carbamazepine and ibuprofen have been shown
to have adverse effects on aquatic ecosystems.2
A wide range of analytical methods have been developed for the analysis of PPCPs in aqueous samples. High-performance liquid chromatography (HPLC) with ultraviolet (UV) detection methods are commonly used
for the determination of PPCPs in several matrices;4 gas
chromatography-mass spectrometry (GC-MS) is another good alternative, because it can be used to identify these
analytes with low limits of detection (LOD).5 However,
in aqueous environmental samples the concentrations of PPCPs are very low and extraction and preconcentration steps are required for their determination. Commonly used PPCPs can be easily extracted via solid-phase extraction using a water-wettable, hydrophilic/lipophilic balance,
reversed-phase sorbent with proper pH adjustment,6-9 with
recoveries up to 107%6 on optimum experimental conditions
and LOD as low as 1 ng L−1 when coupled with ultra high
performance liquid chromatographic system attached to
high-resolution mass spectrometry (UHPLC-MS/MS).10
Solid-phase microextraction (SPME)11,12 and stir bar
sorptive extraction (SBSE)13,14 have also been proven to be
effective for the determination of these analytes in aqueous sample. Recoveries for estrogen compounds range from 50
to 120% of the spiked concentration when using SPME6
and, for SBSE average recoveries of 93.1% were achieved
for selected PPCPs.14 Both of these techniques have the
since they use little or no solvent during the extraction and analytes can be thermally desorbed. However, SPME commercial fiber is expensive and has a small quantity of polydimethylsiloxane (PDMS) in the coating which limits analyte abdsorption. Commercial SBSE devices afford better recovery values through the use of higher PDMS volumes, but require a special thermal desorption unit for fully solvent-free operation.
Thin-film microextraction (TFME) was introduced by
Bruheim et al.15 and comprise cheap commercial thin sheets
of PDMS cut into different geometries, which increases the surface area-to-volume ratio to improve the recovery of
analytes when using PDMS as the extraction phase.16 TFME
exhibits the same extraction phenomena and extraction
selectivities as SPME and SBSE,17 but with increased
recovery because a higher volume of PDMS comes into contact with the sample. This configuration allows to remain the thickness of the coating or even decreases it, while the volume of the extraction phase increases, which according to the extraction principle will result in lower equilibrium
times and higher extraction rates.18 TFME has been widely
used for the determination of polyaromatic hydrocarbons,19,20
pesticides21 and endocrine disruptor compounds.22
The aim of this study was to evaluate the use of TFME as a cheap and simple extraction technique for the determination of selected PPCPs with acidic, basic and neutral characteristics. An experimental design matrix was used to optimize the variables that determine TFME extraction performance: pH, extraction time, sample volume and the addition of matrix modifiers, such as methanol (MeOH) and sodium chloride (NaCl).
Experimental
Reagents
The mixture N,O-bis(trimethylsilyl)trifluoroacetamide
(BSTFA) + chlorotrimethylsilane (TCMS), 99:1 was obtained from Supelco (Bellefonte, PA, USA).
Pyridine, carbamazepine, ibuprofen and β-estradiol
(purity ca. 94-99.5%) were obtained from Sigma-Aldrich (St. Louis, MO, USA). All other solvents and reagents were purchased from Merck (Darmstadt, Germany) in their highest purity. Ultrapure water was obtained using a Direct-Q 3 system from Millipore (Billerica, MA, USA). Nitrogen and helium were purchased from Indura (Santiago, Chile). The PDMS silicone elastomer sheet was obtained from Goodfellow (Oakdale, PA, USA). Stock
solutions (1000 mg L−1) for each analyte were prepared
monthly and maintained at 4 °C, and all calibration curves and extraction solutions were prepared daily.
GC-MS analysis
GC-MS was performed on a Clarus 680 GC (PerkinElmer, Waltham, MA, USA) coupled to a Clarus SQ 8T mass detector under electron impact ionization (70 eV) with a 4 min solvent delay and an interface temperature of 230 °C. Samples were separated on an HP-5ms fused-silica capillary column (Agilent Technologies, Santa Clara, CA, USA) with 0.25 µm film and 30 m × 0.25 mm i.d., using
helium 6.0 as the carrier gas (flow rate 1.0 mL min−1). The
column temperature was initially held at 100 °C for 1 min,
then programmed to reach 280 °C at a rate of 20 °C min−1
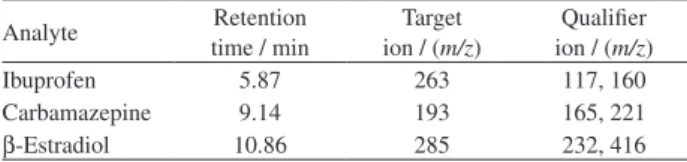
with a final hold time of 15 min. The injector temperature was maintained at 280 °C and the injection volume was 1 µL in the splitless mode. Table 1 lists the analyte ions used for the chromatographic analysis; a tolerance of 0.5% for retention time and a ± 10% tolerance for relative ion intensities were employed.
TFME procedure
An aliquot of Milli-Q water was spiked with each
analyte at a concentration of 20 µg L−1 and then the pH of
the solution was adjusted to 4 as measured using a WTW pMX 300 pH meter (Weilheim, Germany) by adding HCl. NaCl and MeOH were then each added at a concentration of
20%, followed by a 1 cm2 PDMS polymer sheet. The mixture
was then stirred using a Heildolph MR 3002 magnetic stirrer (Schwabach, Germany) for 2 h at 1500 rpm. For the desorption step, the polymer film was placed in MeOH (2 mL) and stirred for 30 min. The MeOH was then taken to dryness under nitrogen. Extraction were conducted in duplicate, except for reproducibility and recovery experiments (n = 5).
SBSE procedure
Stir bars coated with PDMS (0.5 mm film thickness,
10 mm length, 24 µL PDMS, 0.94 cm2 surface area) were
obtained from Gerstel (Mülheim and der Ruhr, Germany) and were used to compare extraction efficiency.
Prior to use, the stir bars were conditioned into a vial containing 20 mL of methanol. To perform the extraction, the same procedure as the PDMS polymer sheet was Table 1. Main features of the gas chromatography-mass spectrometry (GC-MS) method
Analyte Retention
time / min
Target ion / (m/z)
Qualifier ion / (m/z)
Ibuprofen 5.87 263 117, 160
Carbamazepine 9.14 193 165, 221
followed for both extraction and elution of analytes using optimun conditions of TFME method. Between each extraction, the bar was cleaned with additional 20 mL of methanol for 30 min.
Derivatization procedure
To derivatize the analytes, the residue was redissolved in pyridine (25 µL) and BSTFA + TMCS (99:1; 50 µL) were added. The solution was heated at 75 °C in a sealed mini-vial for 40 min. Ethyl acetate (100 µL) was then added after the silylation reaction be completed.
Sample procedure
Water samples were collected from the Maipo River (Santiago, Chile). The collected water samples were filtered through 0.45 µm nylon filters and stored at 4 °C in dark bottles until analysis.
Results and Discussion
β-Estradiol, carbamazepine and ibuprofen were
selected as model compound due to their neutral, basic and acidic characteristic, respectively, in order to study the applicability of the method for PPCPs determination.
For the TFME, a 1 cm2 polymer phase was used in
Milli-Q water spiked with the analytes at 20 µg L−1. Certain
variables that affect the extraction performance, such as the temperature and agitation velocity, were not investigated in the present study, with the extraction being performed at ambient temperature, even when increasing the temperature results in a higher extraction efficiency due to an increase
in the diffusion coefficient, as has been reported.22 With
respect to agitation, a speed of 1500 rpm was chosen because more efficient extraction has been observed with greater
agitation.23 The effect of the sample volume, extraction time
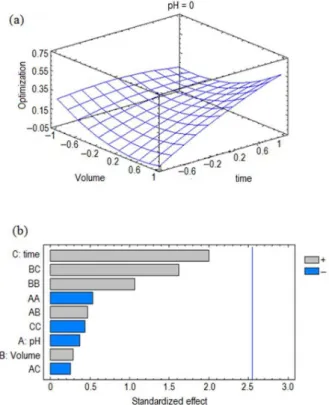
and pH were optimized using a Box-Behnken design with a total of 15 experiments. Table 2 contains the encoded values and their corresponding natural values.
As can be seen in the total response surface in Figure 1, when grouping the responses of all the compounds, the results indicated that increasing the extraction time increased the extraction efficiency, and this result is comparable to
results obtained when using single variable optimization.22
It is possible that the response could increase beyond the selected parameters and an extraction time higher than 180 min could become an optimum condition. In addition, the relationship between the sample volume and extraction time can also be seen in the Pareto chart in Figure 1 as another important factor. This result is reasonable given that extraction is controlled mainly by mass transfer in the solution. When a higher sample volume was used, the preconcentration factor was increased; therefore, the extraction sensitivity was improved. A lower solution pH was found to enable increased interaction between the acidic analytes and the polymer. However, the PDMS polymer is
known to deteriorate at pH values less than 2.24 Table 3 lists
the optimum values determined for each variable.
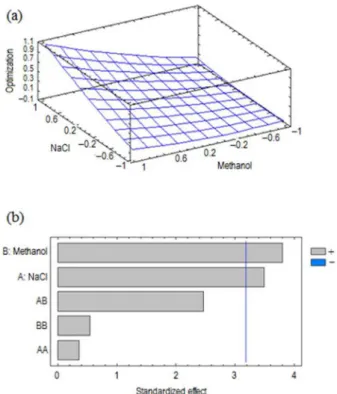
Since the analytes are mid-polar compounds, the use of sample modifiers was considered. The salting out effect was studied because the addition of a salt is known to enhance the interaction of the analytes with the polymer by
Table 3. Optimum values for the extraction variables
Variable Encoded value Natural value
Extraction time / min 1 180
Sample volume / mL 1 1000
pH −0.057 4
NaCl / % 1 20
Methanol / % 1 20
Table 2. Optimization values for the extraction variables
Factor Volume /
mL pH
Extraction time / min
NaCl / %
MeOH / %
−1 200 3 60 0 0
0 600 4 120 10 10
+1 1000 5 180 20 20
decreasing their solubilities.21 Therefore, NaCl was added
at concentrations up to 20% (due to salt solubility). The addition of MeOH, a common sample modifier for mid-polar compounds, can increase the solubility of the analytes in the
solution.25 For optimization of these variables, a 32 design
was used and the encoded and natural values are also listed in Table 2. It can be seen in the Pareto chart (Figure 2) that both of the modifiers were significant variables. The optimum values are listed in Table 3 and show that increasing both the NaCl and MeOH concentrations increased the extraction response; however, the response surface (Figure 2) show just a slightly increment when adding 20% MeOH.
For all of these experiments, a well-known desorption step was employed. MeOH was chosen because it does not damage the polymer phase or cause swelling of the
PDMS.23 Desorption time was optimized between 10 to
30 min of agitation at high speed and 30 min was chosen during the optimization of the desorption time agitation. Under this condition, no carryover effect was observed.
The quantity of analyte that can be extracted using thin-film extraction is determined by the volume of the extraction
phase.15 Therefore, increasing the size of the polymer film
used for the extraction was also evaluated. A 2 cm2 polymer
sheet was introduced to the analyte solution and the same two experimental designs were performed. Similar trends
to those observed using the 1 cm2 polymer phase were
observed with the larger polymer sheet and the optimum
conditions were again those presented in Table 2. Notably, there was an increase in the responses for carbamazepine
and β-estradiol, reflecting the fact that analyte recovery is
also dependent on the analyte/polymer phase ratio and the
octanol-water partition coefficient (KOW) of the analyte.15
However, no effect on the recovery of ibuprofen when using the larger polymer phase was observed, meaning that this analyte extraction was already exhaustive when using less volume of PDMS.
Analytical features
For quantitative analysis, it is not necessary that the analytes are completely extracted, as long as the extraction is carefully timed and the experimental conditions remain
constant.26 Calibration curves were constructed usign seven
points for analytes concentrations ranging from 1 to 50 µg L−1
in aqueous solutions (n = 2). The resulting calibration equations are presented in Table 4, along with their associated limits of detection and quantification (values were calculated using the parameters of the calibration curves).
Water samples fortified at 20 µg L−1 for all analytes were
used to evaluate accuracy. 5 samples were prepared and extracted the same day for recovery tests and repeatability assays. Both results are shown in Table 4. Intermediate precision was evaluated as the coefficient of variance of the analysis of water samples on three differents days using five repetitions and the values obtained were between 8.4 and 20.0%. Note that the PDMS phase was not reused and the polymer sheet was not homogenous. Despite these issues, the obtained values are similar to those reported by other
authors using similar extraction processes.25
However, when comparing the proposed methodology with other reported in the literature, lower LOD are
described. Neng et al.5 use polyethylene sorptive bars
with large volume injection GC-MS, achieving lower LOD with no derivatization step. On the other hand, when
using UPLC-MS/MS for quantification, LOD of 1 ng L−1
are reported. However, in Celano et al.9 work is used a
combination of extraction methodologies. To be able to achieve such low LOD, the developed TFME methodology needs to be coupled with a more sensitive detection method. However, the simplicity of the extraction, the cheap extraction phase and good analytical performance make the proposed methodology a suitable alternative for determinations of the selected PPCPs.
Comparison with SBSE methodology
A comparison of the extraction efficiency was made between TFME and SBSE using five extractions of water Figure 2. Response surface (a); and Pareto chart (b) for percentages of
samples spiked at 20 µg L−1 with optimized conditions.
The results are presented in Figure 3. Under similar extraction conditions, similar recoveries are obtained when using SBSE instead of a polymer sheet; however, for carbamazepine, a slightly increase in efficiency can be observed probably due to the polymer composition not being 100% PDMS as established by the manufacturer, which allows a better interaction between the analytes and the extraction phase. In addition to the recovery values, it was observed similarities between the repeatability of both methods.
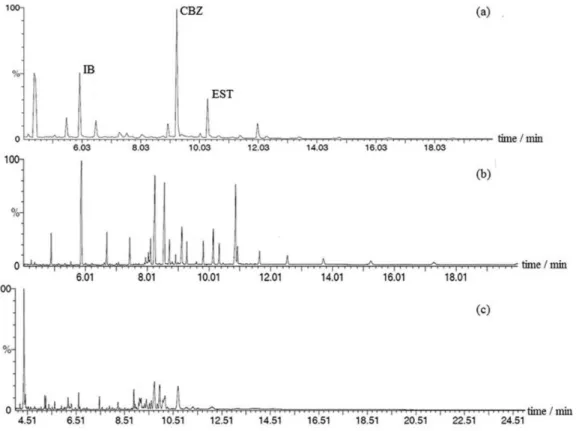
Real samples
The proposed method was applied to the analysis of real aqueous environmental samples obtained from 5 sites in Maipo River. All samples showed results under LOD. To verify the accuracy of the method, recovery experiments
were carried out by the analysis of spiked samples, with recoveries between 62.7-81.0% (Figure 4). The signal identification was made by comparison of standards in pure Table 4. Analytical parameters for the analytes in aqueous samples
Analyte Calibration curve Correlation
coefficient
LOD / (µg L−1)
LOQ / (µg L−1)
Accuracy and repeatabilitya
Coefficient of
variation / % Recovery / %
β-Estradiol y = 0.86E4x + 5.133 0.9852 0.41 1.36 11.8 85.0
Carbamazepine y = 4.21E4x + 1.13E3 0.9809 0.72 2.40 12.5 67.1
Ibuprofen y = 2.72E5x + 9.31E4 0.9914 0.92 3.07 6.4 79.5
aConcentration level 20 µg L−1 and n = 5. LOD: Limit of detection; LOQ: limit of quantification.
Figure 3. Relative response of analytes when determined with stir bar sorptive extraction (SBSE) and the proposed methodology. CBZ: Carbamazepine; EST: β-estradiol; IB: ibuprofen; TFME: thin-film microextraction.
solvent, while the recovery of the analytes was calculated using calibration curves in sample matrix.
Conclusions
The extraction/preconcentration of selected PPCPs using TFME was demonstrated. The use of experimental design reduced the experimental work and gave reliable information regarding the parameters controlling the extraction performance. We found that the sample volume, extraction time and the quantity of added MeOH and NaCl were of relevance to the extraction efficiency and should be particularly controlled. The use of TFME for PPCP analysis has the advantages of being cheap, easy, environmental friendly and a suitable alternative approach to determine pharmaceutical compounds in water samples.
Acknowledgments
The authors thank Project Fondecyt No.11121237 for their financial support.
References
1. Ellis, J. B.; Environ. Pollut. (Oxford, U. K.) 2001, 144, 184. 2. Buchberger, W. W.; J. Chromatogr. A2011, 1218, 603. 3. Richardson, B.; Lam, P. K. S.; Martin, M.; Mar. Pollut. Bull.
2005, 509, 13.
4. Ahn, Y. G.; Shin, J. H.; Kim, H. Y.; Khim, J.; Lee, M. K.; Hong, J.; Anal. Chim. Acta2007, 603, 67.
5. Neng, N. R.; Nogueira, M. F.; Anal. Bioanal. Chem.2012, 402, 1355.
6. Ferrer, I.; Zweigenbaum, J. A.; Thurman, E. M.; J. Chromatogr. A
2010, 1217, 5674.
7. Batt, A. L.; Kostich, M. S.; Lazorchak, J. I. M.; Anal. Chem.
2008, 80, 5021.
8. Kasprzyk-Hordern, B.; Dinsdale, R. M.; Guwy, A. J.; Anal. Bioanal. Chem.2008, 391, 1293.
9. Celano, R.; Piccinelli, A. L.; Campone, L.; Rastrelli, L.;
J. Chromatogr. A2014, 1355, 26.
10. Rodil, R.; Quintana, J. B.; Lopez-Mahia, P.; Muniategui-Lorenzo, S.; Prada-Rodriguez, D.; J. Chromatogr. A2009, 1216, 2958.
11. Peñalver, A.; Pocurull, E.; Borrull, F.; Marcé, R. M.;
J. Chromatogr. A2002, 964, 153.
12. Carpinteiro, J.; Quintana, J. B.; Rodriguez, I.; Carro, A. M.; Lorenzo, R. A.; Cela, R.; J. Chromatogr. A2004, 1056, 179. 13. Kawaguchi, M.; Ito, R.; Sakui, N.; Okanouchi, N.; Saito, K.;
Nakazawa, H.; J. Chromatogr. A 2006, 1105, 140.
14. Tan, B. L. L.; Hawker, D. W.; Müller, J. F.; Tremblay, L. A.; Chapman, H. F.; Water Res. 2008, 42, 404.
15. Bruheim, I.; Liu, X.; Pawliszyn, J.; Anal. Chem.2003, 75, 1002. 16. Jiang, R.; Pawliszyn, J.; TrAC, Trends Anal. Chem.2012, 39,
245.
17. Pawliszyn, J.; J. Chromatogr. Sci.2000, 38, 270.
18. Qin, Z.; Mok, S.; Ouyang, G.; Dixon, D. G.; Pawliszyn, J.;
Anal. Chim. Acta 2010, 667, 71.
19. Qin, Z.; Bragg, L.; Ouyang, G.; Pawliszyn, J.; J. Chromatogr. A
2008, 1196, 89.
20. Wei, F.; Zhang, F.; Liao, H.; Dong, X.; Li, Y.; Chen, H.; J. Sep. Sci. 2011, 34, 331.
21. Cai, P. S.; Li, D.; Chen, J.; Xiong, C. M.; Ruan, J. L.; Food Chem. 2015, 173, 1158.
22. Giordano, A.; Richter, P.; Ahumada, I.; Talanta 2011, 85, 2425. 23. Richter, P.; Leiva, C.; Choque, C.; Giordano, A.; Sepúlveda, B.;
J. Chromatogr. A2009, 1216, 8598.
24. Prieto, A.; Basauri, O.; Usobiaga, R.; Fernandez, L. A.; Etxebarria, N.; Zuloaga, O.; J. Chromatogr. A2010, 1217, 2642. 25. Liu, W.; Hu, Y.; Zhao, J.; Xu, J.; Guan, Y.; J. Chromatogr. A
2005, 1095, 1.
26. Lambropoulou, D. A.; Giokas, D. L.; Sakkas, V. A.; Albanis, T. A.; Karayannis, M. I.; J. Chromatogr. A2002, 967, 243.
Submitted: October 30, 2015