Article
Printed in Brazil - ©2016 Sociedade Brasileira de Química0103 - 5053 $6.00+0.00*e-mail: [email protected]
Effects of Different Numbers of Fungicide Application on the Proximate
Composition of Soybean
Roger N. Michels,a Elton G. Bonafe,*,b Luana C. Figueiredo,b Rúbia M. Suzuki,b Lilian D. Tonin,b Paula F. Montanher,c Alessandro Francisco Martins,b Jesui V. Visentainer,c
Marcelo G. Canterid and Marcelo Augusto A. Silvad
aDepartamento de Química, Universidade Tecnológica Federal do Paraná, 86036-370 Londrina-PR, Brazil
bDepartamento de Química, Universidade Tecnológica Federal do Paraná, 86812-460 Apucarana-PR, Brazil
cDepartamento de Química, Universidade Estadual de Maringá, 87020-900 Maringá-PR, Brazil
dDepartamento de Agronomia, Universidade Estadual de Londrina, CP 6001, 86057-970 Londrina-PR, Brazil
This study aimed to evaluate the effect of strobilurin (pyraclostrobin) + triazole (epoxiconazole) fungicides application on the proximate composition of soybeans. Six treatments of varying numbers of fungicide applications following soybean germination, termed T1 (control), T2, T3, T4, T5, and T6, were assessed for this experiment. Based on the results, there were only minor differences in the proximate composition of soybeans in terms of moisture, ash, crude protein, and total lipid contents. In contrast, there were large effects on the contents of phenolic compounds and the levels of phytosterols and tocopherols, which varied greatly among the fungicide application treatments. Multivariate statistical analysis was applied to identify critical issues regarding the potential for the production of soybeans enriched in phenolic compounds, tocopherols, and essential fatty acids (α-linolenic and linoleic acids, representatives of the omega-3 and omega-6 families, respectively) associated with the number of sprayings applied during the development of soybean crops.
Keywords: fatty acids, phytosterols, tocopherols, proximate composition, fungicide
Introduction
Soy (Glycine max (L.) Merrill) is a vegetable originating
from Asia, distributed around the world and it has an important economic role. Soybean is frequently used to
prepare foodstuffs because of its protein and fat content.1,2
Phytosterols and sterols are bioactives components present in vegetables. They are alcohols with 28 and 29 carbon atoms, similar structure and function of cholesterol. These compounds are responsible for regulating the fluidity and permeability of mammals membranes cells, thus
as cholesterol.2,3 Two hundred kinds of phytosterols are
present in vegetables; β-sitosterol (24-α-ethylcholesterol),
campesterol (24-α-mathylcholesterol), and stigmasterol
(∆22, 24-α-ethylcholesterol) are the most abundant.4,5
Tocopherol is a natural component present in vegetable products and it has antioxidant activity against reactive oxygen species (ROS) and it can offer health benefits against
the development of chronic diseases.6,7 Thus, phytosterols
and tocopherols compounds have important function on antioxidant, anti-inflammatory, antitumor, and enhanced
immunity action, together with other biological activities.8
Acids as α-linolenic (LNA) and linoleic (LA) are
present in soybeans and they are essential to human health. Fatty acids omega-3 (n-3) are essential to keep growth and normal development and help in the prevention and treatment of cardiovascular, inflammatory and autoimmune
diseases.9,10 In the opposite situation, the excess intake of
fatty acids omega-6 (n-6) and high values of n-6/n-3 ratio
increase risk for development of heart diseases.10,11
Principal component analysis (PCA) is a multivariate analyses and it is useful to summarize the variability of a complex data, reducing the variation into an easily comprehensible form. Variables of greatest importance on
the formation of each component can be determined.12-15
or transport.16 However, these products have potential to
transfer risk for human health.17 Thus, this study aimed to
evaluate the nutrient composition, including the essential fatty acid, phytosterol, and tocopherol contents, as well as the antioxidant capacity, of soybeans following the application of fungicide with various spraying periods and considering the importance of those nutrients.
Experimental
Design
The experiment was conducted, for the 2012/13 harvest, at Londrina State University (UEL), located in the municipality of Londrina, Paraná, Brazil, at 23°19’40.92” South latitude and 51°12’19.20” West longitude and an altitude of 560 m. The evaluated soybean cultivar was BMX Potência RR. The experimental design consisted of randomized blocks, with four replicates, with each replicate consisting of plots with 5 rows, 5 m length and spaced apart by 0.45 m. For the treatment applications and the sample collections for analysis, the 4 m central linear of the 3 m central rows constituted the applied/sampled area. The outer rows and 0.5 m of the plot extremities were used as borders (Figure 1).
The fungicide application was realized in six different times, where the first time was sample control, and others applications were decreased gradually (Table 1). The fungicide applied was a commercial mixture of strobilurin (pyraclostrobin) + triazole (epoxiconazole), applied at
a dose of 500 mL ha−1 per 200 L ha−1 mix volume and
supplemented with mineral oil as the vehicle, at the same dose as the fungicide.
Proximate composition
The ash, moisture, and crude protein content of soybean
were determined as described by Cunniff,18 and the total
lipid (TL) content was determined according to Bligh and Dyer.19
Atherogenicity index (AI) and thrombogenicity index (TI)
The atherogenicity index (AI, equation 1) and the thrombogenicity index (TI, equation 2) linked to the fatty acid composition (13 fatty acids) were obtained by:
(1)
(2)
where A, C, D, E, F, and G = 1; B = 4; H, I, and M = 0.5;
N = 3.20,21; 12:0, 14:0, 16:0, 18:0, and 18:1 are acids lauric,
miristic, palmitic, estearic and oleic, respectively; and MUFA, PUFA, n-3 and n-6 are fatty acids monounsaturated, polyunsaturated, omega-3 and omega-6, respectively.
Fatty acid analysis
Fatty acid methyl esters (FAME) were prepared by
methylation of total lipids, according to Joseph and Ackman.22
Methyl esters were separated by gas chromatography using a Trace Ultra GC 3300 (Thermo Scientific, Waltham, MA, USA) equipped with a flame ionization and cyanopropyl
capillary column CP 7420 (100 m × 0.25 mm i.d., 0.25 µm
film thickness; Varian, Palo Alto, CA, USA). The gas flow
rates were 1.2 mL min–1 carrier gas (H
2), 30 mL min–1
make-up gas (N2) and 35 and 350 mL min–1 for the flame
gases (H2 and synthetic air, respectively). The sample
splitting rate was 1:80, and the samples (2 µL) were injected in triplicate. The operational parameters were as follows: detector and injection port temperatures of 240 °C, column temperature of 185 °C for 7.5 min, programmed to increase
at 4 °C min–1 until 235 °C and maintain at this temperature for
1.5 min. The peak areas were determined using ChromQuest 5.0 software (Thermo Scientific, Waltham, MA, USA). For fatty acid identification, the retention times were compared to those of standard methyl esters.
Table 1. Number of sprayings for the control of Asian soybean rust (P. pachyrhizi) following germination, in the 2012/13 crop
Treatment Number of spraying time of spraying / (days after germination)
T1 0 −
T2 6 30, 45, 60, 75, 90, 105
T3 5 45, 60, 75, 90, 105
T4 4 60, 75, 90, 105
T5 3 75, 90, 105
T6 2 90, 105
Quantification (in mg fatty acid g–1 of total lipids)
was performed using tricosanoic acid methyl ester as internal standard (23:0), and theoretical flame ionization detector (FID) correction factors were applied to obtain
concentrations.23 Fatty acid contents were calculated in
mg g–1 of total lipids using equation 3:
(3)
where FA is the mg of fatty acids per g of total lipids; AX is
the peak area (fatty acids); AIS is the peak area of the internal
standard (IS) methyl ester of tricosanoic acid (23:0); WIS is
the IS weight added to the sample (in mg); WX is the sample
weight (in mg); CFX is the theoretical correction factor; and
CFAE is the conversion factor required to express the results
in mass of fatty acids rather than mass of methyl esters.
Phenolic compounds
The total phenolic compounds (TPCs) of soybean
extracts were analyzed using the Folin-Ciocalteu reagent.24
The extract solutions (250 µL) were mixed with 250 µL of the Folin-Ciocalteu reagent (diluted in distilled water, 1:1 v/v), 500 µL of a sodium carbonate-saturated solution and 4 mL of distilled water. After 25 min of rest, the mixture was centrifuged for 10 min at 3,000 rpm
(1,638 × g), and the absorbance at 725 nm was measured
on a spectrophotometer (Genesys 10 uv, Thermo Scientific, Waltham, MA, USA). Methanolic solutions of known gallic
acid concentrations in the range of 0-250 mg L−1 were used
for calibration. The results were expressed as mg gallic
acid equivalents (GAE) 100 g−1 fresh weight (FW) using
the calibration curve (equation 4):
y = −0.0273 + 0.00517x, r2 = 0.999 (4)
Tocopherol and phytosterol analysis
Phytosterols and tocopherols were assessed by the
saponification of 50-100 mg of extracted oil.20 The
saponification was started with 1.0 mL of 1 mol L−1 KOH
in ethanol. The resulting mixture was heated to 70 ºC for 50 min in a water bath. The unsaponifiable fraction was extracted with 1.0 mL of distilled water and 5.0 mL of
n-heptane by liquid-liquid partitioning. This extraction
procedure was repeated two additional times. The aqueous fraction was discarded, leaving only the organic fraction. All of the organic fractions were pooled, and approximately two spatulas of anhydrous sodium sulfate were added to this solution to remove the residue of remaining water. Soon
after, the organic extracts were transferred to an amber flask for subsequent chromatographic analyses. The various phytosterols and tocopherols were identified by comparing the sample retention times with those of standards.
The percentages (m/m, %) of phytosterols and tocopherols were determined using a Thermo Trace CG ultra gas chromatograph and ChromQuest 5.0 software (Thermo Scientific, Waltham, MA, USA), equipped with a programmed temperature vaporizing (PTV) injector and a TriPlus auto sampler (Thermo Scientific, Waltham, MA, USA). A 5%-phenyl fused-silica capillary column (10 m × 0.32 mm i.d., 0.1 µm film thickness) was connected to an uncoated, deactivated 5 m × 0.53 mm i.d. fused-silica pre-column with a press-tight fitting. The pre-column was maintained at 50 °C for 1 min, followed by heating at a rate of 15 °C
min−1 to 180 °C, followed by a rate of 7 °C min−1 to 230 °C,
followed by a rate of 30 °C min−1 to 370 °C, and maintained
at 370 °C for 8 min. The injector was maintained at 600 °C
for 1 min, followed by a heating rate of 14.5 °C min−1 to
370 °C, which was maintained for 30 min. The detector temperature was set at 370 °C. The flow rates for the carrier
(H2), auxiliary (N2), and detector flame (H2 and synthetic
air) gases were 1.2, 30, 35, and 350 mL min−1, respectively.
Antioxidant capacity analysis by L-ORACFL and H-ORACFL
The lipophilic (L) and hydrophilic (H) extracts analyzed for oxygen radical absorbance capacity (ORAC) were
obtained according to Wu et al.25 Briefly, grains were
crushed, homogenized, and sieved through an 80-mesh screen. Then, 0.5 ± 0.05 g of sample were weighed, extracted with 10.0 mL of hexane, sonicated for 5 min at 37 °C, and centrifuged for 10 min at 4,000 rpm in a refrigerated centrifuge model Harrier 18/80 (Sanyo, Moriguchi, Japan). After this step, the supernatant was removed, and the residue was once again extracted following the same procedure. The two collected supernatants were mixed and concentrated in a rotary evaporator, followed by the addition of 1.5 mL
acetone and 4.5 mL of 7% methyl-β-cyclodextrin solution.
The total antioxidant capacity (TAC) was determined
according to Huang et al.26 using a PerkinElmer
spectrofluorometer model Victor X4 (Waltham, MA, USA). Twenty microliters of extract, appropriately diluted with the same extracting solution, was added to the microplates. For the blank and the calibration curve, 20.0 µL of extracting and Trolox solutions were analyzed, respectively.
Two hundred microliters of fluorescein 4.0 nmol L−1 in
phosphate buffer (pH = 7) was added.
The microplate was inserted into the spectrofluorometer
and heated to 37 °C. Then, 75.0 µL of 17.2 mg mL−1
2,2-azobis(2-aminopropane) dihydrochloride (AAPH) solution were added for L-ORAC analysis. For H-ORAC
analyses, the concentration of AAPH was 8.6 mg mL−1. After
these respective additions, the reading was immediately initiated, until the completion of 30 cycles at intervals of 1 min. The employed emission and excitation wavelengths were 515 and 485 nm, respectively. The results were
expressed in µmol Trolox equivalents (TE) per gram of
dried sample. The following calibration curves were used for L-ORAC (equation 5) and H-ORAC (equation 6):
y = 0.1957x + 1.8651 (r2 = 0.9856) (5)
y = 0.3412x + 1.7224 (r2 = 0.9916) (6)
where x is ORAC in µmol g−1 TE, and y is the area under the
fluorescence decay curve (AUC) of the sample or standard minus the area under the fluorescence decay curve of the blank. AUC can be calculated by:
(7)
where f0 is the initial fluorescence read at 0 min and fn is
the fluorescence read at time.
Statistical analysis
All of the statistical analyses were performed using Statistica 8.0 software (StatSoft, Tulsa, OK, USA) and refer
to the means of three tests. The PCA was performed after the standardization (mean from values for each variable was subtracted of each variable value and the result was divided by standard deviation of the values for each variable).
Results and Discussion
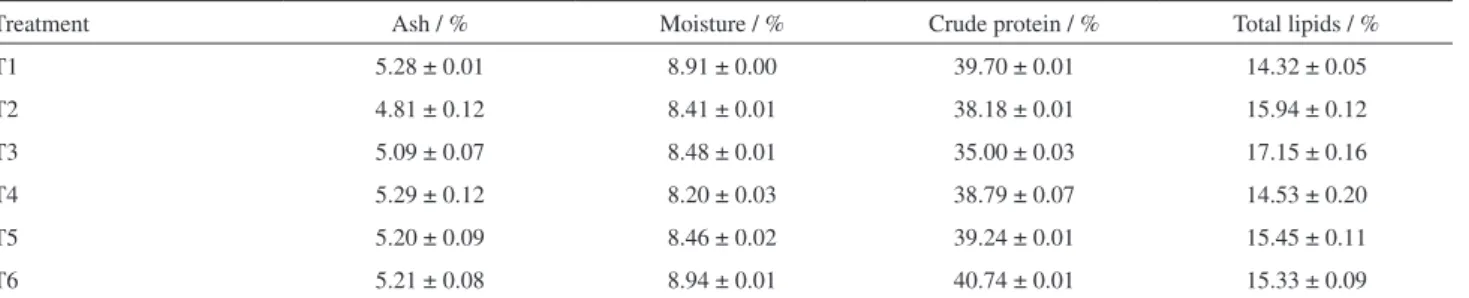
The mean values of the ash, moisture, crude protein, and total lipids contents are listed in Table 2. The moisture analysis results demonstrated that there was little variation in moisture (8.20-8.94%) among the samples. Similar values (8.24-9.68%) were reported by
de Barros et al.27 when studying the effects of irradiation
on soybean composition. However, lower values (5.60%)
were determined by Silva et al.28 when comparing the
chemical composition and the protein values of soy okara with soybean. The ash contents varied within 4.81 and 5.28%. The crude protein content ranged between 35.00 and 40.74%. The total lipid contents were between 14.32 and 15.94%. The mean values of these components were
similar to those reported by previous research studies.27,28
Such variations may be related to weather conditions, geographical location, soil characteristics, and selected
agronomic procedures.29,30
Table 3 presents the composition of fatty acids
quantified as mg of fatty acid per gram of total lipids
(mg FA g−1 TL). Ten fatty acids could be identified
and quantified and were classified as SFA, MUFA and PUFA. Palmitic acid (16:0) was present in the greatest quantity among all of the SFA in all samples, followed by stearic acid (18:0). The concentrations of these fatty acids ranged from approximately 112 to 116 and
from 40 to 45 mg FA g−1 TL for the 16:0 and 18:0 FA,
respectively. Oleic acid (18:1 n-9) was the primary monounsaturated fatty acid in all samples analyzed,
ranging from 220-247 mg FA g−1 TL. Studies have shown
that the presence of oleic acid in the human diet reduces the blood levels of low-density lipoprotein (LDL), a tumor genesis suppressor, ameliorating inflammatory diseases
and reducing blood pressure.31 Additionally, essential
Table 2. Proximate composition of soybeans
Treatment Ash / % Moisture / % Crude protein / % Total lipids / %
T1 5.28 ± 0.01 8.91 ± 0.00 39.70 ± 0.01 14.32 ± 0.05
T2 4.81 ± 0.12 8.41 ± 0.01 38.18 ± 0.01 15.94 ± 0.12
T3 5.09 ± 0.07 8.48 ± 0.01 35.00 ± 0.03 17.15 ± 0.16
T4 5.29 ± 0.12 8.20 ± 0.03 38.79 ± 0.07 14.53 ± 0.20
T5 5.20 ± 0.09 8.46 ± 0.02 39.24 ± 0.01 15.45 ± 0.11
T6 5.21 ± 0.08 8.94 ± 0.01 40.74 ± 0.01 15.33 ± 0.09
polyunsaturated fatty acids, including LNA (18:3 n-3) and LA (18:2 n-6), were identified and quantified in all of the samples analyzed. The concentrations of LNA, ranging
from approximately 67 to 77 mg FA g−1 TL, were lower than
those of LA. According to Gebauer et al.,32 the daily intake
of LNA and LA to human body do 1 g of eicosapentaenoic acid (EPA) and docosahexaenoic acid (DHA; main purpose of ingesting LNA and LA) through biosynthesis are 1.6 and 1.1 g for men and women, respectively (Table 3). The better concentration of DHA and EPA is around
500 mg day−1. Thus, men have to intake about 10 g and
women 7 g of soybean oil, in relation of LNA; and 1.7 and 1 g of soybean oil in relation LA, respectively. Considering the importance of this nutrient (LNA) for human nutrition, several research studies conducted in the area of food technology have evaluated dietary supplementation with this fatty acid for freshwater fish, using vegetable oils as sources of LNA, to promote the incorporation of LNA in fish muscles and to stimulate the biosynthesis of other fatty
acids with important nutritional value.14,31,33 However, LA
was the dominant fatty acid of both the PUFA class and the other classes, SFA and MUFA, in all of the samples (Table 3).
The sums of SFA, MUFA, PUFA, n-3, and n-6 fatty acids, and the n-3/n-6 and SFA/PUFA ratios were assessed (Table 3). The sum of polyunsaturated fatty acids was higher than the sum of the others saturated and monounsaturated fatty acids. The sum of n-6 fatty acids was higher than that of n-3, thus, resulting in a small ratio between these two classes (n-3 and n-6). This relationship
was also observed by Galão et al.34 when examining 20
conventional and transgenic soybean varieties grown in various regions. Studies that have assessed the proximate fatty acid profile and the composition of soybean samples
from various varieties have also reported similar results.35
A diet with a n-6/n-3 ratio of 4.0 is associated with a 70%
reduction in death caused by coronary artery disease.36 A
reduction in cancerous cells in the rectal region may be observed for a n-6/n-3 ratio of 2.5.
PUFA/SFA ratio is not a suitable measure of the atherogenicity index (AI) or thrombogenicity index (TI)
of a diet or of a specific food.37 PUFA/SFA ratio was
inverted in order to a greater AI was associated with a greater amount of atherogenic dietary components. This index was designed with the smaller-chain fatty acids, excluding stearic acid (C18:0) from the SFAs, and with the
Table 3. Composition, sums, ratios, atherogenicity index (AI), and thrombogenicity index (TI) of fatty acids in soybean seeds collected from treatments of varying numbers of fungicide applications
Fatty acid /
mg (fatty acid) g-1 (total lipids)
Treatment
T1 T2 T3 T4 T5 T6
16:0 116.21 ± 4.26 112.19 ± 0.76 115.66 ± 4.28 110.55 ± 5.19 112.52 ± 2.12 112.63 ± 3.10
18:0 45.91 ± 5.40 39.59 ± 0.38 43.36 ± 1.12 40.98 ± 1.78 42.51 ± 1.29 41.01 ± 1.12
18:1 n-9 246.75 ± 9.80 229.67 ± 2.10 220.37 ± 5.67 246.87 ± 11.10 247.36 ± 6.40 243.34 ± 6.37
18:1 n-7 13.94 ± 0.49 13.55 ± 0.09 13.61 ± 0.36 13.77 ± 0.62 13.88 ± 0.28 13.82 ± 0.43
18:2 n-6 440.48 ± 23.42 461.84 ± 4.27 464.24 ± 12.35 449.03 ± 20.60 449.14 ± 8.93 457.54 ± 11.84
18:3 n-3 67.34 ± 10.11 68.58 ± 0.61 77.52 ± 2.18 67.78 ± 3.26 70.21 ± 0.93 70.95 ± 1.89
20:0 4.77 ± 0.80 3.77 ± 0.05 4.24 ± 0.11 4.08 ± 0.20 4.28 ± 0.18 4.12 ± 0.09
20:1 n-9 2.51 ± 0.32 2.19 ± 0.11 2.08 ± 0.06 2.28 ± 0.10 2.35 ± 0.16 2.24 ± 0.05
22:0 4.82 ± 1.07 3.69 ± 0.09 3.97 ± 0.18 3.96 ± 0.21 4.12 ± 0.22 4.01 ± 0.10
24:0 2.04 ± 0.52 1.15 ± 0.11 1.45 ± 0.18 1.27 ± 0.10 1.57 ± 0.23 1.47 ± 0.13
SFA 173.75 ± 7.02 160.39 ± 0.86 168.68 ± 4.43 160.84 ± 5.50 164.99 ± 2.51 163.23 ± 3.30
MUFA 263.20 ± 9.81 245.40 ± 2.11 236.07 ± 5.68 262.91 ± 11.11 263.58 ± 6.41 259.40 ± 6.38
PUFA 507.82 ± 25.51 530.41 ± 4.31 541.76 ± 12.54 516.81 ± 20.86 519.35 ± 8.97 528.49 ± 11.99
n-3 67.34 ± 10.11 68.58 ± 0.61 77.52 ± 2.18 67.78 ± 3.26 70.21 ± 0.93 70.95 ± 1.89
n-6 440.48 ± 23.42 461.84 ± 4.27 464.24 ± 12.35 449.03 ± 20.60 449.14 ± 8.93 457.54 ± 11.84
n-3/n-6 0.15 ± 0.02 0.15 ± 0.00 0.17 ± 0.00 0.15 ± 0.01 0.16 ± 0.00 0.16 ± 0.00
AI 0.11 0.11 0.12 0.11 0.11 0.11
TI 0.24 0.22 0.23 0.22 0.22 0.22
MFAs included with the PUFAs. To assess the TI index, we also started with the SFA/PUFA ratio, excluding the 14:0, 16:0, and 18:0 fatty acids from the SFAs and including the MUFA and the PUFAs of the n-6 and n-3 series. The TI values ranged from 0.22 to 0.24. The indices assessed in the present study were similar to those of soybean oil (0.14) and olive oil (0.17) included in the reference table
proposed for several foods.37 The Eskimo diet, characterized
by a high intake of long-chain n-3 fatty acids from deep- and cold-water fish is characterized by a value of 0.28. The AI values were the same for all samples (0.11), except for the sample derived from the third period, T3, which was 0.12. Foods with similar values when compared to the same reference included soybean oil and olive oil (0.07 and 0.14, respectively).
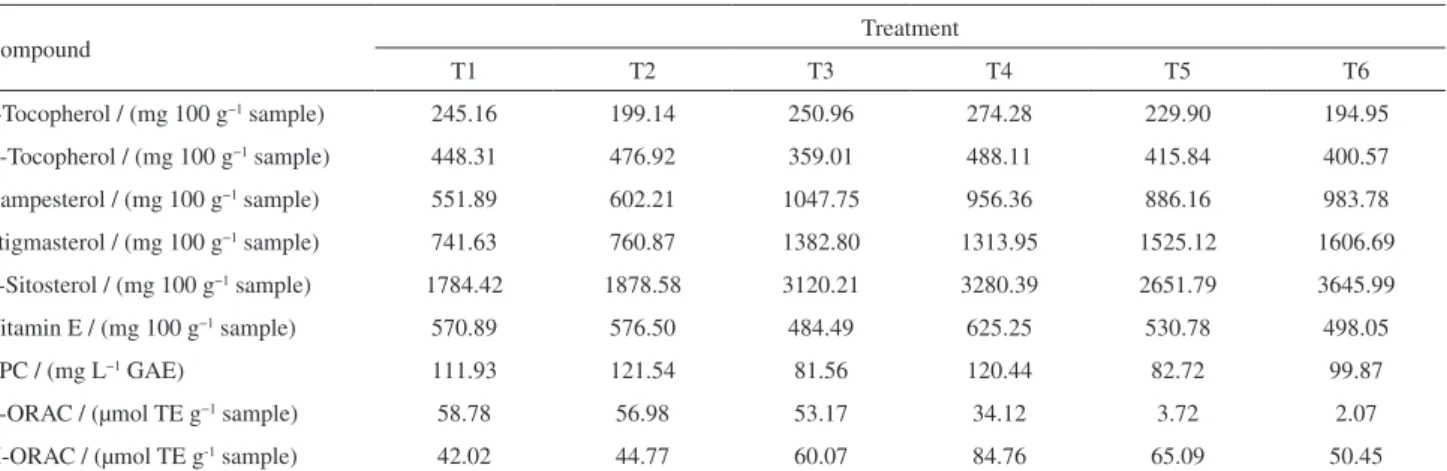
Table 4 provides the composition of phytosterols and tocopherols, quantified as mg of the phytochemical
per 100 g of soybean (mg 100 g−1 sample). Campesterol,
stigmasterol, and β-sitosterol are among the phytosterols
that were identified and quantified. The levels of
β-sitosterol were the highest of the three in all samples
for all of the spraying periods, ranging approximately
from 1.700 to 3.646 mg 100 g−1 sample, followed by
stigmasterol (from 741.63 to 1606 mg 100 g−1 sample),
and lower levels of campesterol, which ranged from
551.89 to 1047.75 mg 100 g−1 sample. A study on the
composition of phytosterols in wheat samples reported higher concentrations of stigmasterol than campesterol
and β-sitosterol.37 A study involving Turkish apricot seed
oil concluded that β-sitosterol was the main compound
of this class, while stigmasterol was present in the lowest
content.38 Therefore, the characteristics of the phytosterol
profiles from vegetable oils may differ depending on the matrix evaluated.
As shown in Table 4, γ-tocopherol and α-tocopherol
were also detected and quantified as mg of phytochemical
per 100 g of soybean (mg 100 g−1 sample). The levels
of α-tocopherol were greater than those of γ-tocopherol
in all samples, with values ranging from 194.00 to
488.11 mg 100 g−1 sample. All the values of vitamin E
(Vit. E) activity, expressed as the α-tocopherol equivalent in
mg 100 g−1 sample, were calculated based on the quantities
of Vit. E activity ratios for α-, β-, γ-, and δ-tocopherols of
1.0, 0.5, 0.1, and 0.03 ratios.39 The sample collected for
the fourth spraying period treatment (T4) had the highest
α-tocopherol equivalent, followed by T2, T1, T5, T6, and
T3. The results ranged from 484.49 to 625.25 α-tocopherol
equiv. in mg 100 g−1 sample.
TPC contents were assessed in all of the samples (Table 4)
and quantified as the gallic acid equivalent (mg L−1 GAE).
The results ranged from 81.56 to 121.54 mg L−1 GAE. The
T2 and T4 samples, sprayed six and four times, respectively, contained the highest TPC contents, followed by the T1, T6, T5, and T3 samples. Therefore, the extracts were assessed according to these different classes: hydrophilic and lipophilic. For T1, T2, and T3, there is a notable predominance of the lipophilic portion, with values of
58.78, 56.98, and 53.17 µmol Trolox equivalents g−1 sample
(µmol TE g−1 sample), respectively. The results for T4,
however, were notable with regards to the hydrophilic
portion, with a value of 84.76 µmol TE g−1 sample.
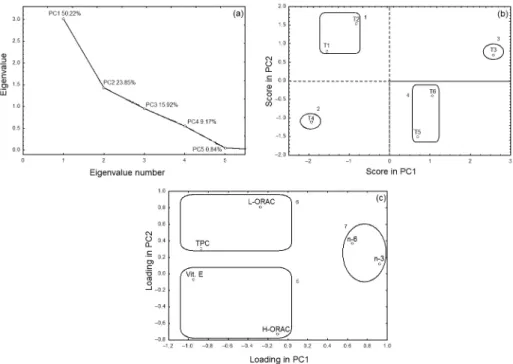
Figure 2 presents the PCA performed for soybean samples subjected to different numbers of sprayings as related to the antioxidant and omega-3 and omega-6 fatty acid results, including the correlation matrix for the
eigenvalues, the PC1 × PC2 scores and the PC1 × PC2
loadings. The number of principal components that is used to explain the variation in the data may be assessed
Table 4. Phytosterols, tocopherols, vitamin E and antioxidant compounds in soybean seeds collected from treatments of varying numbers of fungicide applications
Compound Treatment
T1 T2 T3 T4 T5 T6
γ-Tocopherol / (mg 100 g−1 sample) 245.16 199.14 250.96 274.28 229.90 194.95
α-Tocopherol / (mg 100 g−1 sample) 448.31 476.92 359.01 488.11 415.84 400.57
Campesterol / (mg 100 g−1 sample) 551.89 602.21 1047.75 956.36 886.16 983.78
Stigmasterol / (mg 100 g−1 sample) 741.63 760.87 1382.80 1313.95 1525.12 1606.69
β-Sitosterol / (mg 100 g−1 sample) 1784.42 1878.58 3120.21 3280.39 2651.79 3645.99
Vitamin E / (mg 100 g−1 sample) 570.89 576.50 484.49 625.25 530.78 498.05
TPC / (mg L−1 GAE) 111.93 121.54 81.56 120.44 82.72 99.87
L-ORAC / (µmol TE g−1 sample) 58.78 56.98 53.17 34.12 3.72 2.07
H-ORAC / (µmol TE g-1 sample) 42.02 44.77 60.07 84.76 65.09 50.45
in Figure 2a. Only two components were selected for this purpose, explaining approximately 74% of the total data variance, with 50.22 and 23.85% explained by PC1 and PC2, respectively. Four groups are discernible when
examining Figure 2b, the plot of the PC1 × PC2 scores, with
the first group consisting of samples derived from the first and second treatment periods (T1 and T2), the second group consisting of treatment T3, the third group consisting T4 and the fourth group composed of T5 and T6. The samples were distributed across positive and negative values on PC1, the principal component responsible for explaining the majority of the data, with T4 in the negative extreme and T3 in the positive extreme. These groups were formed based on direct relationships with the variables examined in the experiment, which were Vit. E, TPC, L-ORAC, H-ORAC, n-6 and n-3 (Figure 2c). The variables L-ORAC, positive on PC2; and TPC, negative on PC1; were significant for the formation of group 1, samples T1 and T2. However, the variables n-6 and n-3, which had positive values for two components, were significant for the formation of third group (T3). T3 was placed to the extreme positive side of the figure because of the higher concentration of n-3. Vit. E and H-ORAC variables, which had negative values, were important for the formation of group 2 (T4). The last group was formed based on L-ORAC variable, because the results for this analysis were smallest when compared with all samples.
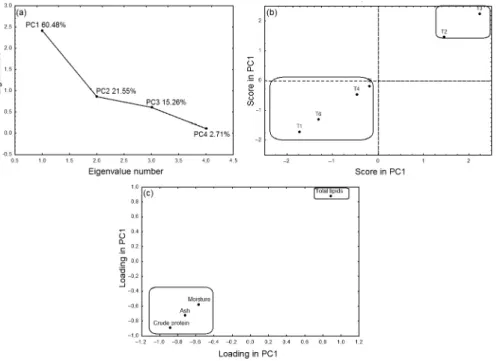
The moisture, ash, crude protein, and total lipid results were also correlated with a principal component analysis
(Figure 3). In contrast to the previously discussed results (Figure 2a), only one principal component sufficed to explain approximately 60% of the variation in the data in this analysis. The proximate analysis results for the ash, crude protein, and moisture variables were highly correlated, resulting in similar negative values for PC1 among them, in contrast to the total lipid variable, which is represented on the opposite side of the graph, with positive values for this principal component. Therefore, two groups were formed: group one, consisting of T1, T4, T5 and T6; and group 2, consisting of T2 and T3. The first group was characterized by the similarity among the results recorded for all of the analyses, except the total lipids that had an extreme positive value on PC1. The results for samples T2 and T3 differed from those of the other samples for the same analyses.
Conclusions
The variation in the numbers of spray during the crop development conclusively failed to significantly change the proximate composition of soybean, including the total lipid, moisture, ash, and crude protein levels. However, the content of phenolic compounds and the levels of phytosterols and tocopherols exhibited large variations. From the multivariate statistical analysis, the TPC, L-ORAC, H-ORAC, Vit. E, n-3, and n-6 contents were notable different for T1, T2, T3, and T4. The treatments with no spraying and four sprayings periods are suitable
to produce soybeans with the highest levels of TPC and Vit. E. The treatment with six sprayings periods for soybeans was associated with high levels of TPC, Vit. E and omega-6 fatty acids, and the soybeans from the five sprayings period treatment were rich in fatty acids of the n-3 series.
References
1. Cardoso, N. M.; Moraes, R. C.; Koester, L. S.; Bassani, V. L.; von Poser, G. L.; Texeira, H. F.; Phytochem. Rev.2015, 14, 849. 2. Chen, K.-I.; Erh, M.-H; Su, N.-W.; Liu, W.-H.; Chou, C.-C;
Cheng, K.-C.; Appl. Microbiol. Biotechnol. 2012, 96, 9. 3. Hartmann, M. A.; Trends Plant Sci. 1998, 3, 170.
4. Lagarda, M. J.; García-Latas, G.; Farré, R.; J. Pharm. Biomed. Anal.2006, 41, 1486.
5. Toivo, J.; Phillips, K.; Lampi, A. M.; Piironen, V.; J. Food Compos. Anal.2001, 14, 631.
6. Yang, J.; Zhou, F.; Xiong, L.; Mao, S.; Hu, Y.; Lu, B.; LWT--Food Sci. Technol, 2015, 62, 541.
7. Chatrapa, H.; Hasso, E. H.; McCarthy, K.; Wang, P.; Oda, K.; Sebate, J.; J. Nutr.2011, 141, 56.
8. Tong, L. Y.; Wong, W. T.; Guan, L.; Tian, X.; Ma, K. Y.; Huang, Y.; Chen, Z. Y.; Atherosclerosis (Amsterdam, Neth.)
2011, 219, 124.
9. Mozaffarian, D.; Wu, J. H.; J. Nutr.2012, 142, 614.
10. dos Santos, H. M. C.; Nishiyama, M. F.; Bonafe, E. B.; de Oliveira, C. A. L.; Matsushita, M.; Visentainer, J. V.; Ribeiro, R. P.; J. Am. Oil Chem. Soc. 2014, 91, 1939.
11. Calder, P. C.; Proc. Nutr. Soc.2013, 72, 326.
12. Wu, Z. G.; Rodgers, R. P.; Marshall, A. G.; J. Agric. Food Chem.
2004, 52, 5322.
13. Hair, J. F.; Anderson, R. E.; Tatham, R. L.; Black, W. C.; Análise Multivariada de Dados,5a ed.; Bookman: Porto Alegre, 2006. 14. Carbonera, F.; Bonafe, E. G.; Martin, C. A.; Montanher, P. F.;
Ribeiro, R. P.; Figueiredo, L. C.; Almeida, V. C.; Visentainer, J. V.; Food Chem.2014, 148, 230.
15. Ribeiro, A. B.; Bonafe, E. G.; Silva, B. C.; Montanher, P. F.; Santos-Junior, O. S.; Boeing, J. S.; Visentainer, J. V.; J. Braz. Chem. Soc.2013, 24, 797.
16. Regueiro, J.; Olguin, N.; Simal, J. G.; Sumol, C.; Environ. Res.
2015, 140, 37.
17. Kamel, F.; Hoppin, J. A.; Environ. Health Perspect.2004, 112, 950.
18. Cunniff, P. A.; Official Methods of Analysis of AOAC International, 16th ed.; Association of Official Analytical Chemists: Washington, 1995.
19. Bligh, F. G.; Dyer, W. J.; Can. J. Biochem. Physiol.1959, 37, 911.
20. Duchateau, G. S. M. J. E.; Bauer-Plank, C. G.; Louter, A. J. H.; van der Ham, M.; Boerma, J. A.; van Rooijen, J. J. M.; Zandbelt, P. A.; J. Am. Oil Chem. Soc. 2002, 79, 273.
21. Ozogul, Y.; Ayas, D.; Yazgan, H.; Eur. J. Lipid Sci. Technol.
2013, 115, 356.
22. Joseph, J. D.; Ackman, R. G.; J. AOAC Int.1992, 75, 488. 23. Visentainer, J. V.; Quim. Nova2012, 35, 274.
24. Singleton, V. L.; Rossi Jr., J. A.; Am. J. Enol. Vitic.1965, 16, 144.
25. Wu, C.; Duckett, S. K.; Neel, J. P. S.; Fontenot, J. P.; Clapham, W. M.; Meat Sci.2008, 80, 662.
26. Huang, D.; Ou, B.; Hampsch-Woodill, M.; Flanagan, J.; Deemer, E. K.; J. Agric. Food Chem.2008, 50, 1815.
27. de Barros, E. A.; Broetto, F.; Bressan, D. F.; Sartori, M. M. P.; Costa, V. E.; Radiat. Phys. Chem.2014, 98, 29.
28. Silva, M. S.; Naves, M. M. V.; de Oliveira, R. B.; Leite, O. S. M.;
Cienc. Tecnol. Aliment. (Campinas, Braz.)2006, 26, 571. 29. Souza, L. C. F.; Zanon, G. D.; Pedroso, F. F.; Andrade, L. H. L.;
Cienc. Agrotecnol.2009, 33, 1586.
30. Kumar, V.; Rani, A.; Solanki, S.; Hussain, S. M.; J. Food Compos. Anal.2006, 19, 188.
31. Bonafé, E. G.; Boeing, J. S.; Matsushita, M.; Claus, T.; Santos, O. O.; de Oliveira, C. C.; Eberlin, M. N.; Visentainer, J. V.; Eur. J. Lipid. Sci. Technol.2013, 115, 1139.
32. Gebauer, S. K.; Psota, T. L.; Harris, W. S.; Kris-Etherton, P. M.;
Am. J. Clin. Nutr.2006,83, 1526.
33. Milinski, M. C.; Visentainer, J. V.; Martin, C. A.; Arias, C. A. A.; Matsushita, M.; Souza, N. E.; EJEAFChe, Electron J. Environ., Agric. Food Chem.2007, 6, 1905.
34. Galão, O. F.; Carrão-Panizzi, M. C.; Gontijo-Mandarino, J. M.; Santos-Júnior, O. O.; Maruyama, S. A.; Figueiredo, L. C.; Bonafe, E. G.; Visentainer, J. V.; Food Res. Int.2014, 62, 589. 35. Simopoulos, A. P.; World Rev. Nutr. Diet.2011, 102, 10. 36. Ulbricht, T. L.; Southgate, D. A. T.; Lancet1991, 338, 985. 37. Nurmi, T.; Lampi, A. M.; Nystro, L.; Piironen, V.; J. Agric. Food
Chem.2010, 58, 9314.
38. Turan, S.; Topcu, A.; Karabulut, I.; Vural, H.; Hayaloglu, A. A.;
J. Agric. Food Chem. 2007, 55, 10787.
39. Arnao, M. B.; Cano, A.; Acosta, M.; Food Chem.2001, 73, 239.