1
Universidade Federal do Rio de Janeiro, Centro de Ciências da Saúde, Departamento de Nutrição Social e Aplicada. Av. Carlos Chagas Filho, 373, Bloco J, 2º andar, Cidade Universitária, 21941-902, Rio de Janeiro, RJ, Brasil. Correspondência para/ Correspondence to: RA PEREIRA. E-mails: <[email protected]>; <[email protected]>.
2
Universidade de Coimbra, Centro de Investigação em Antropologia e Saúde, Departamento de Ciências da Vida. Coimbra, Portugal.
3
Universidade Federal de Mato Grosso, Faculdade de Nutrição, Programa de Pós-Graduação em Nutrição, Alimentos e Metabolismo. Cuiabá, MT, Brasil.
Support: Fundação de Amparo à Pesquisa do Estado do Mato Grosso (Process nº 281836/2010), and Coordenação de Aperfeiçoamento de Pessoal de Nível Superior (Process nº 8349/12-6).
Multiple risk behaviors for
non-communicable diseases
and associated factors in adolescents
Múltiplos comportamentos de risco para
doenças não transmissíveis em
adolescentes e fatores associados
Paulo Rogério Melo RODRIGUES1,3
Cristina Maria Proença PADEZ2
Márcia Gonçalves FERREIRA3
Regina Maria Veras GONÇALVES-SILVA3
Rosangela Alves PEREIRA1
A B S T R A C T
Objective
To estimate the prevalence of risk behaviors for non-communicable diseases and analyze their associated factors in adolescents.
Methods
Results
The most common risk behaviors were excessive sodium intake (88%), unsatisfactory meal pattern (72%), excessive intake of saturated fat (39%), and alcohol experimentation (39%). Four of 10 adolescents were exposed to two risk behaviors simultaneously. Among male adolescents, the main factors associated with risk behaviors were: type of school, class schedule, education level of the household head, weight status, and self-perceived health status. Among female adolescents, age, type of school, class schedule, and education level of the household head were the main factors associated with risk behaviors.
Conclusion
The prevalence of exposure to risk behaviors for non-communicable diseases was high, highlighting the simultaneous presence of tobacco smoking and experimentation of alcoholic beverages. Special attention should be given to educational activities to minimize the effects of the simultaneous occurrence of multiple risk behaviors.
Keywords: Adolescents. Adolescent behavior. Life style. Risk-taking. Social class.
R E S U M O
Objetivo
Estimar a prevalência de comportamentos de risco para doenças não transmissíveis e analisar seus fatores associados em adolescentes.
Métodos
Estudo transversal de base escolar realizado em 2008 com 1.139 estudantes do ensino médio, entre 14 e 19 anos de idade, de escolas públicas e privadas de Cuiabá, Mato Grosso. Aplicou-se questionário autoadministrado, incluindo Questionário de Frequência Alimentar. Avaliou-se a prevalência de tabagismo, experimentação de álcool, inatividade física, padrão de refeições e ingestão excessiva de gordura saturada e sódio. Foram analisadas as associações entre os comportamentos de risco e variáveis socioeconômicas, status de peso e autopercepção do estado de saúde.
Resultados
Os comportamentos de risco mais comuns foram: ingestão excessiva de sódio (88%), padrão de refeições insatisfatório (72%), consumo excessivo de gordura saturada (39%) e experimentação de álcool (39%). Quatro em cada 10 adolescentes foram expostos a dois comportamentos de risco simultaneamente. Entre os meninos, os principais fatores associados aos comportamentos de risco foram: tipo de escola, turno de aula, escolaridade do chefe da família, status de peso e autopercepção do estado de saúde. Entre as meninas, a idade, o tipo de escola, o turno de estudo e a escolaridade do chefe da família foram os principais fatores associados aos comportamentos de risco.
Conclusão
A prevalência de exposição a comportamentos de risco para doenças não transmissíveis foi elevada, destacando a presença simultânea de tabagismo e experimentação de bebidas alcoólicas. Deve ser dada especial atenção às atividades educativas, visando minimizar os efeitos da ocorrência simultânea de múltiplos comportamentos de risco.
Palavras-chave: Adolescentes. Comportamentos do adolescente. Estilo de vida. Assunção de riscos. Classe social.
I N T R O D U C T I O N
Non-Communicable Diseases (NCD) are the leading causes of death in Brazil, accounting for 72% of deaths in 20071. The etiology of these disorders is multifactorial, involving non-modifiable factors, including age, sex, and family
history, and modifiable factors, including specific lifestyle habits that are considered risk behaviors for NCD2.
risk of developing or worsening diseases4. The occurrence of these behaviors in adolescence, both in Brazil5-9 and in other countries2,10-17, has been associated with an increased risk of developing NCD in adulthood18. Furthermore, the simultaneous occurrence of multiple risk behaviors is common in adolescents4,6, which may potentiate the risk for those diseases in adulthood.
Thus, evaluating the relationships between multiple risk behaviors for NCD may help to identify groups at higher risk and assist in designing intervention programs. However, few studies have been conducted in Brazil on the simultaneous occurrence of NCD risk behaviors. The aim of this study was to estimate the prevalence of NCD risk behaviors in adolescents and analyze those behaviors’ associated factors.
M E T H O D S
This was a cross-sectional, school-based study conducted in 2008 in the urban area of the municipality of Cuiabá, capital of the state of Mato Grosso, located in the midwestern region of Brazil. The subjects were male and female students aged 14-19 years from public and private high schools.
The primary objective of the main study was to evaluate risk behaviors for eating disorders. A 95% level of confidence and 3% sampling error were chosen, and because no specific studies on risk behavior for eating disorders in adolescents from Cuiabá have been conducted, a prevalence of 0.50 was considered for the purpose of calculating sample size. The sample size was estimated at 1,067 adolescents and increased by 20% to consider the effect of cluster sampling (deff=1.2), totaling 1,280 adolescents from 10 schools.
A multistage technique was used to select a stratified sample proportional to the number of students in each type of school. According to the 2006 School Census (Department of Education, State of Mato Grosso), 30,584 adolescents from that age group were enrolled in the schools of
Cuiabá, 22,082 attending state schools, 1,085
attending federal schools, and 7,417 attending private schools. For logistic reasons, only schools with at least 400 students were eligible for the study (23 of 62 schools, totaling 23,501 students). These 23 schools were strategically located in four geographic regions of the city. The only federal high school was included in the study because it was self-representative. Additionally, to maintain the proportionality in the number of students enrolled in each type of school, seven state schools (of 18 eligible schools) and two private schools (of four eligible schools) were systematically selected to complete the sample. In each school classrooms were randomly selected until a minimum of 128 students was reached.
Adolescents and/or their parents/guardians signed an informed consent form, agreeing to participate in the study. An authorization for data collection was also obtained from the schools. The study was approved by the Research Ethics Committee of the Júlio Muller University Hospital of the Universidade Federal do Mato Grosso
(Protocol #459/CEP-HUJM/07).
The adolescents filled out a standardized self-administered questionnaire in the classrooms, with questions concerning socioeconomic characteristics, lifestyle and eating habits, and a semiquantitative Food Frequency Questionnaire (FFQ). The schools were visited three times to track down students absent in previous visits to decrease the non-response rate. A pretest of the research protocol and a pilot study were conducted in a school that was not included in the sample in order to test the understanding of the questionnaire, correct possible flaws, and standardize data collection.
The following risk behaviors for NCD were evaluated:
- Experimentation of alcoholic beverages: experimentation of alcoholic beverages (beer, wine, and spirits) was obtained from the FFQ. Adolescents were classified as alcoholic beverage reporters (regardless of amount, frequency, and type) and non-reporters.
- Physical activity: the type, frequency, and duration of a list of leisure-time activities performed in the last three months were examined. The weekly time devoted to leisure-time physical activity was estimated by multiplying the daily time (in minutes) by the weekly frequency with which the activities were conducted. The level of physical activity was classified as suggested by Currie et al.20: adolescents who reported practicing no physical activity were classified as physically inactive; those who practiced up to 299 minutes/week, as insufficiently active; and those who practiced at least 300 minutes of physical activity weekly, as active.
- Meal consumption: the frequency of breakfast, morning snack, lunch, afternoon snack, and dinner consumption in the last six months was ascertained by the question: “On average, how often did you have these meals in the past six months?”. The response options were: every day, three to six times/week, one to two times/ week, and never. Meal consumption profile was categorized into three groups: satisfactory, irregular, and unsatisfactory. Adolescents with a satisfactory meal profile had at least the three main meals (breakfast, lunch, and dinner) daily, as recommended by the Food Guide for the Brazilian Population21. Adolescents who had only one or two of the three main meals daily were classified as having an irregular meal profile. Finally, adolescents who did not have any of the three main meals daily were classified as having an unsatisfactory meal profile. Satisfactory, irregular, and unsatisfactory meal profiles may or may not include one or more snacks daily.
- Inadequate food consumption: food consumption was evaluated using an FFQ validated for adults of Cuiabá22, which was
modified to be administered in adolescents23. The FFQ consisted of 76 food items, with up to three options of standard portions for reporting the quantities consumed and eight response options for consumption frequency, ranging from more than three times/day to never or almost never. The FFQ timeframe was the last six months before the interview. The consumption of energy and nutrients was evaluated using the software NutWin, version 2.5 (developed by Universidade Federal de São Paulo, Brazil)24. The nutritional composition of foods not listed in the NutWin software was found in the Brazilian “Tabela Brasileira de Composição de Alimentos” (Table of Food Composition)25 and in the Nutrition Data System for Research26. Inadequate food consumption was defined as saturated fat consumption higher than 10% of total energy consumption, as recommended by the WHO27, and sodium consumption higher than 1 g/1000 kcal, as recommended by the Brazilian Ministry of Health21.
Socioeconomic level was assessed according to the household head education level (in years of formal education), considering the highest level reached and type of school (federal, state, and private), as used in other studies with Brazilian adolescents28.
Age (in full years) was calculated by the difference between the date of data collection and the date of birth, and two groups were considered for analyses: 14-15 year-olds and 16-19 year-olds. Students were also categorized according to class schedule (morning, afternoon).
Self-perceived health status was assessed by the statement: “Compared with same-age peers, you consider your health status to be...”, and the answer options: very good, good, fair, or bad. For analytical purposes, the answers were grouped into “good” (very good and good) and “bad” (fair and bad).
BMI-for-age ≤+1 Z-score were classified not having excess weight, and those with BMI-for-age >+1 Z-score as having excess weight. The latter category comprised overweight and obesity. For logistic reasons, it was not possible to measure the students’ weight and height, so BMI was calculated using self-reported weight and height. Self-reported weight and height has been validated by Rodrigues et al.30 for use in epidemiological studies of adolescents from
Cuiabá. There was no statistically significant difference between self-reported and measured weight and height (p=0.30 and 0.76, respectively); the intraclass correlation coefficients were >0.95 in both sexes, and the mean interrater reliability, estimated according to the method of Bland-Altman, was 99% for weight and 100% for height30.
The risk behaviors of each adolescent were added to evaluate the frequency of simultaneous occurrence of multiple risk behaviors: tobacco smoking, alcohol experimentation, physical inactivity, unsatisfactory meal pattern, and inadequate food consumption. The adolescents were classified according to the number of behaviors they were exposed to: no exposure or exposure to one, two, and three or more risk behaviors.
The analyses were conducted by sex because of statistically significant differences in the risk behaviors of male and female adolescents. The Chi-squared test was used in the bivariate analysis to compare prevalence of risk behaviors (when they occurred alone or in combination) according to socioeconomic level, weight status, and self-perceived health status.
Multivariate logistic regression models evaluated the associations between risk behaviors. Each behavior was considered a dependent variable in one of the models (model 1: experimentation of alcoholic beverages; model 2: physical inactivity; model 3: unsatisfactory meal consumption; model 4: inadequate food consumption), and the other behaviors were included as independent variables in each model.
If any socioeconomic variable, weight status, or self-perceived health status had p<0.20 in univariate analysis, they were included in the respective models to control for the confounding factors for each behavior.
In addition, Poisson regression models evaluated the associated factors with the simultaneous occurrence of risk behaviors. Each number of risk behavior was considered a dependent variable in one of the models (model 1: at least one risk behavior; model 2: two risk behaviors; model 3: three or more risk behaviors). Socioeconomic variables, weight status, or self-perceived health status with p<0.20 in univariate analysis were included as independent variables in each model to control for the confounding factors for each behavior. Thus, crude and adjusted models for Poisson regression models are presented.
The statistical analyses were performed considering the weights and sample design by using the command weight cases of the statistical software Statistical Package for the Social Sciences (SPSS Inc., Chicago, Illinois, United States) version 19.0 and Stata for Windows (Microsoft Corporation, Redmond, Washington, United States) version 12.0 (Stata Corporation, College Station, Texas, United States).
R E S U L T S
from public schools. Seventy-five percent of the adolescents perceived their health status as good (males: 80.0%; females: 71.0%; p<0.01), and 17.0% had excess weight (including obesity) (males: 24%; females: 11.0%; p<0.01).
The most prevalent risk behaviors for NCD were excessive sodium intake (88%), unsatisfactory meal consumption (72%), excessive intake of saturated fat (39%), and experimentation
of alcoholic beverages (39%). Only 18% of the adolescents reported ≤1 risk behavior; 44% were exposed to two and 38% to three or more risk behaviors simultaneously. Male adolescents had a higher prevalence of excessive sodium intake (91 versus 85%), experimentation of alcoholic beverages (47 versus 32%), and tobacco smoking (9 versus 4%) than female adolescents (p<0.01 for all). Conversely, female adolescents had a
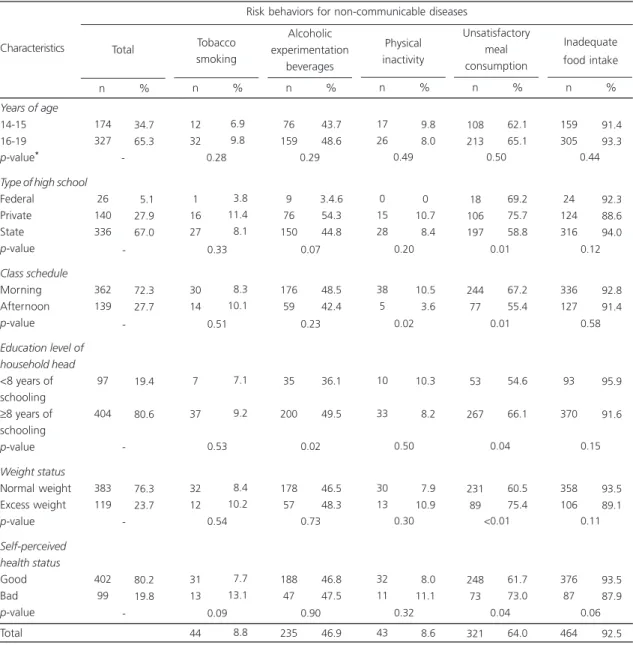
Table 1. Distribution of risk behaviors for non-communicable diseases and their association with variables of interest among male adolescents (n=501). Cuiabá (MT), Brazil, 2008.
Years of age
14-15 16-19
p-value*
Type of high school Federal Private State p-value Class schedule Morning Afternoon p-value Education level of household head <8 years of schooling ≥8 years of schooling p-value Weight status Normal weight Excess weight p-value Self-perceived health status Good Bad p-value Total 174 327 26 140 336 362 139 97 404 383 119 402 99 34.7 65.3 05.1 27.9 67.0 72.3 27.7 19.4 80.6 76.3 23.7 80.2 19.8 Characteristics n % -Total 12 32 1 16 27 30 14 7 37 32 12 31 13 44 6.9 9.8 03.8 11.4 08.1 08.3 10.1 07.1 09.2 08.4 10.2 07.7 13.1 08.8 n % 0.28 0.33 0.51 0.53 0.54 0.09 Tobacco smoking 76 159 9 76 150 176 59 35 200 178 57 188 47 235 43.7 48.6 3.4.6 54.3 44.8 48.5 42.4 36.1 49.5 46.5 48.3 46.8 47.5 46.9 n % 0.29 0.07 0.23 0.02 0.73 0.90 Alcoholic experimentation beverages 17 26 0 15 28 38 5 10 33 30 13 32 11 43 09.8 08.0 0 10.7 08.4 10.5 03.6 10.3 08.2 07.9 10.9 08.0 11.1 08.6 n % 0.49 0.20 0.02 0.50 0.30 0.32 Physical inactivity 108 213 18 106 197 244 77 53 267 231 89 248 73 321 62.1 65.1 69.2 75.7 58.8 67.2 55.4 54.6 66.1 60.5 75.4 61.7 73.0 64.0 n % 0.50 <0.01 <0.01 <0.04 <0.01 <0.04 Unsatisfactory meal consumption 159 305 24 124 316 336 127 93 370 358 106 376 87 464 91.4 93.3 92.3 88.6 94.0 92.8 91.4 95.9 91.6 93.5 89.1 93.5 87.9 92.5 n % 0.44 0.12 0.58 0.15 0.11 0.06 Inadequate food intake Risk behaviors for non-communicable diseases
higher prevalence of unsatisfactory meal consumption (78 versus 64%) and physical inactivity (32 versus 9%) (p<0.01 for all). Males and females had similar inadequate intake of saturated fat (males: 37 versus females: 41%,
p=0.09). The number of simultaneous exposure to risk behaviors differed significantly between sexes (p=0.01).
Male adolescents from private schools had a higher prevalence of unsatisfactory meal consumption. Students who attended morning classes had the highest prevalence of physical inactivity and unsatisfactory meal consumption. Adolescents from families in which the household head had ≥8 years of schooling had a higher prevalence of alcohol experimentation and
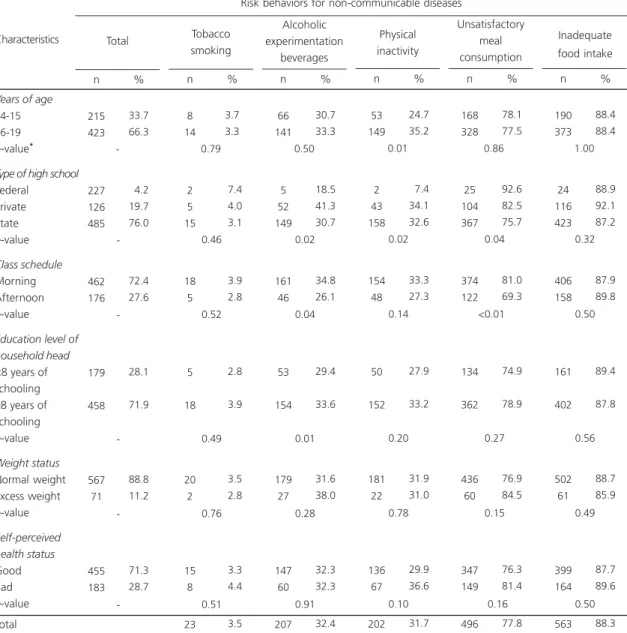
Table 2. Distribution of risk behaviors for non-communicable diseases and their association with variables of interest among female adolescents (n=638). Cuiabá (MT), Brazil, 2008.
Years of age
14-15 16-19
p-value*
Type of high school Federal Private State p-value Class schedule Morning Afternoon p-value Education level of household head <8 years of schooling ≥8 years of schooling p-value Weight status Normal weight Excess weight p-value Self-perceived health status Good Bad p-value Total 215 423 227 126 485 462 176 179 458 567 71 455 183 33.7 66.3 04.2 19.7 76.0 72.4 27.6 28.1 71.9 88.8 11.2 71.3 28.7 Characteristics n % -Total 8 14 2 5 15 18 5 5 18 20 2 15 8 23 3.7 3.3 07.4 04.0 03.1 03.9 02.8 02.8 03.9 03.5 02.8 03.3 04.4 03.5 n % 0.79 0.46 0.52 0.49 0.76 0.51 Tobacco smoking 66 141 5 52 149 161 46 53 154 179 27 147 60 207 30.7 33.3 18.5 41.3 30.7 34.8 26.1 29.4 33.6 31.6 38.0 32.3 32.3 32.4 n % 0.50 0.02 0.04 0.01 0.28 0.91 Alcoholic experimentation beverages 53 149 2 43 158 154 48 50 152 181 22 136 67 202 24.7 35.2 07.4 34.1 32.6 33.3 27.3 27.9 33.2 31.9 31.0 29.9 36.6 31.7 n % 0.01 0.02 0.14 0.20 0.78 0.10 Physical inactivity 168 328 25 104 367 374 122 134 362 436 60 347 149 496 78.1 77.5 92.6 82.5 75.7 81.0 69.3 74.9 78.9 76.9 84.5 76.3 81.4 77.8 n % <0.86 <0.04 <0.01 <0.27 <0.15 <<0.16 Unsatisfactory meal consumption 190 373 24 116 423 406 158 161 402 502 61 399 164 563 88.4 88.4 88.9 92.1 87.2 87.9 89.8 89.4 87.8 88.7 85.9 87.7 89.6 88.3 n % 1.00 0.32 0.50 0.56 0.49 0.50 Inadequate food intake Risk behaviors for non-communicable diseases
unsatisfactory meal consumption. Excess weight was more common among those with unsatisfactory meal consumption, and adolescents who reported a bad health status had a higher prevalence of unsatisfactory meal consumption (Table 1).
Female adolescents aged 16 to 19 years and those from private schools had a higher prevalence of physical inactivity. Attending morning classes, having a household head with
≥8 years of schooling, and attending private school were associated with experimentation of alcoholic beverages. The prevalence of unsatisfactory meal consumption was higher among students from the federal school and among those who attended morning classes (Table 2).
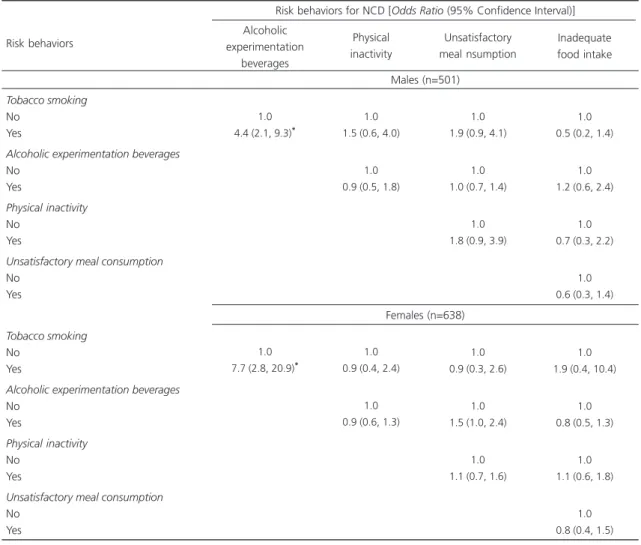
Tobacco smoking was associated with an increased likelihood of alcohol experimentation among males (Odds Ratio-OR=4.4; 95% Confidence Interval-95%CI=2.1; 9.3) and females (OR=7.7; 95%CI= 2.8; 20.9) (Table 3).
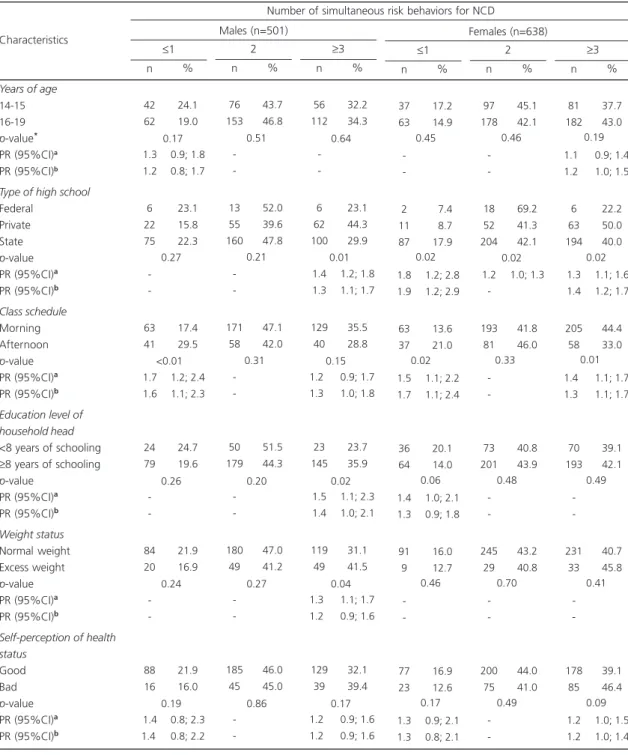
Concerning the simultaneous occurrence of the study risk behaviors, males from private schools had a greater prevalence of the concurrent occurrence of three or more risk behaviors. Students who attended morning classes had a smaller prevalence of the occurrence of ≤1 risk behavior. Adolescents whose household head had
≥8 years of formal education and those with excess weight had higher prevalences of the simultaneous occurrence of three or more risk behaviors. The prevalence of one or no risk
Table 3. Association among risk behaviors for Non-Communicable Diseases (NCD) in adolescents according to sex (n=1,139). Cuiabá (MT), Brazil, 2008.
Tobacco smoking No
Yes
Alcoholic experimentation beverages No
Yes
Physical inactivity No
Yes
Unsatisfactory meal consumption No
Yes
Tobacco smoking No
Yes
Alcoholic experimentation beverages No
Yes
Physical inactivity No
Yes
Unsatisfactory meal consumption No
Yes
Risk behaviors
1.0 4.4 (2.1, 9.3)*
1.0 7.7 (2.8, 20.9)*
Alcoholic experimentation
beverages
Males (n=501)
Risk behaviors for NCD [Odds Ratio (95% Confidence Interval)]
Females (n=638)
1.0 1.5 (0.6, 4.0)
1.0 0.9 (0.5, 1.8)
1.0 0.9 (0.4, 2.4)
1.0 0.9 (0.6, 1.3)
1.0 1.9 (0.9, 4.1)
1.0 1.0 (0.7, 1.4)
1.0 1.8 (0.9, 3.9)
1.0 0.9 (0.3, 2.6)
1.0 1.5 (1.0, 2.4)
1.0 1.1 (0.7, 1.6)
1.0 0.5 (0.2, 1.4)
1.0 1.2 (0.6, 2.4)
1.0 0.7 (0.3, 2.2)
1.0 0.6 (0.3, 1.4)
1.0 1.9 (0.4, 10.4)
1.0 0.8 (0.5, 1.3)
1.0 1.1 (0.6, 1.8)
1.0 0.8 (0.4, 1.5)
Physical inactivity
Unsatisfactory meal nsumption
Inadequate food intake
behaviors was highest among females from state schools and females who attended afternoon classes. The simultaneous occurrence of two risk behaviors was higher among students from the
federal school, and the occurrence of three or more risk behaviors was higher among students who attended morning classes (Table 4). According to Poisson regression models, the main
Table 4. Distribution and prevalence ratio of simultaneous occurrence of risk behaviors for Non-Communicable Diseases (NCD) according to the variables of interest. Adolescents from Cuiabá (MT), Brazil, 2008.
Years of age
14-15 16-19
p-value* PR (95%CI)a PR (95%CI)b Type of high school Federal
Private State p-value PR (95%CI)a PR (95%CI)b
Class schedule Morning Afternoon p-value PR (95%CI)a PR (95%CI)b
Education level of household head <8 years of schooling ≥8 years of schooling p-value
PR (95%CI)a PR (95%CI)b
Weight status Normal weight Excess weight p-value PR (95%CI)a PR (95%CI)b
Self-perception of health status
Good Bad p-value PR (95%CI)a PR (95%CI)b Characteristics 42 62 <1.30 <1.20 6 22 75 -63 41 <1.70 <1.60 24 79 < -84 20 < -88 16 <1.40 <1.4 0 n 24.1 19.0 0.9; 1.8 0.8; 1.7 23.1 15.8 22.3 17.4 29.5 1.2; 2.4 1.1; 2.3 24.7 19.6 21.9 16.9 21.9 16.0 0.8; 2.3 0.8; 2.2 % ≤1 76 153 -13 55 160 -171 58 -50 179 -180 49 -185 45 -n 43.7 46.8 52.0 39.6 47.8 47.1 42.0 51.5 44.3 47.0 41.2 46.0 45.0 % 2 56 112 -6 62 100 1.4 1.3 129 40 1.20 1.30 23 145 1.5 1.4 119 49 1.30 1.20 129 39 1.20 1.20 n 32.2 34.3 23.1 44.3 29.9 1.2; 1.8 1.1; 1.7 35.5 28.8 0.9; 1.7 1.0; 1.8 23.7 35.9 1.1; 2.3 1.0; 2.1 31.1 41.5 1.1; 1.7 0.9; 1.6 32.1 39.4 0.9; 1.6 0.9; 1.6 % ≥3 Males (n=501) 37 63 -2 11 87 1.8 1.9 63 37 1.5 1.7 36 64 1.4 1.3 91 9 -77 23 1.3 1.3 n 17.2 14.9 07.4 08.7 17.9 1.2; 2.8 1.2; 2.9 13.6 21.0 1.1; 2.2 1.1; 2.4 20.1 14.0 1.0; 2.1 0.9; 1.8 16.0 12.7 16.9 12.6 0.9; 2.1 0.8; 2.1 % ≤1 97 178 -18 52 204 1.2 -193 81 -73 201 -245 29 -200 75 -n 45.1 42.1 69.2 41.3 42.1 1.0; 1.3 41.8 46.0 40.8 43.9 43.2 40.8 44.0 41.0 % 2 81 182 1.10 1.20 6 63 194 < 1.3 1.4 205 58 1.40 1.30 70 193 -231 33 -178 85 1.2 1.2 n 37.7 43.0 0.9; 1.4 1.0; 1.5 22.2 50.0 40.0 1.1; 1.6 1.2; 1.7 44.4 33.0 1.1; 1.7 1.1; 1.7 39.1 42.1 40.7 45.8 39.1 46.4 1.0; 1.5 1.0; 1.4 % ≥3 Females (n=638)
Number of simultaneous risk behaviors for NCD
Note: *Chi-square test;aCrude Prevalence Ratio; bAdjusted Prevalence Ratio, each model was adjusted by independent variables that had p<0.20
in the univariate analysis.
PR: Prevalence Ratio; 95%CI: 95% Confidence Interval estimated by Poisson regression.
<0.17 <0.51 <0.64 <0.45 <0.46 <0.19
<0.27 <0.21 <0.01 <0.02 <0.02 <0.02
<<0.01 <0.31 <0.15 <0.02 <0.33 <0.01
<0.26 <0.20 <0.02 <0.06 <0.48 <0.49
<0.19 <0.86 <0.17 <0.17 <0.49 <0.09
factors associated with the simultaneous occurrence of risk behaviors in males and females were attending morning classes and private schools (Table 4).
D I S C U S S I O N
Sodium intake higher than that recommended by the WHO, unsatisfactory consumption of main meals, saturated fat intake above 10% of total energy consumption, and experimentation of alcoholic beverages in the previous six months were the most prevalent risk behaviors for NCD among adolescents in Cuiabá, Brazil. Attending private high schools and morning classes were associated with a higher prevalence and simultaneous occurrence of multiple risk behaviors.
The high prevalence of risk behaviors observed in the present study are concerning because early exposure to undesirable behaviors, including poor eating habits, physical inactivity, and tobacco use, are associated with the development of metabolic disorders, including high blood pressure, hypertriglyceridemia, low levels of high-density lipoprotein cholesterol, and high levels of low-density lipoprotein cholesterol5. These risk behaviors can predispose people to the development of major health problems and NCD, both in adolescence2,16 and in adulthood18.
There was a strong association between experimentation of alcoholic beverages and tobacco smoking among the adolescents from
Cuiabá. Similarly, a direct relationship between tobacco smoking and use of alcoholic beverages has been found in Brazilian6, Finnish11, and Belgian15 adolescents. Paavola et al.11 found that tobacco smoking and alcohol intake in adolescence are associated with these behaviors in adulthood, noting that these behaviors are also strongly correlated with each other. In that study the presence of these behaviors in 15- and 21-year-olds predicted their presence in 28-year-21-year-olds, showing the interdependence between these
behaviors and their maintenance throughout life. Furthermore, in adolescents tobacco smoking and alcohol consumption have often been associated with other risk behaviors, including illicit drug use, unprotected sexual intercourse, aggressive behaviors2,17, and conditions including depression and low self-esteem10,14.
The second most prevalent risk behavior among adolescents in Cuiabá was irregular consumption of meals, which has been associated with nutritionally poor diets8,12, insufficient nutrient intake8, increased risk of overweight, higher waist circumference, higher BMI, and higher levels of low-density lipoprotein cholesterol7,31. The present study emphasizes the importance of considering regular meal habits as an important component of a healthy lifestyle, as did two other studies that evaluated the irregular intake of meals as a risk behavior in adolescents10,13. Yorulmaz et al.10 found that adolescent tobacco smokers in Turkey showed a lower frequency of having breakfast than non-tobacco smokers. Similarly, Giannakopoulos et al.13 reported that adolescent tobacco smokers in Greece had lower intake frequency of daily breakfast, cereals, and dairy products and higher intake frequency of deep-fried foods, sodas, and beverages with added sugar than non-tobacco smokers.
Regarding the association between socioeconomic level, education level of the household head, and the occurrence of risk behaviors, adolescents from higher socioeconomic levels had a higher prevalence of experimentation of alcoholic beverages (i.e., household head with
≥8 years of schooling). In addition, male adolescents belonging to families with a higher socioeconomic status (i.e., household head with
≥8 years of schooling) were more likely to have unsatisfactory consumption of main meals and three or more risk behaviors simultaneously.
poverty and adverse environments associated with multiple unhealthy behaviors. Accordingly, the WHO32 states that greater disease burden (e.g., infectious diseases), more lesions, and higher mortality per liter of alcohol consumed occur among individuals with lower socioeconomic status. Other authors10,15,16 have also noted that risk behaviors are more prevalent in the least favored population segments. However, still other studies have noted different associations between socioeconomic categories and the aggregation of risk behaviors; these associations vary according to sex and/or age9,14. Thus, the impact of socioeconomic conditions on the occurrence of multiple risk behaviors in adolescence is a topic that deserves further examination to identify the most vulnerable groups that should be targeted by health promotion programs.
Regarding the evaluation of self-perceived health status and its relation to risk behaviors, individual perceptions and education may influence an individual’s life habits33. In the present study, although only bad self-perceived health status was associated with unsatisfactory consumption of main meals in male adolescents, this factor may denote some awareness of their lifestyle among the study adolescents. Conversely, the lack of association between self-perceived health status and other behaviors, especially among females, shows that there is still a gap to be filled between the transmission of information and concepts about healthy habits and the adoption of those behaviors. Other studies have also evaluated the association between self-perceived health status and behaviors related to lifestyle in Canadian34 and Hungarian35 adolescents. Tremblay et al.34 noted that the likelihood of adolescents showing a good self-perceived health status was significantly lower among those who smoked daily, consumed alcoholic beverages, practiced no physical activity in their leisure time, failed to consume fruits and vegetables daily, or were classified as obese, even after adjusting for confounding factors.
The study risk behaviors - physical inactivity, tobacco smoking, experimentation of alcoholic
beverages, and inadequate dietary habits - typify an unhealthy lifestyle, compromise quality of life, and predispose to the development of NCD4,18, and have been evaluated in various similar studies2,5-17. However, comparison between studies that have evaluated the simultaneous occurrence of risk behaviors is complicated by the diversity of behaviors analyzed by the studies.
Another limitation of the present study concerns the instrument used for estimating food consumption, the FFQ. This instrument has been widely used in epidemiological studies because it is inexpensive36 and not subject to the effect of intrapersonal variability, although self-reported food consumption may be affected by food preferences and availability of foods.
Finally, monitoring and planning early interventions for risk behaviors in adolescents, with the goal of minimizing their occurrence and reducing their short- and long-term effects, are necessary because adolescence is a critical period for the adoption of life habits16. It is a time when the adopted behaviors tend to persist throughout adult life11,37 and when health-protective behaviors are less frequent than risk behaviors4.
C O N C L U S I O N
A C K N O W L E D G E M E N T S
This study was sponsored by Fundação de Amparo à Pesquisa do Estado do Mato Grosso, which provided a doctorate scholarship, and by Coordenação de Aperfeiçoamento de Pessoal de Nível Superior, Brazilian Ministry of Education, which sponsored a “sandwich doctorate”.
C O N T R I B U T O R S
PRM RODRIGUES was responsible for study conception, data collection, statistical analyses, data interpretation, manuscript conception, and manuscript writing. CMP PADEZ contributed to data analysis and manuscript writing. MG FERREIRA and RMV GONÇALVES-SILVA were responsible for study conception, statistical analyses, manuscript conception, and final revision. RA PEREIRA contributed to study conception, statistical analyses, data interpretation, manuscript conception, manuscript writing, and final revision. All authors read and approved the final version.
R E F E R E N C E S
1. Schmidt MI, Duncan BB, Silva GA, Menezes AM, Monteiro CA, Barreto SM, et al. Chronic noncommunicable diseases in Brazil: Burden and current challenges. Lancet. 2011; 377(9781):1949-61. http://dx.doi.org/10.1016/S0140-6736(11)60 135-9 2. MacArthur GJ, Smith MC, Melotti R, Heron J,
Macleod J, Hickman M, et al. Patterns of alcohol use and multiple risk behaviour by gender during early and late adolescence: The ALSPAC cohort. J Public Health. 2012; 34(Suppl. 1):i20-30. http://dx. doi.org/10.1093/pubmed/fds006
3. Hurrelmann K, Richter M. Risk behaviour in adolescence: The relationship between developmental and health problems. J Public Health. 2006; 14(1):20-8. http://dx.doi.org/10.1007/s10389-005-0 005-5
4. Spring B, Moller AC, Coons MJ. Multiple health behaviours: Overview and implications. J Public Health. 2012; 34(Suppl. 1):i3-10. http://dx.doi.org/ 10.1093/pubmed/fdr111
5. Guedes DP, Guedes JE, Barbosa DS, Oliveira JA, Stanganelli LCR. Cardiovascular risk factors in adolescents: Biological and behavioral indicators. Arq Bras Cardiol. 2006; 86(6):439-50. http://dx. doi.org/10.1590/S0066-782X2006000600006
6. Farias Junior JC, Mendes JKF, Barbosa DBM. Inter-relationships between health risk behaviors in adolescents. Rev Bras Cineantropom Desempenho Hum. 2007; 9(3):250-6.
7. Estima CCP, Costa RS, Sichieri R, Pereira RA, Veiga GV. Meal consumption patterns and anthropometric measurements in adolescents from a low socioeconomic neighborhood in the metropolitan area of Rio de Janeiro, Brazil. Appetite. 2009; 52(3):735-9. http://dx.doi.org/10.1016/j.appet. 2009.03.017
8. Leal GVS, Philippi ST, Matsudo SMM, Toassa EC. Food intake and meal patterns of adolescents, São Paulo, Brazil. Rev Bras Epidemiol. 2010; 13(3):457-67. http://dx.doi.org/10.1590/S1415-790X20100 00300009
9. Malta DC, Sardinha LM, Mendes I, Barreto SM, Giatti L, Castro IR, et al. Prevalence of risk health behavior among adolescents: Results from the 2009 National Adolescent School-based Health Survey (PeNSE). Ciênc Saúde Colet. 2010; 15(Suppl. 2):3009-19. http://dx.doi.org/10.1590/S1413-81232010 000800002
10. Yorulmaz F, Akturk Z, Dagdeviren N, Dalkilic A. Smoking among adolescents: Relation to school success, socioeconomic status nutrition and self-esteem. Swiss Med Wkly. 2002; 132(31-32): 449-54.
11. Paavola M, Vartiainen E, Haukkala A. Smoking, alcohol use, and physical activity: A 13-year longitudinal study ranging from adolescence into adulthood. J Adolesc Health. 2004; 35(3):238-44. http://dx.doi.org/10.1016/j.jadohealth.2003. 12.004
12. Rampersaud GC, Pereira MA, Girard BL, Adams J, Metzl JD. Breakfast habits, nutritional status, body weight, and academic performance in children and adolescents. J Am Diet Assoc. 2005; 105(5):743-60. http://dx.doi.org/10.1016/j.jada.2005.02.007 13. Giannakopoulos G, Panagiotakos D, Mihas C,
Tountas Y. Adolescent smoking and health-related behaviours: Interrelations in a Greek school-based sample. Child Care Health Dev. 2009; 35(2):164-70. http://dx.doi.org/10.1111/j.1365-2214.2008.00 906.x
14. Mistry R, McCarthy WJ, Yancey AK, Lu Y, Patel M. Resilience and patterns of health risk behaviors in California adolescents. Prev Med. 2009; 48(3):291-7. http://dx.doi.org/10.1016/j.ypmed.2008
16. Ottevaere C, Huybrechts I, Benser J, De Bourdeaudhuij I, Cuenca-Garcia M, Dallongeville J, et al. Clustering patterns of physical activity, sedentary and dietary behavior among European adolescents: The HELENA study. BMC Public Health. 2011; 11:328. http://dx.doi.org/10.1186/1471-24 58-11-328
17. Sychareun V, Thomsen S, Faxelid E. Concurrent multiple health risk behaviors among adolescents in Luangnamtha province, Lao PDR. BMC Public Health. 2011; 11:36. http://dx.doi.org/10.1186/14 71-2458-11-36
18. Li L, Law C, Power C. Body mass index throughout the life-course and blood pressure in mid-adult life: A birth cohort study. J Hypertens. 2007; 25:1215-23. http://dx.doi.org/10.1097/HJH.0b013e3280f3c01a 19. Instituto Brasileiro de Geografia e Estatísticas. Pes-quisa Nacional de Saúde do Escolar - PeNSE 2012. Rio de Janeiro: IBGE; 2013.
20. Currie C, Roberts C, Morgan A, Smith R, Settertobulte W, Samdal O, et al. Young people’s health in context. Health Behaviour in Schoolaged Children (HBSC) study: International report from the 2001/2002 survey. Copenhagen: WHO; 2004. 21. Ministério da Saúde. Secretaria de Atenção à Saúde. Guia alimentar para a população brasileira: promovendo a alimentação saudável. Série A. Normas e Manuais Técnicos. Brasília: Ministério da Saúde; 2006.
22. Silva NF, Sichieri R, Pereira RA, Silva RMVG, Ferreira MG. Reproducibility, relative validity and calibration factors of a food frequency questionnaire designed for adults. Cad Saúde Pública. 2013; 29(9):1783-94. http://dx.doi.org/10.1590/0102-311X00120312 23. Rodrigues PRM, Pereira RA, Cunha DB, Sichieri R,
Ferreira MG, Vilela AAF, et al. Factors associated with dietary patterns in adolescents: A school-based study in Cuiabá, Mato Grosso. Rev Bras Epidemiol. 2012; 15(3):662-74. http://dx.doi.org/10.1590/S1 415-790X2012000300019
24. Anção MS, Cuppari L, Tudisco ES, Draibe AS, Sigulem DM. Sistema de Apoio à Nutrição - NutWin. Versão 2.5. São Paulo: Unifesp; 2002.
25. Núcleo de Estudos e Pesquisas em Alimentação. Tabela de Composição de Alimentos - TACO. 4ª ed. Campinas: Unicamp; 2011.
26. Nutrition Coordinating Center. Nutrition Data System for Research (NDS-R). Minnesota: University of Minnesota; 2008.
27. World Health Organization. Global strategy on diet, physical activity and health. Geneva: WHO; 2004. 28. Fernandes RA, Casonatto J, Christofaro DGD, Cucato GG, Oliveira AR, Freitas-Júnior IF. Family factors associated with abdominal obesity in adolescents. Rev Bras Saúde Matern Infant. 2009; 9(4):451-7. http://dx.doi.org/10.1590/S1519-38 292009000400010
29. Onis M, Onyango AW, Borghi E, Siyam A, Nishida C, Siekmann J. Development of a WHO growth reference for school-aged children and adolescents. Bull World Health Organ. 2007; 85(9):660-7. http:// dx.doi.org/10.1590/S0042-96862007000900010 30. Rodrigues PRM, Gonçalves-Silva RMV, Pereira RA. Validity of self-reported weight and stature in adolescents from Cuiabá, Central-Western Brazil. Rev Nutr. 2013; 26(3):283-90. http://dx.doi.org/ 10.1590/S1415-52732013000300003
31. Smith KJ, Gall SL, McNaughton SA, Blizzard L, Dwyer T, Venn AJ. Skipping breakfast: Longitudinal associations with cardiometabolic risk factors in the Childhood Determinants of Adult Health Study. Am J Clin Nutr. 2010; 92(6):1316-25. http://dx.doi.org/ 10.3945/ajcn.2010.30101
32. World Health Organization. Global status report on alcohol and health. Geneva: WHO; 2011. 33. Parmenter K, Wardle J. Evaluation and design of
nutrition knowledge measures. J Nutr Educ. 2000; 32(5):270-7. http://dx.doi.org/10.1016/S0022-31 82(00)70575-9
34. Tremblay S, Dahinten S, Kohen D. Factors related to adolescents’ self-perceived health. Health Rep. 2003; 14:7-16.
35. Piko BF. Self-perceived health among adolescents: The role of gender and psychosocial factors. Eur J Pediatr. 2007; 166(7):701-8. http://dx.doi.org/10. 1007/s00431-006-0311-0
36. Slater B, Philippi ST, Marchioni DML, Fisberg RM. Validation of food frequency questionnaires - FFQ: Methodological considerations. Rev Bras Epidemiol. 2003; 6(3):200-8. http://dx.doi.org/10.1590/S14 15-790X2003000300003
37. Craigie AM, Lake AA, Kelly SA, Adamson AJ, Mathers JC. Tracking of obesity-related behaviours from childhood to adulthood: A systematic review. Maturitas. 2011; 70(3):266-84. http://dx.doi.org/ 10.1016/j.maturitas.2011.08.005