FF
Abstract— Vortices can be produced and ingested into the
intake of a jet engine during high power operation in the vicinity of solid surfaces causing Foreign Object Damage (FOD) or compressor stall and engine surge problems. This can occur when the engine is mounted on the wing of a plane during take-off and engine ground runs or when the engine is placed inside a test cell for testing after an engine overhaul and prior to reinstallation onto the aircraft.
In order to prevent such vortices from forming, especially in the test cells, it is necessary to be able to predict the onset of the vortex or understand the factors affecting the formation of such vortices.
Ho and Jermy [TD1DT] investigated vortex formation using a suction tube in a open-end box model simulating an engine in a test cell scenario and found that 3 distinct regimes of flow (regular vortex, deformed vortex and no vortex) exists as the ratio of suction inlet velocity to upstream average velocity (Vi/Vo) varies.
The effect of the upstream velocity gradient and suction inlet diameter on the threshold is considered.
The results show that the as the size of the suction inlet diameter is increased, the range of conditions over which a vortex forms also increases. This is in line with earlier findings [TD2DT] in the take-off and engine run scenarios. The threshold for all three regimes appears to shift to a lower Vi/Vo for a given ratio of height over inlet diameter (H/Di). This indicates that in order to accommodate a larger engine, it is necessary to increase the size of the test cell by more than the ratio of engine diameters if the same margin of safety (with respect to vortex formation) are to be maintained.
Index Terms—TTTCFD, Fluent, Vortex. Jet Engine Test Cells.T
I. INTRODUCTION
Vortices can developed in the intakes of aero engines during high power operation near solid surfaces. This may occur during take-off or during test in a ground facility,
X
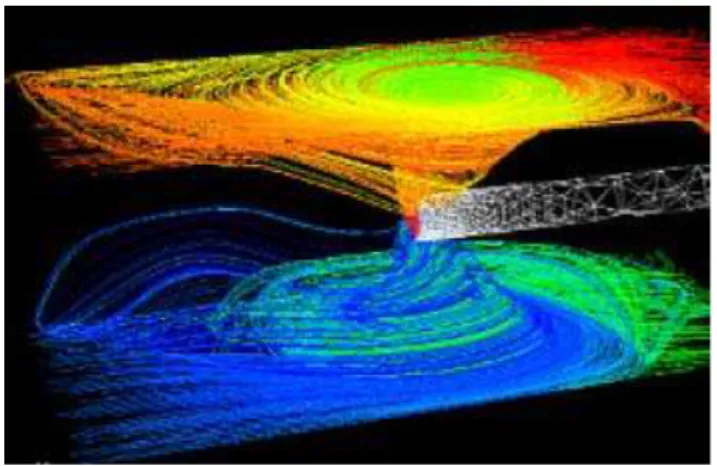
Figure 1X. A vortex visualised by pathlines in a CFD simulation is shown in XFigure 2X.
W.H. Ho is with the Department of Mechanical Engineering, University of Canterbury, Christchurch, New Zealand (phone: 643-364-2987 x7866; fax: 643-364-2078; e-mail: whh19@ student.canterbury.ac.nz).
H. Dumbleton, was with the Department of Mechanical Engineering, University of Canterbury, Christchurch, New Zealand. He has now graduated.
M.C. Jermy is with the Department of Mechanical Engineering, University of Canterbury, Christchurch, New Zealand (e-mail: [email protected]).
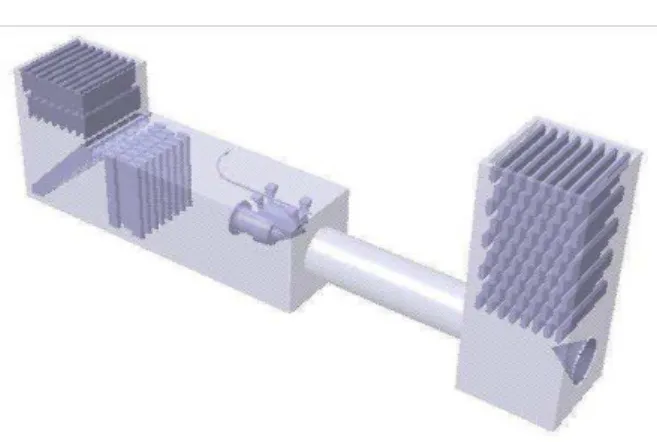
Figure 1: A U-Shaped Test Cell
Figure 2: Vortex being ingested into an engine
The structure of the vortex is similar to the vortex seen in a bath plughole. One end of the vortex is anchored on a nearby surface while the other enters the suction intake.
In a test cell, vortices if present are seen to be anchored to the ceiling of the cell. Ho and Jermy [X1X] showed that a low velocity region present near one of the horizontal surfaces would force the vortex to attach to that surface. This low velocity region is likely to be present near the ceiling of the main test chamber in a U-shaped test cell and is seen in CFD simulation of U-shaped cells.
In a test cell, the total airflow is greater than that passing through the engine, driven by entrainment by the exhaust jet plume. This flow passes between the engine and the internal walls of the cell, and cools the engine. It is quantified by a cell bypass ratio (CBR):
⎟
⎟
⎠
⎞
⎜
⎜
⎝
⎛
−
=
engine engine cell
m
m
m
CBR
&
&
&
%
100
Formation of Sink Vortices in a Jet Engine Test
Cell
The CBR is distinct from the engine bypass ratio, which is the ratio of the fan to core flow rate. A commonly used rule of thumb is that a cell must have a bypass ratio of more than 80% to avoid vortex formation. Typically cells are designed with CBRs up to 200%.
CFD simulations [TD3DT,TD4,DTTD5DT,TD6DT] and experimental data from wind-tunnel studies [TD7DT,TD8DT,TD9DT,TD10DT,TD11DT,TD12DT,TD13DT] of intake vortices in the runway scenario have been reported and Ho and Jermy [X1X] have used CFD simulations to show the different flow regimes present in a test cell like scenario. Extending this work, Ho et al. [TD14DT] showed that upstream velocity gradient in the test cell, increased the range of conditions over which a vortex is formed. These results agree with CFD [X10X] and experimental [X2X] results in models of an engine over a single ground plane.
This paper seeks to further our understanding of the vortex formation phenomenon by investigating the effects of changing the size of the engine in a test cell. Firstly the vortex formation phenomenon, the type of vortex that is of interest and the conditions that are known to favour the formation of a vortex are discussed in detail. Following this, results from earlier work regarding the effects of ambient velocity gradient is presented and discussed in detail. A possible source of ambient velocity gradient is then presented with results from CFD simulation of a test cell. Finally the methodology is described before the results and conclusions are presented.
II. VORTEX FORMATION
The vortex type concerned in the study is the sink vortex, which concentrates ambient vorticity leading to a vortex with a single core. This study excludes vortices which do not require ambient vorticity and which lead to two or more counter rotating vortex cores such as those described by de Siervi et al. [TD15DT]. Kline [TD16DT] stated three conditions for the formation of such a vortex: non-zero ambient vorticity, presence of a stagnation point on the solid surface and an updraught from just above the stagnation point to the suction inlet. These conditions are necessary but not sufficient.
In the formation of such vortices, there exists a blow-away velocity above which the vortex core is convected downstream and disconnected from the inlet. Conversely if the upstream air velocity is below the blow-away velocity, a vortex may be formed subject to other favourable conditions.
Similar to previous studies, the blow away condition is expressed as the ratio of the inlet velocity Vi to the upstream velocity Vo. There is a minimum value of this ratio Vi/Vo below which the vortex will not form.
On the other hand, if the inlet is too far away from a solid surface, there will be no stagnation point [X16X] (a point with a diverging velocity profile radially) on the surface and the vortex cannot form. In other words, the capture stream-tube (enclosing the air which enters the inlet) does not intersect with any solid surface. This condition is expressed as the ratio of the perpendicular distance from the inlet to the solid surface H to the inlet internal diameter Di. There is a maximum value of this ratio H/Di above which the vortex will not form.
The threshold values of these two ratios are interdependent and can be expressed as lines differentiating the different regions on a Vi/Vo against H/Di graph indicating the different flow regimes. Ridder and Samuelsson [13] found
that the vortex system has a memory i.e. the threshold shifts slightly between an experiment in which Vi is raised and another in which Vi is lowered.
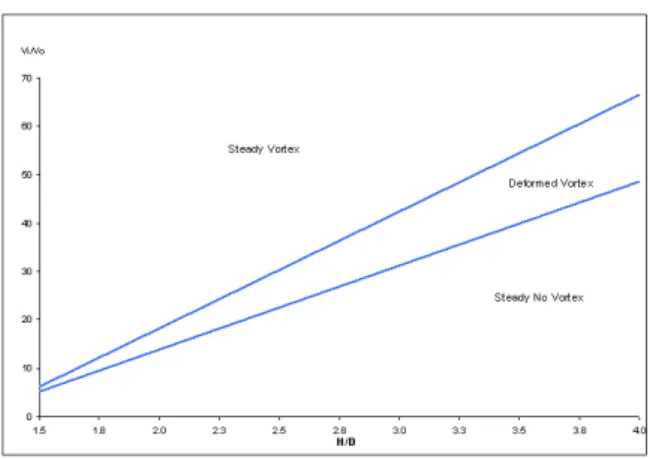
On the runway, where the only solid surface present near the engine is the ground, the available data suggest that there exist only 2 flow regimes. These are vortex and no vortex (XFigure 3X). However when the engine is run inside a test cell, where sidewalls and ceiling are present in addition to the ground, a third flow regime exists. The vortex and no vortex regimes in the runway scenario are still present and named steady vortex and steady no vortex regimes respectively in the test cell scenario (XFigure 4X). Unsteady and unstable vortices have been observed in real test cells where the vortex cone precesses and the vortex disappears and reforms aperiodically. Glenny [X10X] put forward the hypothesis that this unsteady nature could be due to unsteadiness in the surrounding fluid. However no investigations have been performed to confirm this.
Figure 3: Different flow regimes in a runway like model
Figure 4: Different flow regimes present in a test cell like model
In the runway scenario, where only one solid surface is present, the vortex when present will be anchored to that surface. However in a test cell scenario, where the ceiling is of equidistant from engine as the floor is, a low velocity region near either surface is necessary to ‘force’ the vortex to be preferentially anchored to that surface. In actual J or U-Shaped cells, which have a vertical inlet and horizontal test chamber, this region is found near the ceiling and any vortex observed in such test cells will be anchored to the ceiling. Two single core vortices from both ceiling and floor have been shown to exist simultaneously if such a low velocity region is absent [X1X] as shown in XFigure 5X.
Figure 5: Two single core vortices formed as a result of the absence of a low velocity region
III. EFFECTS OF UPSTREAM VELOCITY GRADIENT ON
VORTEX FORMATION
A positive correlation was observed between upstream velocity gradient (Motycka et al [TD17DT] terms this ambient shear) and the probability of vortex formation, in both the runway and test cell scenarios. This is expected because the sink vortex concentrates ambient vorticity and upstream velocity gradient is a source of vorticity.
Glenny [X10X] investigated the runway scenario using scaled model tests and found that a change in upstream velocity gradient (equivalent to a change in Rossby number to use Glenny’s terminology) causes a small change in the threshold line. As the gradient increases, the threshold moves to a smaller value of Vi/Vo. Glenny’s results are reproduced in
X
Table 1X.
Table 1
Vi/Vo H/Di Ro
6.84 1.1 8.0 8.33 1.1 18.0 9.09 1.1 25.0 10.4 1.3 12.0 11.6 1.3 17.0 12.2 1.3 25.0 13.2 1.5 25.0
Ho and Jermy [X2X,X14X] investigated both runway and test cell scenarios are investigated using CFD models. The results are shown in XFigure 6X and XFigure 7X. The threshold lines shown are linear least-squares fits and do not necessarily represent the actual value.
Figure 6: Effects of upstream velocity gradient on vortex formation threshold (runway scenario)
Figure 7: Effects of upstream velocity gradient on vortex formation threshold (test cell scenario)
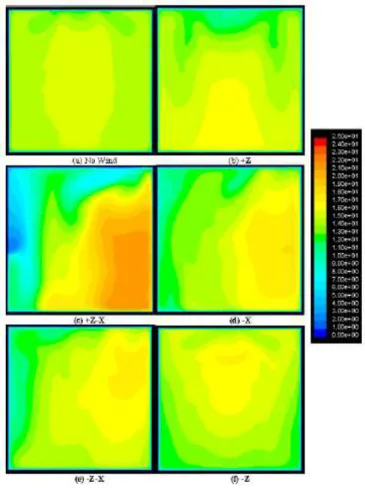
A. Crosswind as a Source of Upstream Velocity Gradient Ho et al [X14X] investigated cross-wind blowing across the intake stack of U-shaped test cells, using CFD simulations, and found that it has significant effects on upstream velocity gradient. The CFD mesh is shown in XFigure 8X. 6 scenarios including five wind directions and one no wind condition were considered and contour plots of velocity at a plane in the XY direction is presented in XFigure 9X.
Figure 9: XY Plane Velocity Contour Plots
An upstream velocity gradient in the direction perpendicular to the suction tube can be generated when some component of wind is blowing in the same direction (i.e. wind with a +X component will generate a velocity gradient in the +X direction and vice versa).
Cross-wind may be the origin of the required vorticity to form a vortex but it is unlikely to be the sole source as vortices have been observed in still conditions.
IV. EFFECT OF SUCTION INLET DIAMETER AND REYNOLDS
NUMBER ON VORTEX FORMATION THRESHOLD
Jermy and Ho [X2X] investigated the effect of suction inlet diameter and Reynolds number on the threshold on the runway model and found the following:
1. Increase in suction inlet diameter shifted threshold downwards.
2. Increase in Reynolds number shifted the threshold upwards.
V. METHOD
Three-dimensional CFD simulations of a cylindrical inlet of negligible thickness inside an open-ended cuboid (XFigure 10X) were performed and the results collected. The diameter of the suction inlet used in the simulations was 1m, 1.5m and 2m respectively for a fixed H/Di of 2.0.
Figure 10: Typical Mesh for Test Cell Model
The geometry was meshed and solved with CFD package Gambit and FLUENT respectively. The geometry was meshed with tetrahedral/hybrid meshes (hexahedral mesh would have been preferred but it proved difficult to achieve a satisfactory mesh with the tools available). The flow region is split into two regions of differing mesh densities to reduce mesh size and computational resources in regions far away from the suction inlet. The region closer to the suction inlet has a tighter mesh to maintain solution integrity where the vortex forms. The eventual mesh has between 100 000 to 200 000 cells for the 1m diameter model and increases for the larger models.
The boundary conditions for the model are as follows: • Cell Inlet – Velocity Inlet UDF defining a linear
velocity profile of 0.2/s and average upstream velocity of 10 m/s
• Engine Inlet – Outflow with flow rate rating of 1 • Cell Outlet – Outflow with flow rate rating set to
achieve the desired cell bypass ratio
• Cell and Engine Walls – No-slip walls (zero velocity on the surface)
A low velocity region is modeled close to the floor of the cell instead of the ceiling, as it is in some cells. This does not have any implication on the solution because the cylindrical inlet is situated equidistant between the walls, ground and ceiling. Gravity has a negligible effect on the flow.
Standard wall functions were used in the simulations. The flow was treated as incompressible as accordance with Ho and Jermy [X1X]
Turbulence was modeled with the SST k-ω scheme. This scheme was chosen as combining the best features of the k-ε scheme in free flow and the standard k-ω scheme in near wall flows yet avoiding the computational expanse of the Reynolds stress models (RSM). Both SST k-ω and RSM models were applied in [X2X] with little effect on the vortex formation threshold.
A mesh convergence test was conducted and the eventual mesh used had a mesh size as follows:
• Ground (green zone) – 0.1m to 0.2m Quad • Ground (rest of cell) – 0.25m to 0.35m Tri
• Engine inlet – 0.1m Quad
• Cell (green region) – 0.35m to 0.5m Tetrahedral • Cell (rest of cell) – 0.8m to 1m Tetrahedral
The models were initialised at the cell inlet plane prior to solving at each cell-bypass ratio.
VI. RESULTS AND DISCUSSIONS
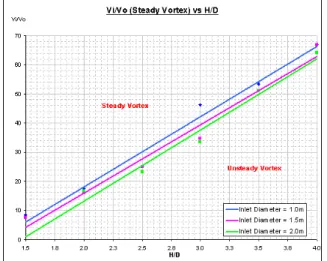
Results from the simulations are shown in XFigure 11X for threshold between the steady vortex and unsteady vortex region and XFigure 12X for threshold between the unsteady vortex and no vortex region. These two thresholds are combined in XFigure 13X for easy comparison. The data points are removed from XFigure 13X to prevent cluttering of the graph but are presented in XFigure 11X and XFigure 12X. The threshold lines are linear least squares fitted.
Figure 11: Steady vortex threshold for different engine inlet diameter
Figure 12: No vortex threshold for different engine inlet diameter
Figure 13: Vortex formation threshold (combined)
The results indicate a positive relationship between engine diameter and probability of vortex formation at the same H/D ratio. This is consistent with previous findings of Jermy and Ho [X2X] for the runway scenario. All three regions show evidence of shifting to a lower Vi/Vo indicating an increase in the conditions leading to a vortex being formed. The range of Reynolds numbers for the study ranges from 6.5 x 10P
5
P
to 1.3 x 10P
5
P
.
In addition to the lowering of the threshold the following properties are also observed to be consistent with previous work:
1. Vortices form when upstream velocity is low compared to the engine inlet velocity i.e. when Vi/Vo is high.
2. As the height of the engine is increased i.e. an increase in H/D, the blow-away velocity is decreases i.e. the required Vi/Vo increases.
3. The presence of 3 regions of flow with regards to vortex formation.
Trends 1 and 2 agree with previous observations on experimental data by various authors (Nakayama and Jones [X7X], Liu et al [X8X] and Shin et al [X9X] and numerical data by Jermy and Ho [X2X]).
The results indicate that the current trend of increasing jet engine size must be met with a more than linear scaling up of the test cell dimensions if the same conditions (with respect to vortex being formed and ingested) are desired.
VII. CONCLUSIONS
CFD models of a suction inlet in an open cuboid has been use for investigating the effects that increasing the engine diameter whilst keeping H/D constant has on vortex formation.
In agreement with previous studies, three cases of vortex formation were observed as Vi/Vo was lowered for each H/D and each threshold has a positive gradient on the plots of Vi/Vo versus H/D.
increased by a certain factor, the dimensions of the cell must increase more than the factor is the same conditions (with respect to vortex being formed and ingested) are desired.
The authors suggests the use of scaled model test to further verify the findings presented in this paper as well as investigation of other factors which might influence the threshold of vortex formation such as the size of the low velocity region and ambient turbulent intensity as possible areas of future work on the topic.
VIII. ACKNOWLEDGEMENTS
The authors wish to express thanks to CENCO Inc., SAFRAN Group for their financial support and technical discussions.
REFERENCES
[T1T] W. H. Ho., M. Jermy, “Validated CFD simulations of
vortex formation in jet engine test cells”,16th Australasian Fluid Mechanics Conference Proceedings pp 1102 – 1107 (2007)
[T2T] M. Jermy, W. H. Ho, “Location of vortex formation
threshold at suction inlets near ground planes by CFD simulation”, Proc. IMechE Part G J.Aero.Eng., Vol 222 Number 3/2008, pp 393 – 402 (2008)
[T3T] A. Karlsson and L. Fuchs, “Time evolution of the vortex
between an air inlet and the ground”, AIAA paper 2000-0990 (2000)
[T4T] A. Secareanu, D. Morioanu, A. Karlsson and L. Fuchs,
“Experimental and numerical study of ground vortex interaction in an air-intake”, AIAA paper 2005-1206 (2005)
[T5T] A. Gullia, P. Laskaridis, K. W. Ramsden, and P. Pilidis, “A
preliminary investigation of thrust measurement correction in an enclosed engine test facility”, AIAA paper 2005-1128 (2005)
[T6T] C. A. Kodres and G. L. Murphy, “Jet-engine test cell
augmenter performance”, J. Propuls. Power 1998 14(2) pp 129 – 134 (1998)
[T7T] A. Nakayama and J. R. Jones, “Vortex formation in inlet
flow near a wall”, 34P
th
P
Aerospace Sciences Meeting and Exhibit, AIAA 96-0803 (1996)
[T8T] W. Liu, E. M. Greitzer and C. S. Tan, “Surface static
pressure in an inlet vortex flow field”, ASME J. Engineering Gas Turbines Power 1985 107 pp 387 – 393 (1985)
[T9T] H. W. Shin, W. K. Cheng, E. M. Greitzer, C. S. Tan and C.
L. Shippee, “Circulation measurements and vertical structure in an inlet-vortex flow field”, J. Fluid Mech. 1986 162 pp 463 – 487 (1986)
[T10T] D. E. Glenny, “Ingestion of debris into intakes by vortex
action”, Aeronautical Research Council CP No 1114 (1970)
[T11T] D. L. Motycka et al, “Pratt and Whitney Aircraft TDM
2414 (1975)
[T12T] W. C. Ruehr, “General electric technical information series
report”, R75AEG384 (1975)
[T13T] S. O. Riddler and L. Samuelsson, “And experimental study
of strength and existence domain of ground-to-air inlet
vortices by ground board static pressure measurements”, Stockholm Royal Institute of Technology, KTH AERO TN 62 (1982)
[T14T] W. H. Ho, H. Dumbleton and M. Jermy, “Effect of
upstream velocity gradient on the formation of sink vortices in a jet engine test cell”, International Multi-Conference of Engineers and Computer Scientist 2008, pp 1767 - 1772 (2008)
[T15T] F. De Siervi, H. C. Viguier, E. M. Greitzer, and C. S. Tan,
“Mechanisms of inlet vortex formation”, J. Fluid Mech., 1982 124 pp 173 – 207 (1982)
[T16T] H. Kline, “Small scale tests on jet engine pebble aspiration
tests”, Douglas Aircraft Company, Report SM-14885 (1953)
[T17T] D. L. Motycka, W. A. Walter, and G. L. Muller, “An
analytical and experimental study of inlet ground vortices”, AIAA paper 73-1313 (1973)