Near Equilibrium Calculus of Stem Cells in
Application to the Airway Epithelium Lineage
Zheng Sun1, Maksim V. Plikus2, Natalia L. Komarova1,3*
1Department of Mathematics, University of California, Irvine, Irvine, California, United States of America, 2Department of Developmental and Cell Biology, Sue and Bill Gross Stem Cell Research Center and Center for Complex Biological Systems, University of California, Irvine, Irvine, California, United States of America, 3Department of Ecology and Evolutionary Biology, University of California, Irvine, Irvine, California, United States of America
Abstract
Homeostatic maintenance of tissues is orchestrated by well tuned networks of cellular sig-naling. Such networks regulate, in a stochastic manner, fates of all cells within the respec-tive lineages. Processes such as symmetric and asymmetric divisions, differentiation, de-differentiation, and death have to be controlled in a dynamic fashion, such that the cell popu-lation is maintained at a stable equilibrium, has a sufficiently low level of stochastic variation, and is capable of responding efficiently to external damage. Cellular lineages in real tissues may consist of a number of different cell types, connected by hierarchical relationships, albeit not necessarily linear, and engaged in a number of different processes. Here we develop a general mathematical methodology for near equilibrium studies of arbitrarily com-plex hierarchical cell populations, under regulation by a control network. This methodology allows us to (1) determine stability properties of the network, (2) calculate the stochastic var-iance, and (3) predict how different control mechanisms affect stability and robustness of the system. We demonstrate the versatility of this tool by using the example of the airway epithelium lineage. Recent research shows that airway epithelium stem cells divide mostly asymmetrically, while the so-called secretory cells divide predominantly symmetrically. It further provides quantitative data on the recovery dynamics of the airway epithelium, which can include secretory cell de-differentiation. Using our new methodology, we demonstrate that while a number of regulatory networks can be compatible with the observed recovery behavior, the observed division patterns of cells are the most optimal from the viewpoint of homeostatic lineage stability and minimizing the variation of the cell population size. This not only explains the observed yet poorly understood features of airway tissue architecture, but also helps to deduce the information on the still largely hypothetical regulatory mecha-nisms governing tissue turnover, and lends insight into how different control loops influence the stability and variance properties of cell populations.
a11111
OPEN ACCESS
Citation:Sun Z, Plikus MV, Komarova NL (2016) Near Equilibrium Calculus of Stem Cells in Application to the Airway Epithelium Lineage. PLoS Comput Biol 12(7): e1004990. doi:10.1371/journal. pcbi.1004990
Editor:Jorge M. Pacheco, Complexo Interdisciplinar da Universidade de Lisboa, PORTUGAL
Received:November 24, 2015
Accepted:May 18, 2016
Published:July 18, 2016
Copyright:© 2016 Sun et al. This is an open access article distributed under the terms of theCreative Commons Attribution License, which permits unrestricted use, distribution, and reproduction in any medium, provided the original author and source are credited.
Data Availability Statement:All relevant data are within the paper and its Supporting Information files.
Author Summary
Tissue stability is the basic property of healthy organs, and yet the mechanisms governing the stable, long-term maintenance of cell numbers in tissues are poorly understood. While more and more signaling pathways are being discovered, for the most part it remains unknown how they are being put together by different cell types into complex, nonlinear, hierarchical control networks that, on the one hand, reliably maintain constant cell num-bers, and on the other hand, quickly adjust to oversee the robust response to tissue dam-age. Theoretical approaches can fill the gap by being able to reconstruct the underlying control network, based on the observations about the aspects of cellular dynamics. We argue that while many hypothetical networks may be capable of basic cell lineage mainte-nance, some are much more efficient from the viewpoint of variance minimization. Thus, we developed a new methodology that can test various control networks for stability, vari-ance, and robustness. In the example of the airway epithelium that we highlight, it turns out that the evolutionary selected, actual architecture coincides with the mathematically optimal solution that minimizes the fluctuations of cell numbers at homeostasis.
Introduction
All tissues and organs in our bodies can be deconstructed and arranged into phylogenetic cellu-lar lineages. At the base of every lineage lie stem cells (SCs), the long lasting, self-renewing and generally non-differentiated cell type. Progeny of SCs progressively reduce their proliferative potential and concomitantly acquire specialized differentiated characteristics and novel func-tions. Typically, fully differentiated cells are post-mitotic and have limited life span, and thus require to be constantly replenished from the SC compartment. Proper steady-state mainte-nance of the lineages, as well as their rapid responses to cellular loss or excessive expansion require checks and balances at all steps of lineage progression, from stem to terminally differ-entiated cells. Significant advances in our understanding of the SC biology, as well as high potential for SC modulation as a therapeutic solution to a broad range of regenerative disor-ders, from non-healing wounds to rapid tumor growth [1–4], have inspired a lot of theoretical work in the field of lineage regulation.
The focus of the present study is understanding control networks involved in the homeosta-sis of healthy tissues. For a given, two- or multi-compartment lineage system, the control of cellular decisions, such as division and death timing, or division type, can be mediated by feed-back loops that depend on the current state of cellular population(s), more precisely, on the rel-ative numbers of distinct cell types within the lineage. For example, the decision for a SC to proliferate can depend on whether there is a deficiency either in the SC compartment, or in other downstream compartment(s). Similarly, the decision for a non-SC progenitor to termi-nally differentiate could depend on the current number of other termitermi-nally differentiated cells. In addition to proliferation and differentiation, other cellular events include asymmetric cell divisions, de-differentiation, and apoptosis. Cell numbers change as the result of divisions and deaths. How can the cell lineage system as a whole be regulated to remain at a near-equilib-rium? Several cell populations can participate in signaling, and control loops can be both posi-tive and negaposi-tive, to regulate, in a self-correcting way, the rate at which all of these processes take place. Given a complex system of this kind, we need to be able to evaluate whether the con-trol network is capable of producing stable homeostasis, quantify the magnitude of variances resulting from perturbations, and assess the robustness of the stochastic lineage turnover.
In [5] we considered stochastic dynamics of cellular lineages in a two-compartment model, which included SCs and one type of differentiated cells. We assumed that in such prototypical lineage only three cellular events took place: (i) death of a differentiated cell, (ii) proliferation or, alternatively, (iii) differentiation of a SC. While valuable, this approach has limitations because it only allows two cell types and three processes in the system. More recently, we showed that such two-compartment model can be sufficient to faithfully describe and predict cellular behaviors in relatively simple lineages, such as mammalian epidermis [6]. Considering the value of this methodology, it is important to generalize it and make it applicable for study-ing a larger class of more complex cellular lineages.
Examples of complex lineages are numerous. Commonly, there are multiple intermediate proliferating cell types, sometimes referred to as transit amplifying cells, between SCs and ter-minally differentiated post-mitotic cells. Such intermediate progenitors are prominent in the hematopoietic [7,8], intestinal epithelium [9,10] and hair follicle epithelium lineages [11–16]. For example, in the hematopoietic lineage, bona fide hematopoietic SCs give rise to common lymphoid and common myeloid progenitors. The latter, in turn, produce granulocyte-macro-phage and megakaryocyte–erythroid progenitors [7,8]. Moreover, lineages often contain more than one type of SCs and more then one distinct type of differentiated cells. For example, there are two principal types of epithelial SCs in the intestinal epithelium, rapidly proliferating crypt base columnar SCs and quiescent +4 SCs [9,10,17]. There are also seven distinct differentiated cell types that these SCs can produce: absorptive enterocytes, enteroendocrine cells, Tuft cells, Goblet cells, Paneth cells, M-cells and cup cells [9,18]. In lineages with more than one SC type, there is often SC-to-SC interchangeability. For instance, crypt base columnar SCs and quies-cent +4 SCs in the intestine can interconvert, depending on the conditions—crypt base colum-nar SCs are sensitive to damage, become largely depleted after irradiation and then restore from radiation-resistant +4 SCs [19–21]. In addition, following depletion, cells can be replen-ished from the non-SC progenitors via the so called de-differentiation or reprogramming mechanisms. Such is biliary epithelial cells regeneration via hepatocytes reprogramming in the liver following toxin-induced depletion [22,23]. In the lung, alveolar type-2 cells can repro-gram into type-1 cells when the latter are selectively ablated by the hyperoxic injury [24]. Simi-larly, in the stomach, differentiated secretory Troy+ chief cells can de-differentiate into SCs following genetic depletion of the SC compartment [25]. Ideally, a mathematical framework is needed that is not restricted by a small number of cell types, and can handle this biological variety.
hypothesize what type of a network would be compatible with the given observables and at the same time optimal from the viewpoint of robust homeostatic maintenance. Finally, given a reg-ulatory network, one can evaluate the importance of its different components and the influence they exert on the amount of variance experienced by the cell population.
To illustrate the versatility of the method, we apply it to the studies of the airway epithelium system. This system has recently attracted a lot of attention because (1) its key cell types, including stem cells, are well defined, (2) it has tractable two-dimensional organization, and (3) multiple genetic tools have become available to target each of the lineage’s cell types, either to induce cell depletion or gene deletion/mis-expression. In particular, airway epithelium line-age has proven to be a great model system for tracking responses to cell depletion in a semi-quantifiable way—following genetic depletion of a given cellular type, the response of the remaining cells can be precisely measured and tracked in time. Semi-quantitative nature of these recently published experiments provides a plethora of valuable numerical information, which can be modeled.
By using our methodology, we were able to incorporate the available data and come up with a set of control networks that are compatible with the observed recovery patterns of the airway epithelium [26–28]. Further, we concerned ourselves with the general question of tissue design. It has been reported in the recent literature [29] that in the three-compartment cellular lineage of the airway epithelium, the SCs are characterized by mostly asymmetric divisions, while the secretory cells (SecrCs), the next cell type in the differentiation hierarchy, are characterized by mostly symmetric divisions. By using the mathematical approach developed here, we show that (1) predominantly symmetric divisions of the SecrCs is a necessary feature that makes the lineage system compatible with the reportedly slow dynamics of the most differentiated ciliated cells (CilCs), and that (2) predominantly asymmetric divisions of the SCs may be the conse-quence of the mathematical fact that asymmetric SC divisions, under the other existing con-straints of the airway epithelial system, minimize the fluctuations of both SC and SecrC populations.
Our work contributes to the growing computational literature on SC dynamics. Many aspects of SC dynamics have been modeled and studied mathematically. Methodologically, both discrete and continuous computational models have been used, particularly in the context of SC mutagenesis and carcinogenesis [30–41]. In addition to cancer, normal SC behaviors, such as (i) symmetry vs. asymmetry of SC divisions, (ii) SC quiescence vs. proliferative activa-tion, and (iii) progressive lineage specification have been modeled, such as in the hematopoietic system [42–46]. Here, again, both deterministic and stochastic models have been introduced and studied (see the review in [47]). Lineage decision-making controls have been studied deter-ministically both in the context of minimalistic two-compartment, as well as multi-compart-ment models [48–52]. Stochastic lineage systems have been considered as well in [53–59], and feedback regulation of SC dynamics has been modeled in [48,48,60]. The present approach attempts to generalize the description of SC dynamics in the context of healthy tissue turnover. We strive to create a framework general enough to describe any feasible control network for any hierarchical organization, but at the same time to find a way for analytical understand-ing of the resultunderstand-ing dynamics, focusunderstand-ing on the role of various control loops in homeostatic maintenance.
Methods
cellular processes that change the number and/or type of cells in different compartment. Exam-ples of such processes are symmetric proliferations of SCs, death of differentiated cells, or de-differentiaion of intermediate cells.
Let us denote byQk(i1,. . .,in) the rates at which these processes take place. Here we assume
that in principle, these rates can be functions of all the cell populations in the lineage. In reality, not all populations can control each process. Therefore, it is useful to consider partial deriva-tives of the rates with respect to different population sizes. For example, quantity
@Qp
@iq ; ð1Þ
where the derivative is evaluated at the equilibrium (the homeostatic state), informs us whether or not processQpis regulated by cells in compartmentq. If the derivative above is positive
(negative), then the control is positive (negative). A zero derivative means the absence of con-trol. We sometimes refer to quantitiesEq (1)as simply“controls”.
A convenient way to think about all possible controls is in terms of networks, where one set of nodes corresponds to all the compartments and the second set of nodes to all the processes. The existence of a signed edge between a compartment and a process corresponds to the exis-tence of the corresponding control. The magnitude of controlsEq (1)can be presented as weights of the corresponding edges. A stable control network possesses a set of weights that lead to a stable homeostatic state. A minimal network contains the smallest possible number of edges.
Associated with each process,k, we further define a vector of associated increments of all the cell populations, (Δki1,. . .,Δkin). For example, in a three-compartment system consisting
of SCs, intermediate cells, and differentiated cells, symmetric proliferation of SCs results in increment (1, 0, 0), death of differentiated cells in increment (0, 0,−1), and de-differentiation
of intermediate cells in increment (1,−1, 0). These vectors can be thought of as signatures of all the processes that happen in the lineage.
Constraints on the equilibrium rates
The equilibrium is defined bynalgebraic equations for thenvariables,ði1
;. . .;i
n
Þ, which are
the equilibrium population sizes of all the compartments:
XK
k¼1 Qkði
1
;. . .;i
n
ÞDki
1
¼0;. . .;X
K
k¼1 Qkði
1
;. . .;i
n
ÞDki
n¼0: ð2Þ
If the functional form of all the ratesQkis known, then the equilibria can be determined. In
reality, the equilibrium population values can be measured, but the functional form ofQkis
unknown. Therefore, it is more useful to interpreteq (2)as a linear system of equations for the equilibrium rates, which imposesK−nconstraints on the rate values. In other words, only
K−nout ofKrates can be assigned an independent value at the equilibrium.
Stability and robustness
Controls of the different processes combine with the cellular increments to form the Jacobian corresponding to the equilibrium point,
J¼ famjg; amj¼
XK
k¼1 @Qk
@ij Dki
m; 1m;jn; ð3Þ
Section 1, that the eigenvalues ofJinform us not only of the stability of the deterministic equa-tions, but also of the stability of the system involving higher moments. The control loops define how sparse matrixJis.
System robustness can be investigated alongside with stability in the following way. Suppose that the control loops are fixed in the sense that we know the topology of the control network (which cell population controls which process(es)), and the sign of controls. Let us vary the val-ues of nonzero derivativesEq (1)within some bounds. What portion of the set of parameters corresponds to a stable system? In the most robust scenario, we have a sign-stable matrixJ, that is, it is stable for all parameter values of the given signs. In a less robust scenario, only a small portion of parameter space corresponds to stability.
Variance
While the equilibrium constraints and the Jacobian are obtained by deterministic methods, the next step of the analysis is stochastic. Here we extend the methodology developed in [5] and [61] to describe multi-compartment, multi-process systems. Let us denote byypqthe
covari-ance of the populations in compartmentspandq. It is convenient to form the variance vector,
~y¼ ðy11;y12;. . .;y
nnÞ
T :
Quantitiesy11,. . .,ynncorrespond to second central moments, or the variances, of the cell
pop-ulations. The covariances and the variances can be determined analytically from (i) the equilib-rium rates, (ii) the control values, and (iii) the increments associated with the processes. It is convenient to define matrixWas the Kronecker sum
W¼JJJIþIJ; ð4Þ
where matrixIrepresents the identity matrix (seeS1 Text, Section 1 for details). This matrix contains the information about the controls at the equilibrium. The information about the equilibrium rates and the increments is combined in ann2× 1 vector~s¼ ðs11;s12;. . .;s
nnÞ
T
, which has elements
spq¼
XK
k¼1 QkDki
p
Dki
q; p;q¼1;2;. . .;n: ð5Þ
The covariances are then given as solutions of the linear system
W~y¼ ~s: ð6Þ
Because of the special form of the matrixW,eq (6)is equivalent to the continuous Lyapunov equation,
JYþYJT ¼ S:
Here,Yis ann×nmatrix with elementsypq,Jis the Jacobian (eq (3)), andSis ann×nmatrix
with elementsspq(eq (5)). This equation arises in the Lyapunov stability theory and several
applications of control theory [62,63]. Its unique solutionYcan be expressed in terms of matrixJin the following way,
Y ¼
Z 1
0
expðJtÞSexpðJTtÞdt; ð7Þ
Stochastic and deterministic analysis
Both types of analysis (the regular stability analysis and analysis of variance) share some important features, which is expected. For example, if the real parts of all the eigenvalues become larger (and negative) in a certain direction of the parameter space, the variances of all the populations will decrease in the same direction. If on the other hand, different eigenvalues become more“stable”for different parts of the phase space, we expect that variances of differ-ent populations might be minimized in differdiffer-ent regions of the parameter space.
The variance analysis however provides more information. These additional insights are as follows:
• Because the size of the variance is calculated explicitly in this analysis, one can derive biologi-cally meaningful constraints on the parameters based on the tolerable % change of a popula-tion size in a given tissue. This comes naturally from the expressions for the variance.
• From the optimization point of view, it is not clear how to weigh different eigenvalues in the linear analysis, if one were to deduce the“best”architecture. A problem arises if different eigenvalues experience minima for different parameter combinations. If explicit expressions for variances are available, then one can derive an optimization problem where the weights of different variances are controlled (see Section 3 ofS1 Textfor an example that is worked out in detail).
• Eigenvalues only depend on derivatives of the rates, but the variances also depend on the equi-librium values of the rates. The analysis of variance can inform us, for example, whether and by how much the magnitude of different processes affects fluctuations in each compartment.
Therefore we conclude that the study of the variances, while sharing some important fea-tures with the usual linear analysis, contributes additional information that can allow us to argue about aspects of tissue design and the functioning of stem cell lineages. In the next sec-tion we demonstrate the power of this methodology by using the example of the airway epithelium.
Results
The airway epithelium: Biological information
Airway epithelium lines the inner surface of the trachea and bronchi in the lung. It is organized as a two-dimensional sheet of cells sitting on top of the basement membrane. Because all cells are attached to the basal membrane, it is technically a single-layered epithelium. Its lineage consists of three principle cell types: (1) stem cells (SCs), and two distinct differentiated cell types: (2) secretory (SecrCs) and (3) ciliated cells (CilCs) [65–67]. At homeostasis all cells are distributed at the following approximate stem-to-secretory-to-ciliated ratio: 30%-15%-55%.
airway epithelium injury experiments, the types of lineage responses that they invoke, as well as the types of regulatory mechanisms that they reveal.
Scenario I: Depletion of ciliated cells [27]. Surprisingly, when CilCs only are depleted using the Cre-lox genetic strategy, the remaining cells, SCs and SecrCs, do not undergo com-pensatory proliferative activation and differentiation (for SCs) or trans-differentiation (for SecrCs) into new CilCs to quickly compensate for the loss. Instead, very slow replenishment of the CilCs takes place, most likely at the rate not significantly different from the normal, homeo-static rate. This experiment suggests that:
(A) CilSc do not provide negative feedback to SCs and SecrCs, since the latter do not activate in response to CilC depletion.
Scenario II: Depletion of SCs [26]. When SCs are depleted from the airway epithelium, this results in the following responses:
• SecrCs exit quiescence and undergo proliferative activation and multiply.
• They also rapidly de-differentiate into new SCs, restoring them.
• Furthermore, they convert into more CilCs.
• Preexisting CilCs do not appear to activate, consistent with the notion that they are termi-nally differentiated and post-mitotic.
These observations show that, after SC depletion, 8% of SecrC progeny convert to new SCs and 34% into new CilCs, while the remainder stays as SecrCs. At that point, repaired lineage appears to equilibrate and return back to homeostasis. This experiment reveals the following additional information about the airway epithelium lineage controls:
(B) SCs provide forward control to SecrCs, maintaining them in the quiescent state (i.e. pre-vent proliferation);
(C) Upon homeostasis, SCs also prevent SecrCs from converting into SCs and CilCs via de-dif-ferentiation and trans-difde-dif-ferentiation routes respectively.
In other words, SCs signal to maintain SecrC quiescence and identity. Additional experi-ments showed that the molecular identity of this forward SC-to-SecrC control is a short-range Notch signaling. It operates via cell-to-cell contact between neighboring cells.
Scenario III: Simultaneous depletion of SecrCs and CilCs [28]. When both differenti-ated cell types are depleted, the remaining SCs undergo rapid proliferative activation and dif-ferentiation into new CilCs and SecrCs, quickly restoring the lineage. This experiment reveals the following additional information about the airway epithelium lineage controls:
(D) Upon homeostasis, differentiated cells provide negative feedback to SCs, preventing their activation.
Considering that SCs do not become activated upon depletion of CilCs only (see scenario I), it can be assumed that most of the negative feedback is exerted by SecrCs.
Modeling and stochastic analysis
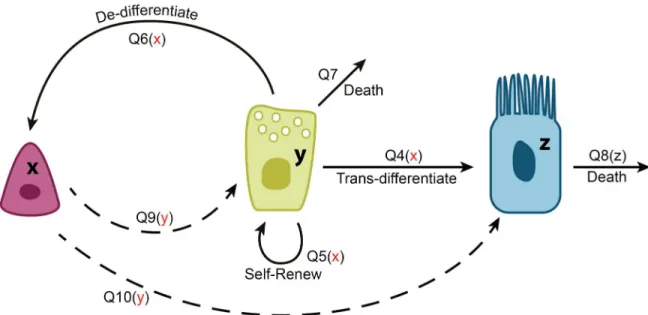
stability and fluctuation magnitudes will allow us to argue about possible control network architectures compatible with the biological observations, and to explain the observed prefer-ences for division symmetries and de-differentiation strategies. InFig 1andTable 1we show eleven cellular processes that can happen in the airway epithelium. Each of these processes results in a change in the abundance of at least one of the three cell types, SCs, SecrCs, and CilCs. Controls are incorporated by assuming that the rate of each of the processes can be influenced by any of the existing population, such that near the equilibrium,
Qkðx;y;zÞ Qk;0þQkxðx x0Þ þQkyðy y0Þ þQkzðz z0Þ; ð8Þ
where (x0,y0,z0) are the equilibrium numbers of SCs, SecrCs, and CilCs respectively,Qk0is
the rate of processQkat equilibrium, and quantitiesQkx,Qky,Qkz(which we call“controls”)
are derivatives of this rate with respect to the three population sizes. These three quantities describe how strongly, and in which direction, the intensity of a process changes if each of the populations experiences afluctuation. A negative value of such a derivative corresponds to a negative control loop.
To be precise, paper [29] identified more complexity in the dynamics of SCs in the airway epithelium. It was found that SCs do not divide directly into CilCs or SecrCs. Instead, they cre-ate (by predominantly asymmetric divisions) a different type of progenitor cell (called luminal progenitors) which later mature into SecrCs. Our model combines this into just one step, an asymmetric division into SecrCs. Adding this intermediate step effectively changes the rate of processQ9yand is therefore not implemented.
Although each of the controls may be a nontrivial number, we strive to create the simplest model that is compatible with the existing observations. Such a model must include a negative regulation of SC divisions by SecrCs (fact(D)above). Further, divisions and de-differentiation of SecrCs is negatively regulated by SCs (facts(B), (C)above). Finally, CilCs do not exert any known control over the processes happening in the SC and SecrC compartments (fact(A)). We further assumed that the overall rate of CilC death increases with their abundance (note that this is not a per-cell rate, but the overall intensity of apoptosis). Therefore, only some of the derivatives ineq (8)will be nonzero. We list these possible controls here:
Q1y;Q2y;Q3y;Q4x;Q5x;Q6x;Q8z;Q9y;Q10;y;Q11;y: ð9Þ
All of these are nonpositive exceptQ8z, which is nonnegative.
Interestingly, not all of the eleven processes make equal contribution to the maintenance of stable homeostasis. In [29], it was shown that an overwhelming majority of SC divisions are asymmetric, and an overwhelming majority of the SecrC divisions are symmetric. Our first goal is to explain this type of design.
Why do airway epithelium SecrCs divide mostly symmetrically?. Let us employ formu-lation (8)(where the equilibrium cell numbers is consistent with experimentally measured val-ues [67–69], (250, 200, 550)), and then usesystem (2)to define three constraints on the unknown equilibrium process rates:
Q8;0¼2Q2;0þ2Q4;0þQ10;0þQ11;0; ð10Þ
2Q5
;0¼ 2Q1;0 2Q3;0þ2Q7;0þQ8;0 2Q9;0 Q10;0 Q11;0; ð11Þ
Q6;0 ¼Q1;0þQ2;0 Q3;0: ð12Þ
epithelium CilCs are significantly slower than that of SCs and SecrCs. FromFig 1it is apparent that the processes that change the number of CilCs areQ2,Q4,Q8,Q10,Q11(they are marked
by green arrows on thefigure). To maintain a constant level of CilCs, they have to balance out in the way described byeq (10). In particular, a known low equilibrium death rate of CilCs,
Q8,0means that all the division rates for processesQ2,Q4,Q10,Q11will be similarly low.
Assuming that the turnover rates of SCs and SecrCs are higher than those for CilCs, we
Fig 1. A schematic showing the cellular processes in the model of airway epithelium.The three types of cells are depicted (from left to right): SCs, SecrCs, and CilCs. They are denoted by the variablesx,y, andzrespectively. The processes are shown by arrows, where dashed lines denote asymmetric divisions, see alsoTable 1. For each process, its regulation, if any, is shown in the brackets, with red symbols denoting negative regulation. Processes that contribute to the slow dynamics of CilCs are denoted by greed arrows.
doi:10.1371/journal.pcbi.1004990.g001
Table 1. Cellular processes in the airway epithelium model.
Qk Process Δki1 Δki2 Δki3
Q1 Differentiation of SCs into SecrCs by symmetric divisions -1 2 0
Q2 Differentiation of SCs into CilCs by symmetric divisions -1 0 2
Q3 Symmetric self-renewal of SCs 1 0 0
Q4 Differentiation of SecrCs into CilCs by symmetric divisions 0 -1 2
Q5 Symmetric self-renewal of SecrCs 0 1 0
Q6 De-differentiation of SecrCs 1 -1 0
Q7 Death of SecrCs 0 -1 0
Q8 Death of CilCs 0 0 -1
Q9 Asymmetric divisions of SCs producing one SecrC offspring 0 1 0
Q10 Asymmetric divisions of SCs producing one CilC offspring 0 0 1
Q11 Asymmetric divisions of SecrCs producing one CilC offspring 0 0 1
A description of the processes depicted inFig 1. Although processesQ5andQ9,Q10andQ11are equivalent
from the viewpoint of cellular population change, we count them as different processes, because they can be regulated differently.
immediately obtain that of the three division processes for SecrCs (Q5,Q4,Q11), the symmetric
proliferation must be the highest. In other words, SecrCs are predicted to divide predominantly in a symmetric way by an argument simply based on cell balance at the equilibrium.
Why do airway epithelium SCs divide mostly asymmetrically?. Based on the above argu-ment, by whichQ2,Q4,Q8,Q10,Q11are all slow processes, we can simplify the description of
the system’s dynamics. Namely, we separate the time-scales and consider the relatively fast dynamics of SCs and SecrCs separately, as a two-compartment system. This is achieved by assuming that the population of CilCs changes slowly (and is a constant on the time-scale of the change in SCs and SecrSc). Because no processes involving SCs or SecrCs are regulated by CilCs, the equations for SCs and SecrCs separate. In this system, the following processes take place:
Q1;Q3;Q5;Q6;Q9:
We would like to understand why SCs tend to divide predominantly in an asymmetric way, by looking at the variances of the cell populations. Which relative values ofQ1andQ3can
min-imize the variance?
We begin by rewriting eqs (11) and (12) to include only nonzero equilibrium values:
Q5;0 ¼ Q1;0 Q3;0þQ7;0 Q9;0; ð13Þ
Q6;0 ¼Q1;0 Q3;0 ð14Þ
(thefirst equation,Eq (10), is now an identity 0 = 0). Further, we examine the expressions for the variance, by solvingeq (6), seeS1 Text, Section 5 for the relevant expressions. It turns out that the variances satisfy the following properties:
• The variance of CilCs is zero, because in the current approximation CilC dynamics is not included:Var[z] = 0.
• The variances of SCs and SecrCs,Var[x] andVar[y], do not depend on the amplitudeQ9,0of
asymmetric SC divisions.
• They are linear functions of the amplitudesQ1,0andQ3,0of symmetric SC divisions, with
coefficients that depend of the controls.
Therefore, we can reduce our optimization problem to that of linear minimization, seeS1 Text, Section 5 (simple linear programming techniques work for a subclass of systems, and in the most general case a proof is provided based on the matrix properties of solutionEq (7)). It turns out that both SC and SecrC variances are minimized for zero values ofQ1,0andQ3,0,
which in turn suggests that the optimal SC division pattern from the point of view of homeo-stasis maintenance is asymmetric divisions. Incidentally, asymmetric SC divisions are also associated with a higher degree of robustness of the system: the stability condition in the absence of SC symmetric divisions becomesQ6xQ9y>0, and is always satisfied under the
cor-rect sign assignments for the controls.
Stability and recovery dynamics. Given the above considerations and observations of [29], we will assume that SCs divide purely asymmetrically and SecrCs divide purely symmetri-cally, by settingQ1=Q2=Q3=Q9=Q11= 0, seeFig 2. Other possibilities are explored inS1
Systems(10)–(12)can be rewritten as
Q6;0¼0; ð15Þ
Q9;0 ¼Q4;0 Q5;0þQ7;0; ð16Þ
Q10;0¼ 2Q4;0þQ8;0: ð17Þ
Note that thefirst of these equations suggests that under homeostatic conditions, de-differenti-ation of SecrCs is suppressed, which coincides with the results of [29]. To analyze stability, we canfind the eigenvalues of the JacobianEq (3), which in this case are simply
Q6x;Q5yþQ9y; Q8z; ð18Þ
all negative numbers under our assumptions. This demonstrates that the model is extremely robust, in the sense that any numerical values of the controls with the correct sign will guaran-tee stability. Here we used the term“robust”in the same was as we did in [5], that is, the system is stable under a large parameter set.
To find the variance, we solveeq (6). In the case of the control system depicted inFig 2, we find
y11 ¼ 0;
y22 ¼ Q4;0þQ5;0þQ7;0
2jQ9
yj ;
y33 ¼ Q8;0Q9yðQ9y Q8zÞ þQ4;0½ð
2Q9
yþQ10yÞ
2
4Q9
yQ8z þ ðQ5;0þQ7;0ÞQ 2 10y
2Q9
yQ8zðQ9y Q8zÞ
: ð19Þ
Thefirst equation suggests that the number of SCs in this system does not vary; this is because SCs only divide asymmetrically and their numbers do not change. The second and third equa-tions present the variance of SecrCs and CilCs in terms of system parameters.Fig 3shows how these two quantities depend on the amount of inhibition of SC divisions by the SecrCs. We can see that a strong inhibition of differentiation into SecrCs, and a weak inhibition of differentia-tion into CilCs corresponds to the smallest variance.
The next observation concerns the concept of“minimal control”[5] (a minimal control is a control network with the smallest possible number of loops). What control loops can be elimi-nated from the system without compromising its stability? Further, elimination of which con-trols does not increase the system’s variance? QuantitiesQ4xandQ10ydo not enter the stability
condition;Q4xdoes not change the variances, and decreasing |Q10y| helps to minimize the
variance of CilCs. These observations lead us to conclude that the negative control of SC asym-metric divisions into CilCs and differentiation of SecrCs into CilCs do not have to be under control from any of the cell populations. Eliminating those control loops (that is, setting
Q10y=Q4x= 0), does not make the system unstable. In fact, it helps to decrease the variance of
CilCs without affecting the variance of other cell types.
Finally, we examine the dynamics of the cell populations under control system inFig 2. Because we do not have numerical values for the coefficients, we have explored a large number of systems where coefficients were generated randomly. First, we generated coefficientsQ5,0
andQ7,0as uniformly distributed random numbers between 0 and 1. Then, we made sure that
the steady-state death rate of the CilCs is small (as suggested by measurements), and generated
Q4,0andQ8,0as random numbers in [0,] (with= 0.01). The rest of the steady state values are
coefficients. Next, we generated the negative controlsQ4x,Q5x,Q6x,Q9y,Q10yin the range [−, 0],
and the positive controlQ8zin the range [0,]. Any system created in this way will be stable
because of the form of the eigenvaluesEq (18).
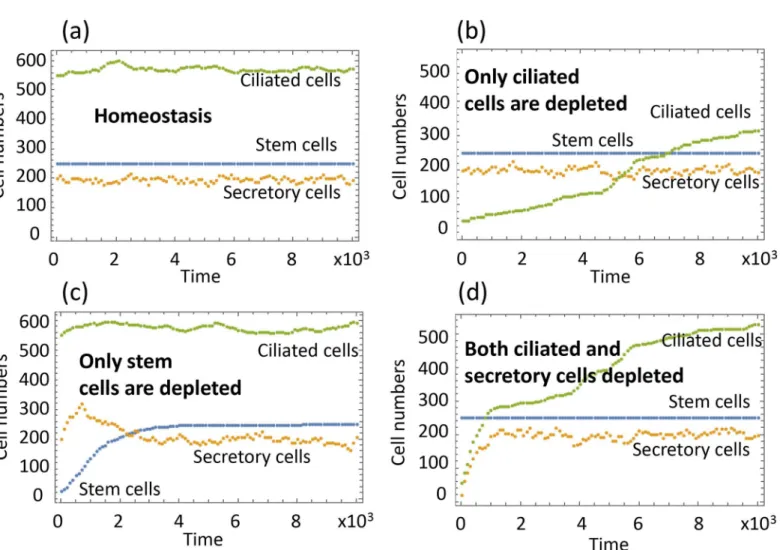
InFig 4(a)one can see a typical run of the system under homeostasis. In stochastic simula-tions, at each update, exactly one cellular process happens out of the possibilities inFig 2. The
Fig 2. A schematic showing the cellular processes in the reduced model of airway epithelium.xdenotes SCs,ydenotes SecrCs, andzdenotes CilCs. SCs only divide asymmetrically, and SecrCs only divide symmetrically.
doi:10.1371/journal.pcbi.1004990.g002
Fig 3. The variance of (a) SecrCs and (b) CilCs as a function of system’s parameters.Two controls are varied:Q9ymeasures the strength of inhibition of SC differentiation into SecrCs, andQ10ymeasures inhibition of differentiation into CilCs. The contour plots have the levels marked. The rest of the parameters areQ4= 0.00078 −0.0074(x−x0),Q5= 0.041−0.0058(x−x0),Q6= 0.32−0.0043(x−x0),Q7= 0.937,Q8= 0.0056 + 0.001(z−z0),
probability of processkis given byQk/∑mQm. The functionsQk(x,y,z) are assumed piecewise
linear. They are given byexpression (8)if it is positive, and they are equal to zero otherwise.
Fig 4(b)–4(d)show recovery dynamics, reproducing experimentally tested scenarios (I-III) described above. In (a), we start with a 90% reduced population of CilCs, and observe a very slow recovery, as demonstrated in scenario (I). This is a slow process because the processes maintaining CilCs are slow (due to the smallness of the coefficients in the functionsQ8(death)
andQ10,Q4(replenishment by SCs and SecrCs respectively). The intensity of these processes
does not change as CilCs are depleted. The recovery happens purely by breaking the balance between deaths (which are less frequent if CilCs are depleted) and production (which does not change as CilCs are removed).
Fig 4(d)demonstrates scenario (III), where both CilCs and SecrCs are depleted. We can see a relatively fast recovery of both cell types. In particular, when SecrCs are depleted, the decrease inyupregulates the activity of SCs, which differentiate into SecrCs thus replenishing both SecrCs and CilCs, consistent with the reported biological observations.
Fig 4. Homeostasis and recovery dynamics in the airway epithelium.Typical runs with different initial conditions are presented. (a) Homeostasis: the initial condition is given byx=x0,y=y0,z=z0. (b) Experimental scenario I: the initial condition is given byx=x0,y=y0,z= 0.1z0. (c) Scenario II:x= 0.1
x0,y=y0,z=z0. (d) Scenario III:x=x0,y= 0.1y0,z= 0.1z0. The equilibrium values are as inFig 3, and the rest of parameters are:Q4= 0.0089−0.0008
(x−x0),Q5= 0.083−0.0092(x−x0)−0.006(y−y0),Q6= 0.85−0.0022(x−x0),Q7= 0.911,Q8= 0.0019 + 0.0029(z−z0),Q9= 0.0075−0.0027(y−y0),
Fig 4(d)demonstrates scenario (II), where SCs are depleted, and then successfully recover. This is an interesting case given that under homeostatic conditions the population of SCs remains constant. If it is depleted, the SecrCs are triggered into de-differentiation, providing a mechanism of recovery for SCs.
Discussion
In this work we studied stochastic multi-compartment dynamics of SCs and their lineages. We developed a simple and effective method to mathematically describe any type of multi-com-partment lineage system. We could find the analytical results for the expectation and variance of the population of any type of lineage-connected cells, assuming that we know the inverse of a simple deterministic matrix. Furthermore, the stability conditions for the multi-compartment SC dynamics were identified.
The general method developed in this paper is applicable for studying a very large class of cel-lular lineages, and not just simple linearn-compartment models. The technique can naturally include any type of hierarchical or two-way relationships among cells. As described in the Intro-duction, in most tissues and organs, there are more than just two types of cells, and hierarchical cellular networks are sometimes arranged in a complex nonlinear fashion. Our technique (and the symbolic algorithm developed) are capable of handling such systems. The goal is to study the stability and robustness of control networks that maintain homeostasis in such complex systems. We also applied these techniques to interrogate the lineage dynamics in a particular biologi-cal system, the mouse airway epithelium. In this system, there are three principal types of cells (SCs, SecrCs, and CilCs) that are lineage-connected and can influence each other’s fate deci-sions. Symmetric and asymmetric divisions, deaths, differentiation and de-differentiation can all take place. There are significant available biological data with regards to the division types and the recovery dynamics in response to injury that take place in the airway epithelium, thus enabling us to compare mathematically derived behaviors with the actual cellular actions. Interestingly, we found that there are multiple ways in which all of the above cellular processes can be mathematically arranged and regulated so that they are stable and compatible with the existing experimental evidence on the lineage recovery dynamics. For example, mathemati-cally, all divisions can be symmetric, or asymmetric, or mixed, and either one of these division types is compatible with the biologically observable lineage dynamics. Yet, recent biological data shows that airway epithelium SCs divide almost exclusively asymmetrically, while SecrCs divide almost exclusively symmetrically.
By using the framework developed here, we offer an explanation of these symmetry pat-terns. It turns out that the predominantly symmetric divisions of SecrCs can be ascribed to the requirement of balance of various cellular processes at equilibrium. At equilibrium, one must expect to have cellular loss (from say differentiation, de-differentiaion, or death) to be balanced by cellular gain. In the case of the airway epithelium, we considered the peculiarly slow turn-over dynamics of CilCs and derived a balance equation for CilC change. Then, from the requirement that the death rate of CilCs is slow [70], we deduced that by necessity, SecrCs must divide predominantly symmetrically, to avoid unbalanced accumulation of CilCs.
consistent with the steady cell numbers, slow turnover dynamics of the CilCs, and minimal var-iance of the cell populations at homeostasis.
We have also focused on a particular lineage behavior revealed in the recent work suggesting the lack of negative feedback from the differentiated CilCs to SCs or SecrCs following genetic depletion of CilCs [29]. We used the smallest possible number of control loops to study this phenomenon mathematically. We show that minimally parameterized model can robustly mimic the biologically observable slow CilCs recovery dynamics. Furthermore, the same model can robustly mimic quick lineage recovery dynamics when both CilCs and SecrCs are depleted. Consistent with the speculated mechanism, we now show quantitatively that robust, biologi-cally compatible airway epithelium lineage behaviors are possible when only one out of two dif-ferentiated cell types (SecrCs) provide negative feedback to SCs. This control arrangement explains why no lineage recovery mechanism gets triggered when only CilCs are injured.
On its surface, it would appear that such lineage“blindness”to CilC depletion represents a major vulnerability of the airway epithelium. Clearly, biologically speaking, lack of quick epi-thelium repair would compromise its anatomical integrity and function. What can then explain this seemingly irrational control design? We hypothesize that this way of lineage control repre-sents an example of an evolutionary“economy”. Clearly, having two negative control loops to SCs (both from the CilCs and SecrCs) would lead to a robust and quick recovery following all types of differentiated cell loss. However, in a real-life situation it is likely unnecessary for the epithelium to be able to quickly recover from the loss of only one type of differentiated cells. To-date, there are no natural events that would deplete one but not the other type of differenti-ated cells; this can be only induced experimentally using an artificial genetic system. On the other hand, depletion of both CilCs and SecrCs happens, commonly following inhalation of the poisonous naturally occurring sulfur dioxide (SO2) [71,72], or as the result of acute viral infection, such as with the influenza virus [26,73]. Therefore, such naturally occurring injuries are enough to be able to trigger repair mechanisms by removing an inhibitory signal emanated by just one cell type. Conditions of scenario III (specific CilC loss) do not represent a situation for which an organism should be prepared. This interesting experiment reveals the absence of a signaling loop from CilCs back to SCs. We can think of this arrangement of control loops as an example of cooperation among different cell types. SecrCs signal back to SCs to help recover their own loss and the loss of CilCs.
Another type of question that can be addressed with our framework is the necessity for vari-ous processes in control networks. For example, stability analysis shows that SecrCs de-differ-entiation to SCs in the airway epithelium is not observed under the equilibrium conditions (to keep the balance of cell numbers,eq (15), which coincides with earlier reports [29]). At the same time, de-differentiation is the process that has been experimentally shown to allow for the quick recovery of the SC numbers after their removal [26], seeFig 4(c). The question arises whether de-differentiation may have another role in the system, because catastrophic SC deple-tion (of the type created in the experimental setup of [26]) is probably unlikely under natural conditions. Why did the mechanism of de-differentiation evolve in the first place? The answer to this question comes directly from our theory. The presence of de-differentiation, and more specifically, de-differentiation controlled negatively by the SC population, is a necessary condi-tion for the system’s stability, as follows from the expression for the first eigenvalue inEq (18). The biological explanation of this condition is that SC death occurs at low rates (e.g. due to mutations). Since SCs divide strictly asymmetrically, they are not able to compensate for low rate of SC death over time. We propose that this can be compensated by SecrC de-differentia-tion, as follows from out analysis.
the literature, spatial models of SC dynamics have been studied by several authors [41,55,60,
74–77], see also the reviews [78–80]. Analytical results have only been obtained in the simplest systems, and did not include any considerations of regulatory networks. Our first attempts of the analytical treatment of spatially distributed SC systems are concerned with cell mutagenesis and cancer generation [81]. In [82] we provide analytical solutions of a very simple, spatially regu-lated SC lineage again in the context of carcinogenesis and tumor suppressor gene inactivation. The present framework can only mimic spatial tissue organization by weighing“local”and
“global”control loops differently. An explicit treatment of spatial structures is subject of future work. Another limitation of this theory is the requirement of relatively small deviations from the equilibrium. Theoretical basis for this approach (which stems from the linear noise approxima-tion [61]) requires a weak dependence of the control functions on cell population numbers. While injury recovery dynamics certainly can be modeled by means of stochastic simulations, as we did in the current paper, the theory is inherently“local”. More analysis is required to study the global stability and global dynamics of SC systems, see [50–52].
As the final message, we would like to propose that the current framework can be used to study the general principles that govern SC lineage dynamics, across tissues. Several such candi-date principles come to mind, including (1)“economy”(the non-existence of overlapping controls not needed for stability or robustness), (2)“cooperation”(such as in the example given by SecrCs signaling back to SCs to help compensate for the CilC loss as well as their own), and (3)“ robust-ness”in the sense that certain loop arrangements allow stability for very large parameter regions, compared to others. In the airway epithelium example, the observed network is stable for any parameter values as long as they have the correct sign, in contrast to some other network configu-rations considered inS1 Text, Section 4. By using our methodology, one can study such patterns of cell regulation and ask how they trade off in the context of stability and variance minimization. This is one of future directions of research and immediate applications of the near equilibrium cal-culus of stem cells developed here, albeit in some tissue types application of this technique can be hindered by the time scale and spatial scale separation of cells within the lineages.
Supporting Information
S1 Text. An in-depth mathematical analysis, further examples, and exploration of the parameter space.Additional figures are presented.
(PDF)
S1 File. AMathematicafile that performs the symbolic analysis of the lineage dynamics for a given model.Equilibrium conditions, stability analysis and the variance calculations are pre-sented.
(NB)
Author Contributions
Conceived and designed the experiments: NLK MVP. Performed the experiments: NLK ZS. Analyzed the data: NLK ZS. Contributed reagents/materials/analysis tools: NLK ZS. Wrote the paper: NLK MVP ZS.
References
1. Fox IJ, Daley GQ, Goldman SA, Huard J, Kamp TJ, Trucco M. Use of differentiated pluripotent stem cells as replacement therapy for treating disease. Science. 2014; 345(6199):1247391. doi:10.1126/ science.1247391PMID:25146295
3. Barnabé-Heider F, Frisén J. Stem cells for spinal cord repair. Cell stem cell. 2008; 3(1):16–24. doi:10. 1016/j.stem.2008.06.011PMID:18593555
4. Migliaccio AR, Whitsett C, Papayannopoulou T, Sadelain M. The potential of stem cells as an in vitro source of red blood cells for transfusion. Cell stem cell. 2012; 10(2):115–119. doi:10.1016/j.stem.2012. 01.001PMID:22305561
5. Komarova NL. Principles of regulation of self-renewing cell lineages. PloS one. 2013; 8(9):e72847. doi: 10.1371/journal.pone.0072847PMID:24019882
6. Yang J, Plikus MV, Komarova NL. The Role of Symmetric Stem Cell Divisions in Tissue Homeostasis. PLoS Comp Bio. 2015;to appear. doi:10.1371/journal.pcbi.1004629
7. Wang LD, Wagers AJ. Dynamic niches in the origination and differentiation of haematopoietic stem cells. Nature Reviews Molecular Cell Biology. 2011; 12(10):643–655. doi:10.1038/nrm3184PMID:21886187 8. Kiel MJ, Morrison SJ. Uncertainty in the niches that maintain haematopoietic stem cells. Nature
Reviews Immunology. 2008; 8(4):290–301. doi:10.1038/nri2279PMID:18323850
9. Barker N. Adult intestinal stem cells: critical drivers of epithelial homeostasis and regeneration. Nature Reviews Molecular Cell Biology. 2014; 15(1):19–33. doi:10.1038/nrm3721PMID:24326621 10. Medema JP, Vermeulen L. Microenvironmental regulation of stem cells in intestinal homeostasis and
cancer. Nature. 2011; 474(7351):318–326. doi:10.1038/nature10212PMID:21677748
11. Kopan R, Lee J, Lin MH, Syder AJ, Kesterson J, Crutchfield N, et al. Genetic mosaic analysis indicates that the bulb region of coat hair follicles contains a resident population of several active multipotent epi-thelial lineage progenitors. Developmental biology. 2002; 242(1):44–57. doi:10.1006/dbio.2001.0516 PMID:11795939
12. Legué E, Nicolas JF. Hair follicle renewal: organization of stem cells in the matrix and the role of stereo-typed lineages and behaviors. Development. 2005; 132(18):4143–4154. doi:10.1242/dev.01975 PMID:16107474
13. Sequeira I, Nicolas JF. Redefining the structure of the hair follicle by 3D clonal analysis. Development. 2012; 139(20):3741–3751. doi:10.1242/dev.081091PMID:22991440
14. Arwert EN, Hoste E, Watt FM. Epithelial stem cells, wound healing and cancer. Nature Reviews Can-cer. 2012; 12(3):170–180. doi:10.1038/nrc3217PMID:22362215
15. Plikus MV, Gay DL, Treffeisen E, Wang A, Supapannachart RJ, Cotsarelis G. Epithelial stem cells and implications for wound repair. In: Seminars in cell & developmental biology. vol. 23. Elsevier; 2012. p. 946–953.
16. Geyfman M, Plikus MV, Treffeisen E, Andersen B, Paus R. Resting no more: re-defining telogen, the maintenance stage of the hair growth cycle. Biological Reviews. 2014;. doi:10.1111/brv.12151PMID: 25410793
17. Barker N, van Oudenaarden A, Clevers H. Identifying the stem cell of the intestinal crypt: strategies and pitfalls. Cell stem cell. 2012; 11(4):452–460. doi:10.1016/j.stem.2012.09.009PMID:23040474 18. Gerbe F, Legraverend C, Jay P. The intestinal epithelium tuft cells: specification and function. Cellular
and Molecular Life Sciences. 2012; 69(17):2907–2917. doi:10.1007/s00018-012-0984-7PMID: 22527717
19. Yan KS, Chia LA, Li X, Ootani A, Su J, Lee JY, et al. The intestinal stem cell markers Bmi1 and Lgr5 identify two functionally distinct populations. Proceedings of the National Academy of Sciences. 2012; 109(2):466–471. doi:10.1073/pnas.1118857109
20. Takeda N, Jain R, LeBoeuf MR, Wang Q, Lu MM, Epstein JA. Interconversion between intestinal stem cell populations in distinct niches. Science. 2011; 334(6061):1420–1424. doi:10.1126/science. 1213214PMID:22075725
21. Tian H, Biehs B, Warming S, Leong KG, Rangell L, Klein OD, et al. A reserve stem cell population in small intestine renders Lgr5-positive cells dispensable. Nature. 2011; 478(7368):255–259. doi:10. 1038/nature10408PMID:21927002
22. Yanger K, Zong Y, Maggs LR, Shapira SN, Maddipati R, Aiello NM, et al. Robust cellular reprogram-ming occurs spontaneously during liver regeneration. Genes & development. 2013; 27(7):719–724. doi:10.1101/gad.207803.112
23. Yanger K, Stanger BZ. Liver cell reprogramming: Parallels with iPSC biology. Cell Cycle. 2014; 13 (8):1211–1212. doi:10.4161/cc.28381PMID:24621496
24. Desai TJ, Brownfield DG, Krasnow MA. Alveolar progenitor and stem cells in lung development, renewal and cancer. Nature. 2014; 507(7491):190–194. doi:10.1038/nature12930PMID:24499815 25. Stange DE, Koo BK, Huch M, Sibbel G, Basak O, Lyubimova A, et al. Differentiated Troy+ chief cells act as reserve stem cells to generate all lineages of the stomach epithelium. Cell. 2013; 155(2):357–
26. Tata PR, Mou H, Pardo-Saganta A, Zhao R, Prabhu M, Law BM, et al. Dedifferentiation of committed epithelial cells into stem cells in vivo. Nature. 2013; 503(7475):218–223. doi:10.1038/nature12777 PMID:24196716
27. Pardo-Saganta A, Tata PR, Law BM, Saez B, Chow RDW, Prabhu M, et al. Parent stem cells can serve as niches for their daughter cells. Nature. 2015; 523(7562):597–601. doi:10.1038/nature14553PMID: 26147083
28. Pardo-Saganta A, Law BM, Tata PR, Villoria J, Saez B, Mou H, et al. Injury Induces Direct Lineage Seg-regation of Functionally Distinct Airway Basal Stem/Progenitor Cell Subpopulations. Cell stem cell. 2015; 16(2):184–197. doi:10.1016/j.stem.2015.01.002PMID:25658372
29. Watson JK, Rulands S, Wilkinson AC, Wuidart A, Ousset M, Van Keymeulen A, et al. Clonal Dynamics Reveal Two Distinct Populations of Basal Cells in Slow-Turnover Airway Epithelium. Cell reports. 2015; 12(1):90–101. doi:10.1016/j.celrep.2015.06.011PMID:26119728
30. Tomlinson IP, Bodmer WF. Failure of programmed cell death and differentiation as causes of tumors: some simple mathematical models. Proc Natl Acad Sci USA. 1995 Nov; 92:11130–11134. doi:10. 1073/pnas.92.24.11130PMID:7479951
31. d’Onofrio A, Tomlinson IP. A nonlinear mathematical model of cell turnover, differentiation and tumori-genesis in the intestinal crypt. J Theor Biol. 2007 Feb; 244:367–374. doi:10.1016/j.jtbi.2006.08.022 PMID:17049944
32. Johnston MD, Edwards CM, Bodmer WF, Maini PK, Chapman SJ. Mathematical modeling of cell popu-lation dynamics in the colonic crypt and in colorectal cancer. Proc Natl Acad Sci USA. 2007 Mar; 104:4008–4013. doi:10.1073/pnas.0611179104PMID:17360468
33. Boman BM, Fields JZ, Cavanaugh KL, Guetter A, Runquist OA. How dysregulated colonic crypt dynam-ics cause stem cell overpopulation and initiate colon cancer. Cancer Res. 2008 May; 68:3304–3313. doi:10.1158/0008-5472.CAN-07-2061PMID:18451157
34. Hardy K, Stark J. Mathematical models of the balance between apoptosis and proliferation. Apoptosis. 2002 Aug; 7:373–381. doi:10.1023/A:1016183731694PMID:12101397
35. Yatabe Y, Tavare S, Shibata D. Investigating stem cells in human colon by using methylation patterns. Proc Natl Acad Sci USA. 2001 Sep; 98:10839–10844. doi:10.1073/pnas.191225998PMID:11517339 36. Ganguly R, Puri I. Mathematical model for the cancer stem cell hypothesis. Cell proliferation. 2006; 39
(1):3–14. doi:10.1111/j.1365-2184.2006.00369.xPMID:16426418
37. Ganguly R, Puri I. Mathematical model for chemotherapeutic drug efficacy in arresting tumour growth based on the cancer stem cell hypothesis. Cell proliferation. 2007; 40(3):338–354. doi: 10.1111/j.1365-2184.2007.00434.xPMID:17531079
38. Ashkenazi R, Gentry SN, Jackson TL. Pathways to tumorigenesis—modeling mutation acquisition in stem cells and their progeny. Neoplasia (New York, NY). 2008; 10(11):1170. doi:10.1593/neo.08572 39. Michor F. Mathematical models of cancer stem cells. Journal of Clinical Oncology. 2008; 26(17):2854–
2861. doi:10.1200/JCO.2007.15.2421PMID:18539964
40. Tomasetti C, Levy D. Role of symmetric and asymmetric division of stem cells in developing drug resis-tance. Proceedings of the National Academy of Sciences. 2010; 107(39):16766–16771. doi:10.1073/ pnas.1007726107
41. Enderling H, Hahnfeldt P. Cancer Stem Cells In Solid Tumors: Is’Evading Apoptosis’A Hallmark Of Cancer? Progress in Biophysics and Molecular Biology. 2011;. doi:10.1016/j.pbiomolbio.2011.03.007 PMID:21473880
42. Glauche I, Cross M, Loeffler M, Roeder I. Lineage specification of hematopoietic stem cells: mathemati-cal modeling and biologimathemati-cal implications. Stem Cells. 2007 Jul; 25:1791–1799. doi:10.1634/stemcells. 2007-0025PMID:17412891
43. Michor F, Hughes TP, Iwasa Y, Branford S, Shah NP, Sawyers CL, et al. Dynamics of chronic myeloid leukaemia. Nature. 2005; 435(7046):1267–1270. doi:10.1038/nature03669PMID:15988530 44. Colijn C, Mackey MC. A mathematical model of hematopoiesis–I. Periodic chronic myelogenous
leuke-mia. J Theor Biol. 2005 Nov; 237:117–132. doi:10.1016/j.jtbi.2005.03.033PMID:15975596
45. Adimy M, Crauste F, Ruan S. Modelling hematopoiesis mediated by growth factors with applications to periodic hematological diseases. Bull Math Biol. 2006 Nov; 68:2321–2351. doi: 10.1007/s11538-006-9121-9PMID:17086497
46. Marciniak-Czochra A, Stiehl T, Ho AD, Jäger W, Wagner W. Modeling of asymmetric cell division in hematopoietic stem cells-regulation of self-renewal is essential for efficient repopulation. Stem cells and development. 2009; 18(3):377–386. doi:10.1089/scd.2008.0143PMID:18752377
48. Lander AD, Gokoffski KK, Wan FY, Nie Q, Calof AL. Cell lineages and the logic of proliferative control. PLoS Biol. 2009 Jan; 7:e15. doi:10.1371/journal.pbio.1000015PMID:19166268
49. Lo WC, Chou CS, Gokoffski KK, Wan FY, Lander AD, Calof AL, et al. Feedback regulation in multistage cell lineages. Math Biosci Eng. 2009 Jan; 6:59–82. doi:10.3934/mbe.2009.6.59PMID:19292508 50. Nakata Y, Getto P, Marciniak-Czochra A, Alarcón T. Stability analysis of multi-compartment models for
cell production systems. Journal of Biological Dynamics. 2012; 6(sup1):2–18. doi:10.1080/17513758. 2011.558214PMID:22873671
51. Arino O, Kimmel M. Stability analysis of models of cell production systems. Mathematical Modelling. 1986; 7(9):1269–1300. doi:10.1016/0270-0255(86)90081-3
52. Stiehl T, Marciniak-Czochra A. Characterization of stem cells using mathematical models of multistage cell lineages. Mathematical and Computer Modelling. 2011; 53(7):1505–1517. doi:10.1016/j.mcm. 2010.03.057
53. Enderling H, Chaplain MA, Anderson AR, Vaidya JS. A mathematical model of breast cancer develop-ment, local treatment and recurrence. Journal of theoretical biology. 2007; 246(2):245–259. doi:10. 1016/j.jtbi.2006.12.010PMID:17289081
54. Enderling H, Anderson AR, Chaplain MA, Beheshti A, Hlatky L, Hahnfeldt P. Paradoxical dependencies of tumor dormancy and progression on basic cell kinetics. Cancer research. 2009; 69(22):8814–8821. doi:10.1158/0008-5472.CAN-09-2115PMID:19887613
55. Enderling H, Park D, Hlatky L, Hahnfeldt P. The importance of spatial distribution of stemness and pro-liferation state in determining tumor radioresponse. Math Model Nat Phenom. 2009; 4(3):117–133. doi: 10.1051/mmnp/20094305
56. Enderling H, Hlatky L, Hahnfeldt P. Migration rules: tumours are conglomerates of self-metastases. Brit-ish journal of cancer. 2009; 100(12):1917–1925. doi:10.1038/sj.bjc.6605071PMID:19455139 57. Setty Y. In-silico models of stem cell and developmental systems. Theoretical Biology and Medical
Modelling. 2014; 11(1):1. doi:10.1186/1742-4682-11-1PMID:24401000
58. Agur Z, Daniel Y, Ginosar Y. The universal properties of stem cells as pinpointed by a simple discrete model. Journal of mathematical biology. 2002; 44(1):79–86. doi:10.1007/s002850100115PMID: 11942526
59. Dingli D, Traulsen A, Pacheco JM. Stochastic dynamics of hematopoietic tumor stem cells. Cell Cycle. 2007; 6(4):461–466. doi:10.4161/cc.6.4.3853PMID:17329969
60. Lei J, Levin SA, Nie Q. Mathematical model of adult stem cell regeneration with cross-talk between genetic and epigenetic regulation. Proceedings of the National Academy of Sciences. 2014; 111(10): E880–E887. doi:10.1073/pnas.1324267111
61. Yang J, Sun Z, Komarova NL. Analysis of stochastic stem cell models with control. Mathematical biosci-ences. 2015; 266:93–107. doi:10.1016/j.mbs.2015.06.001PMID:26073965
62. Barnett S, Storey C. Some applications of the Lyapunov matrix equation. IMA Journal of Applied Mathe-matics. 1968; 4(1):33–42. doi:10.1093/imamat/4.1.33
63. Barnett S. Introduction to mathematical control theory. Clarendon Press; 1975. 64. Laub AJ. Matrix analysis for scientists and engineers. Philadelphia: Siam; 2005.
65. Hogan BL, Barkauskas CE, Chapman HA, Epstein JA, Jain R, Hsia CC, et al. Repair and regeneration of the respiratory system: complexity, plasticity, and mechanisms of lung stem cell function. Cell Stem Cell. 2014; 15(2):123–138. doi:10.1016/j.stem.2014.07.012PMID:25105578
66. Ghosh M, Smith RW, Runkle CM, Hicks DA, Helm KM, Reynolds SD. Regulation of Trachebronchial Tissue-Specific Stem Cell Pool Size. Stem Cells. 2013; 31(12):2767–2778. doi:10.1002/stem.1440 PMID:23712882
67. Rock JR, Onaitis MW, Rawlins EL, Lu Y, Clark CP, Xue Y, et al. Basal cells as stem cells of the mouse trachea and human airway epithelium. Proceedings of the National Academy of Sciences. 2009; 106 (31):12771–12775. doi:10.1073/pnas.0906850106
68. Rock JR, Randell SH, Hogan BL. Airway basal stem cells: a perspective on their roles in epithelial homeostasis and remodeling. Disease models & mechanisms. 2010; 3(9–10):545–556. doi:10.1242/ dmm.006031
69. Hong KU, Reynolds SD, Watkins S, Fuchs E, Stripp BR. In vivo differentiation potential of tracheal basal cells: evidence for multipotent and unipotent subpopulations. American Journal of Physiology-Lung Cellular and Molecular Physiology. 2004; 286(4):L643–L649. doi:10.1152/ajplung.00155.2003 PMID:12871857
71. Rawlins EL, Ostrowski LE, Randell SH, Hogan BL. Lung development and repair: contribution of the cil-iated lineage. Proceedings of the National Academy of Sciences. 2007; 104(2):410–417. doi:10.1073/ pnas.0610770104
72. Borthwick DW, Shahbazian M, Todd Krantz Q, Dorin JR, Randell SH. Evidence for stem-cell niches in the tracheal epithelium. American journal of respiratory cell and molecular biology. 2001; 24(6):662–
670. doi:10.1165/ajrcmb.24.6.4217PMID:11415930
73. Cho JL, Roche MI, Sandall B, Brass AL, Seed B, Xavier RJ, et al. Enhanced Tim3 activity improves sur-vival after influenza infection. The Journal of Immunology. 2012; 189(6):2879–2889. doi:10.4049/ jimmunol.1102483PMID:22875804
74. Fletcher AG, Breward CJ, Chapman SJ. Mathematical modeling of monoclonal conversion in the colonic crypt. Journal of theoretical biology. 2012; 300:118–133. doi:10.1016/j.jtbi.2012.01.021PMID: 22285553
75. Tieu KS, Tieu RS, Martinez-Agosto JA, Sehl ME. Stem cell niche dynamics: from homeostasis to carci-nogenesis. Stem cells international. 2012; 2012. doi:10.1155/2012/367567PMID:22448171 76. Rodriguez-Brenes IA, Wodarz D, Komarova NL. Stem cell control, oscillations, and tissue regeneration
in spatial and non-spatial models. Frontiers in oncology. 2013; 3. doi:10.3389/fonc.2013.00082PMID: 23596567
77. Waclaw B, Bozic I, Pittman ME, Hruban RH, Vogelstein B, Nowak MA. A spatial model predicts that dis-persal and cell turnover limit intratumour heterogeneity. Nature. 2015; 525(7568):261–264. doi:10. 1038/nature14971PMID:26308893
78. Harpold HL, Alvord EC Jr, Swanson KR. The evolution of mathematical modeling of glioma proliferation and invasion. Journal of Neuropathology & Experimental Neurology. 2007; 66(1):1–9. doi:10.1097/ nen.0b013e31802d9000
79. Bellomo N, Li N, Maini PK. On the foundations of cancer modelling: selected topics, speculations, and perspectives. Mathematical Models and Methods in Applied Sciences. 2008; 18(04):593–646. doi:10. 1142/S0218202508002796
80. De Matteis G, Graudenzi A, Antoniotti M. A review of spatial computational models for multi-cellular sys-tems, with regard to intestinal crypts and colorectal cancer development. Journal of mathematical biol-ogy. 2013; 66(7):1409–1462. doi:10.1007/s00285-012-0539-4PMID:22565629
81. Shahriyari L, Komarova NL. The role of the bi-compartmental stem cell niche in delaying cancer. Physi-cal biology. 2015; 12(5):055001. doi:10.1088/1478-3975/12/5/055001PMID:26228740