www.earth-syst-sci-data.net/2/235/2010/ doi:10.5194/essd-2-235-2010
©Author(s) 2010. CC Attribution 3.0 License. Open
Access
Science
Data
NORPERM, the Norwegian Permafrost Database –
a TSP NORWAY IPY legacy
H. Juliussen1,*, H. H. Christiansen1,2, G. S. Strand3, S. Iversen3, K. Midttømme3,**, and J. S. Rønning3,4
1The University Centre in Svalbard, Longyearbyen, Svalbard, Norway 2Department of Geosciences, University of Oslo, Oslo, Norway
3Geological Survey of Norway, Trondheim, Norway
4Norwegian University of Science and Technology, Trondheim, Norway *now at: Department of Geography, University of Bergen, Bergen, Norway
**now at: Norwegian Geotechnical Institute, Oslo/Trondheim, Norway
Received: 15 February 2010 – Published in Earth Syst. Sci. Data Discuss.: 23 February 2010 Revised: 10 September 2010 – Accepted: 21 September 2010 – Published: 8 October 2010
Abstract. NORPERM, the Norwegian Permafrost Database, was developed at the Geological Survey of
Nor-way during the International Polar Year (IPY) 2007-2009 as the main data legacy of the IPY research project
Permafrost Observatory Project: A Contribution to the Thermal State of Permafrost in Norway and Svalbard
(TSP NORWAY). Its structural and technical design is described in this paper along with the ground temper-ature data infrastructure in Norway and Svalbard, focussing on the TSP NORWAY permafrost observatory installations in theNorth Scandinavian Permafrost ObservatoryandNordenski¨old Land Permafrost Observa-tory, being the primary data providers of NORPERM. Further developments of the database, possibly towards
a regional database for the Nordic area, are also discussed.
The purpose of NORPERM is to store ground temperature data safely and in a standard format for use in future research. The IPY data policy of open, free, full and timely release of IPY data is followed, and the borehole metadata description follows the Global Terrestrial Network for Permafrost (GTN-P) standard. NORPERM is purely a temperature database, and the data is stored in a relation database management system and made pub-lically available online through a map-based graphical user interface. The datasets include temperature time series from various depths in boreholes and from the air, snow cover, ground-surface or upper ground layer recorded by miniature temperature data-loggers, and temperature profiles with depth in boreholes obtained by occasional manual logging. All the temperature data from the TSP NORWAY research project is included in the database, totalling 32 temperature time series from boreholes, 98 time series of micrometeorological tem-perature conditions, and 6 temtem-perature depth profiles obtained by manual logging in boreholes. The database content will gradually increase as data from previous and future projects are added. Links to near real-time permafrost temperatures, obtained by GSM data transfer, is also provided through the user interface.
1 Introduction
Permafrost is ground (soil or rock and included ice and or-ganic material) that remains at or below 0◦C for at least two consecutive years (van Everdingen, 1998). Permafrost is widespread; it underlies approximately 23.9% of the Earth’s exposed land area of the Northern Hemisphere (Zhang et al., 1999). And the temperature of permafrost may serve
Correspondence to:H. Juliussen
(havard.juliussen@geog.uib.no)
Present public and scientific interest in permafrost gener-ates from the possible geomorphic response of permafrost thaw following climate warming, including land subsidence and slope processes (Nelson et al., 2001; Gruber and Hae-berli, 2007). Permafrost thaw will also most likely increase the release of old carbon from the tundra to the atmosphere (Schuur et al., 2009), which will further enhance global warming. Knowledge of the thermal state of permafrost is thus of great importance to evaluate its vulnerability to thaw. In the last three to four decades, permafrost temperatures have increased in large areas of the Arctic (Pavlov, 1994; Osterkamp and Romanovsky, 1999; Smith et al., 2005; Jor-genson et al., 2006; Osterkamp, 2007; Isaksen et al., 2007; Harris et al., 2009). The instrumented sites are, however, un-evenly distributed and large areas are not represented, and a need for a global permafrost temperature monitoring network was realized by the International Permafrost Association (IPA) who coordinated the International Polar Year (IPY) 2007–2009 research projectPermafrost Observatory Project: A Contribution to the Thermal State of Permafrost (TSP).
The main aims of the TSP project were to obtain a snap-shot of permafrost temperatures during the IPY as a base-line for future changes (i.e. next IPY) that spatially covers the world’s permafrost regions, and to significantly expand the network of boreholes for improved detection of future changes in the permafrost thermal state (Brown and Chris-tiansen, 2006). In the national TSP projects, permafrost ob-servatories were established with ground temperature record-ings in boreholes, either as occasional logging or continuous monitoring, and some sites also have temperature monitor-ing in the air, snow cover, at the ground surface and/or in the upper ground to resolve climate-permafrost relationships. Recordings of the active layer thickness for the Circumpo-lar Active Layer Monitoring (CALM) network (Brown et al., 2000) were also included. The objective is to maintain the observatories also after the IPY, as International Network of Permafrost Observatories, to provide long-term data se-ries. These series will contribute to global observation pro-grammes such as the Sustaining Arctic Observing Networks (SAON) and the Pan-Antarctic Observing System (PantOS). The Norwegian contribution to TSP, thePermafrost Ob-servatory Project: A Contribution to the Thermal State of
Permafrost in Norway and Svalbard (TSP NORWAY), has
established permafrost observatories in Troms and Finnmark, the two northernmost counties of Norway, and in central and western Svalbard (Christiansen et al., 2010). These contain 32 boreholes and 98 sites with miniature temperature data-loggers (MTDs) for continuous monitoring of micromete-orological temperature conditions (see Table 1). The con-siderable amount of data acquired are handled according to the IPY data policy (International Polar Year Data and Infor-mation Service – IPYDIS, http://ipydis.org), stating that data collected under the auspices of IPY-projects should be stored in secure repositories and made openly, freely and fully avail-able on the shortest feasible timescale (http://ipydis.org).
Table 1.All NORPERM study areas in the North Scandinavian and Nordenski¨old Land Permafrost Observatories, including the num-ber of boreholes and miniature temperature data-loggers (MTDs). Boreholes with continuous temperature monitoring and boreholes with manual temperature logging are listed separately.
Study Areas No. of boreholes No. of boreholes MTDs with monitoring with logging
North Scandinavian Permafrost Observatory
Kistefjellet 1 – 2
Njunis – – 4
Lavkavagge 3 – –
Nordnes 3 – 18
Kåfjord-Ryodasvarri – – 4
Guolasjavri 3 – –
Trolltinden 1 – –
Abojavri 2 – 1
Bidjovagge – 2 1
Kautokeino – – 1
Suolovuopmi – – 1
Sihccajavri – – 1
Cuovdattmohkki – – 3
Karasjok/Iˇskoras 2 – 7
Tana/Rustefjelbma – 1 2
Karlebotn – – 1
TOTAL 15 3 46
Nordenski¨old Land Permafrost Observatory
Kapp Linn`e 4 – 10
Advent- and Longyeardalen 10 3 42
Ny-Ålesund 1 – –
Reindalen-Lunckefjell 1 – –
Svea 1 – –
TOTAL 17 3 52
TOTAL, both observatories 32 6 98
Southern Norway (school module)
Åsvang – – 1
Malvik – – 1
Gausdal – – 1
TOTAL – – 3
The aim of this paper is to present the main data legacy of the TSP NORWAY project; the NORPERM database and its structural and technical design. We also give an overview of the pre-IPY and the IPY permafrost data infrastructure in Norway and Svalbard, with focus on the two TSP NORWAY permafrost observatories as the main data sources. Potential future developments of NORPERM are discussed towards the end of the paper.
2 Infrastructure of permafrost temperature data in Norway and Svalbard
While permafrost in Svalbard is continuous except beneath large glaciers, widespread permafrost in Norway is restricted to the mountain areas (Brown et al., 2001; Etzelm¨uller et al., 2003; Humlum et al., 2003; Harris et al., 2009). Sporadic permafrost occurs in palsas down to sea level in Northern Norway (Åhman, 1977). Christiansen et al. (2010) gives an overview of the thermal state of permafrost in the Nordic re-gion during IPY, showing that the mean temperature in the upper part of the permafrost in the Norwegian mountains is above−1◦C except in the highest-lying locations, while in Svalbard it is in the range−2 to−6◦C.
2.1 Pre-IPY permafrost data
Before the IPY 2007–2009, direct thermal monitoring of per-mafrost existed only at Juvvasshøe and Dovrefjell in south-ern Norway, two sites in Troms, Northsouth-ern Norway, and Janssonhaugen and Adventdalen in central Svalbard (Chris-tiansen et al., 2010). The Permafrost and Climate in Europe (PACE) project initiated in 1998–2000 thermal monitoring at Juvvasshøe and Janssonhaugen down to 129 and 100 m depth (Isaksen et al., 2001; Harris et al., 2009). Ground temperature has been monitored since 2001 in an altitudi-nal transect of 11 shallow boreholes (9–10 m) across the al-titudinal permafrost transition zone in Dovrefjell, southern Norway (Sollid et al., 2003). A long-term monitoring pro-gramme of permafrost and climate and its potential influ-ence on unstable rock slopes was initiated in 2001 with one borehole at Dalsnibba in southern Norway and two in North-ern Norway at Guolasjavri and Trolltinden (Isaksen et al., 2004), the latter two being included in TSP NORWAY. In addition, numerous near-ground-surface temperature series exists from permafrost mapping projects in different moun-tain areas (e.g. Isaksen et al., 2002; Heggem et al., 2005; Juliussen and Humlum, 2007; Farbrot et al., 2008; Isaksen et al., 2008) and periglacial process studies (e.g. Christiansen, 2005; Juliussen and Humlum, 2008).
Before the IPY the focus had mostly been on the moun-tains of southern Norway, but during the IPY an increased focus on the northern areas of Norway emerged to fill this gap (Farbrot et al., 2008; Isaksen et al., 2008; Christiansen et al., 2010).
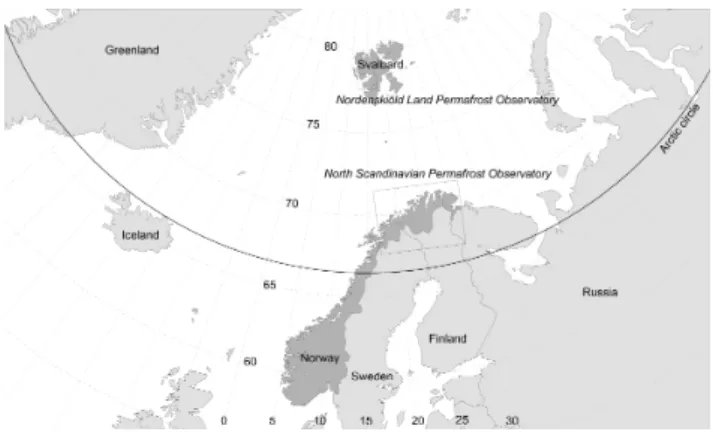
Figure 1.Location of the North Scandinavian Permafrost Observa-tory (cf. Fig. 2) and the Nordenski¨old Land Permafrost ObservaObserva-tory (cf. Fig. 3) in the North-Atlantic Region. The numbers indicate the latitude and longitude in degrees N and E, respectively.
Figure 2. The North Scandinavian Permafrost Observatory with the position of the boreholes indicated. The borehole IDs refer to Table 2.
2.2 Permafrost observatory design
Figure 3.The Nordensk¨old Land Permafrost Observatory in Sval-bard with the position of the boreholes indicated. The Ny-Ålesund borehole is located outside the map. The borehole IDs refer to Ta-ble 2.
ground temperatures. In Northern Norway, the Kistefjellet mountain in the west and the Iˇskoras mountain in continen-tal Finnmarksvidda in the east represent the range in con-tinentality (Fig. 2). In Svalbard, the concon-tinentality range is represented by Kapp Linn`e at the most martime part of the west coast to the Advent- and Longyeardalen area in Sval-bard (Fig. 3). In some study areas the number and location of the measurement sites have been selected to quantify the spatial variability in microclimate due to differences in snow cover, vegetation or ground-surface material within the study area. Monitoring continues at most of the sites after the IPY for future assessment of long-term trends in ground temper-atures.
2.3 IPY ground thermal instrumentation
The measurements include continuous monitoring of ground temperatures in boreholes, occasional manual temperature logging in boreholes and continuous temperature monitor-ing in the air, snow cover, at the ground surface or in the upper ground layer using miniature temperature data-loggers (MTDs) (Fig. 4).
Eight holes were drilled and instrumented for tempera-ture monitoring in Northern Norway in autumn 2007, and additional five holes were established in 2008 (Table 2). In addition, two existing boreholes (Isaksen et al., 2004) were re-instrumented for continuous monitoring (Table 2). Thus, there were in total 15 TSP boreholes with continuous tem-perature monitoring in Northern Norway during the IPY (Ta-ble 1).
In Svalbard, 12 holes were drilled in spring 2008 and in-strumented in summer and autumn 2008 (Tables 1 and 2)
Figure 4. Examples of the three different data types collected as
part of the TSP NORWAY research project, all collected in the North Scandinavian Permafrost Observatory.(a)temperature time-series from monitoring in the borehole NO-B-3 in the Nordnes study area,(b)temperature time-series from micrometeorological monitoring at the site NUTL1-23 (surface temperature time series illustrating the effect of a thick long-lasting snow cover) at Nordnes,
and(c)temperature-depth profile from manual borehole logging of the Bh-S188A borehole in the Bidjovagge study area.
and two pre-IPY holes with continuous thermal monitoring (Kristensen et al., 2008) were included in the observatory (Table 2). Three additional holes were drilled in 2009, two of which were drilled by the local coal-mining company Store Norske Spitsbergen Grubekompani and instrumented in co-operation with TSP NORWAY (Table 2). This gives a total of 17 TSP boreholes with continuous temperature monitoring in Svalbard (Table 1).
The boreholes cover the elevation range from 492 to 990 m a.s.l. in Northern Norway and from 9 to 901 m a.s.l. in Svalbard (Table 2). The depth of the boreholes ranges from 2.2 to 90 m, although most are 10 to 15 m deep (Table 2). This gives a total of 570.2 m of TSP boreholes with ground temperature monitoring in Northern Norway and Svalbard, distributed evenly at the two observatories (281.4 m in North-ern Norway and 288.8 m in Svalbard, Table 2).
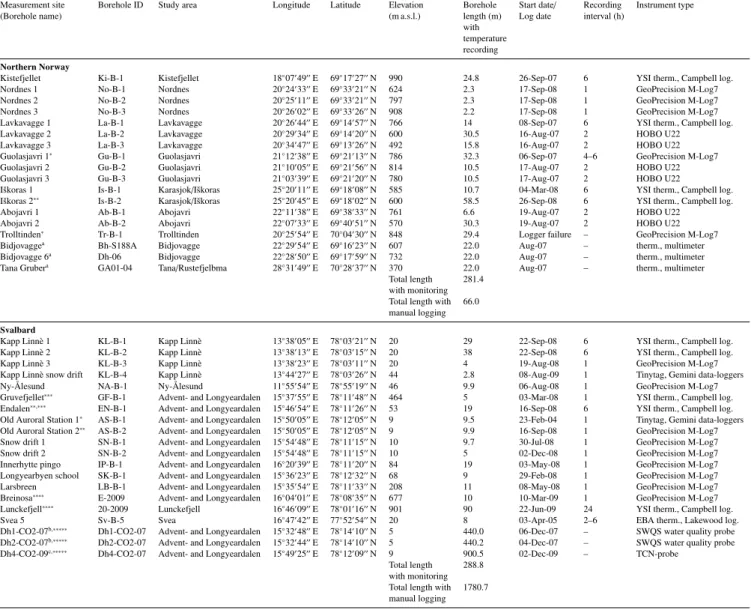
Table 2. All NORPERM TSP NORWAY borehole measurement sites, with location, borehole length with temperature data, the start date of monitoring or alternatively the data for manual logging, recording interval in the case of monitoring and type of instrument used. The accuracy of the different instrument types are as follows: YSI-thermistors connected to a Campbell data-logger±0.05◦C, GeoPrecision
M-Log7±0.2◦C, HOBO U22±0.2◦C, Tinytag±0.2◦C, EBA thermistor-string connected to Lakewood data-logger±0.2◦C. The TCN- and
SWQS-probes have accuracies of±0.5 and±0.02◦C, respectively. The accuracy of the manual readings with multimeter is assumed to be
±0.1◦C.
Measurement site Borehole ID Study area Longitude Latitude Elevation Borehole Start date/ Recording Instrument type (Borehole name) (m a.s.l.) length (m) Log date interval (h)
with temperature recording
Northern Norway
Kistefjellet Ki-B-1 Kistefjellet 18◦07′49′′E 69◦17′27′′N 990 24.8 26-Sep-07 6 YSI therm., Campbell log.
Nordnes 1 No-B-1 Nordnes 20◦24′33′′E 69◦33′21′′N 624 2.3 17-Sep-08 1 GeoPrecision M-Log7
Nordnes 2 No-B-2 Nordnes 20◦25′11′′E 69◦33′21′′N 797 2.3 17-Sep-08 1 GeoPrecision M-Log7
Nordnes 3 No-B-3 Nordnes 20◦26′02′′E 69◦33′26′′N 908 2.2 17-Sep-08 1 GeoPrecision M-Log7
Lavkavagge 1 La-B-1 Lavkavagge 20◦26′44′′E 69◦14′57′′N 766 14 08-Sep-07 6 YSI therm., Campbell log.
Lavkavagge 2 La-B-2 Lavkavagge 20◦29′34′′E 69◦14′20′′N 600 30.5 16-Aug-07 2 HOBO U22
Lavkavagge 3 La-B-3 Lavkavagge 20◦34′47′′E 69◦13′26′′N 492 15.8 16-Aug-07 2 HOBO U22
Guolasjavri 1∗ Gu-B-1 Guolasjavri 21◦12′38′′E 69◦21′13′′N 786 32.3 06-Sep-07 4–6 GeoPrecision M-Log7
Guolasjavri 2 Gu-B-2 Guolasjavri 21◦10′05′′E 69◦21′56′′N 814 10.5 17-Aug-07 2 HOBO U22
Guolasjavri 3 Gu-B-3 Guolasjavri 21◦03′39′′E 69◦21′20′′N 780 10.5 17-Aug-07 2 HOBO U22
Iˇskoras 1 Is-B-1 Karasjok/Iˇskoras 25◦20′11′′E 69◦18′08′′N 585 10.7 04-Mar-08 6 YSI therm., Campbell log.
Iˇskoras 2∗∗ Is-B-2 Karasjok/Iˇskoras 25◦20′45′′E 69◦18′02′′N 600 58.5 26-Sep-08 6 YSI therm., Campbell log.
Abojavri 1 Ab-B-1 Abojavri 22◦11′38′′E 69◦38′33′′N 761 6.6 19-Aug-07 2 HOBO U22
Abojavri 2 Ab-B-2 Abojavri 22◦07′33′′E 69◦40′51′′N 570 30.3 19-Aug-07 2 HOBO U22
Trolltinden∗ Tr-B-1 Trolltinden 20◦25′54′′E 70◦04′30′′N 848 29.4 Logger failure – GeoPrecision M-Log7
Bidjovaggea Bh-S188A Bidjovagge 22◦29′54′′E 69◦16′23′′N 607 22.0 Aug-07 – therm., multimeter
Bidjovagge 6a Dh-06 Bidjovagge 22◦28′50′′E 69◦17′59′′N 732 22.0 Aug-07 – therm., multimeter
Tana Grubera GA01-04 Tana/Rustefjelbma 28◦31′49′′E 70◦28′37′′N 370 22.0 Aug-07 – therm., multimeter
Total length 281.4 with monitoring Total length with 66.0 manual logging
Svalbard
Kapp Linn`e 1 KL-B-1 Kapp Linn`e 13◦38′05′′E 78◦03′21′′N 20 29 22-Sep-08 6 YSI therm., Campbell log.
Kapp Linn`e 2 KL-B-2 Kapp Linn`e 13◦38′13′′E 78◦03′15′′N 20 38 22-Sep-08 6 YSI therm., Campbell log.
Kapp Linn`e 3 KL-B-3 Kapp Linn`e 13◦38′23′′E 78◦03′11′′N 20 4 19-Aug-08 1 GeoPrecision M-Log7
Kapp Linn`e snow drift KL-B-4 Kapp Linn`e 13◦44′27′′E 78◦03′26′′N 44 2.8 08-Aug-09 1 Tinytag, Gemini data-loggers
Ny-Ålesund NA-B-1 Ny-Ålesund 11◦55′54′′E 78◦55′19′′N 46 9.9 06-Aug-08 1 GeoPrecision M-Log7
Gruvefjellet∗∗∗ GF-B-1 Advent- and Longyeardalen 15◦37′55′′E 78◦11′48′′N 464 5 03-Mar-08 1 YSI therm., Campbell log.
Endalen∗∗,∗∗∗ EN-B-1 Advent- and Longyeardalen 15◦46′54′′E 78◦11′26′′N 53 19 16-Sep-08 6 YSI therm., Campbell log.
Old Auroral Station 1∗ AS-B-1 Advent- and Longyeardalen 15◦50′05′′E 78◦12′05′′N 9 9.5 23-Feb-04 1 Tinytag, Gemini data-loggers
Old Auroral Station 2∗∗ AS-B-2 Advent- and Longyeardalen 15◦50′05′′E 78◦12′05′′N 9 9.9 16-Sep-08 1 GeoPrecision M-Log7
Snow drift 1 SN-B-1 Advent- and Longyeardalen 15◦54′48′′E 78◦11′15′′N 10 9.7 30-Jul-08 1 GeoPrecision M-Log7
Snow drift 2 SN-B-2 Advent- and Longyeardalen 15◦54′48′′E 78◦11′15′′N 10 5 02-Dec-08 1 GeoPrecision M-Log7
Innerhytte pingo IP-B-1 Advent- and Longyeardalen 16◦20′39′′E 78◦11′20′′N 84 19 03-May-08 1 GeoPrecision M-Log7
Longyearbyen school SK-B-1 Advent- and Longyeardalen 15◦36′23′′E 78◦12′32′′N 68 9 29-Feb-08 1 GeoPrecision M-Log7
Larsbreen LB-B-1 Advent- and Longyeardalen 15◦35′54′′E 78◦11′33′′N 208 11 08-May-08 1 GeoPrecision M-Log7
Breinosa∗∗∗∗ E-2009 Advent- and Longyeardalen 16◦04′01′′E 78◦08′35′′N 677 10 10-Mar-09 1 GeoPrecision M-Log7
Lunckefjell∗∗∗∗ 20-2009 Lunckefjell 16◦46′09′′E 78◦01′16′′N 901 90 22-Jun-09 24 YSI therm., Campbell log.
Svea 5 Sv-B-5 Svea 16◦47′42′′E 77◦52′54′′N 20 8 03-Apr-05 2–6 EBA therm., Lakewood log.
Dh1-CO2-07b,∗∗∗∗∗ Dh1-CO2-07 Advent- and Longyeardalen 15◦32′48′′E 78◦14′10′′N 5 440.0 06-Dec-07 – SWQS water quality probe
Dh2-CO2-07b,∗∗∗∗∗ Dh2-CO2-07 Advent- and Longyeardalen 15◦32′44′′E 78◦14′10′′N 5 440.2 04-Dec-07 – SWQS water quality probe
Dh4-CO2-09c,∗∗∗∗∗ Dh4-CO2-07 Advent- and Longyeardalen 15◦49′25′′E 78◦12′09′′N 9 900.5 02-Dec-09 – TCN-probe
Total length 288.8 with monitoring Total length with 1780.7 manual logging
∗Pre-IPY data available.
∗∗Partly or fully sponsored by the PYRN-TSP project. ∗∗∗Near real-time data access.
∗∗∗∗Made in cooperation with Store Norske Spitsbergen Grubekompani. ∗∗∗∗∗Logging made by the Longyearbyen CO
2Lab research project and data made available for TSP NORWAY. aOnly manual logging, recorded with thermistor-string and multimeter.
the PYRN-TSP project were to complement the TSP NOR-WAY borehole network in Northern Norway and Svalbard and to extend it into northern Sweden (five holes) and north-ern Finland (one hole) (Juliussen et al., 2008; Christiansen et al., 2010), and to provide capacity building of young per-mafrost scientists. NORPERM will be the main database also for the PYRN-TSP project, although the map service of the graphical user interface so far only covers Norway and Svalbard.
Two types of instrumentation are used for continu-ous temperature monitoring in boreholes; miniature tem-perature data-loggers and thermistor-strings connected to Campbell dataloggers (Table 2). Miniature temperature data-loggers (GeoPrecision, Tinytag, Hobo U22 and U23, UTL-1) generally have lower accuracies (0.2 to 0.27◦C) than the Campbell-logger set-ups (<0.05◦C), but allow more
widespread use of this less expensive instrumentation. The equipment has been calibrated at 0◦C in an ice-bath prior to installation. Two of the boreholes (the 19 m deep En-dalen hole and the 5 m deep Gruvefjellet hole) have been additionally instrumented for near real-time data transfer via GSM, and the latest data can be accessed and directly down-loaded via an URL-address provided in the metadata fact sheets. This has been of great value both for TSP NORWAY research, education and outreach efforts. The temperature recording interval is 1–6 h, but 24 h for the deepest hole (Ta-ble 2). The time series covers at present one to three hydro-logical years, i.e. the IPY period (Table 2).
Manual temperature logging has been made in cooperation with the Geological Survey of Norway in three holes drilled in 2007 and 2009 as part of the research project Longyear-byen CO2Lab(http://co2-ccs.unis.no/) and in three old
ex-ploration boreholes in Northern Norway (Table 1). The holes in Svalbard were logged to 440 to 900 m (Table 2) using two types of probes measuring geophysical parameters. The first probe, the TCN-probe, measures temperature with an accu-racy of 0.5◦C, electrical conductivity and natural gamma ra-diation. The water quality probe (SWQS) measures tempera-ture with a high accuracy of 0.02◦C, electrical conductivity, pressure, degree of saturation, Ph, redox potential and nitro-gen content. For both probes the measurements are reliable only in liquid water, so the measurements were made im-mediately after drilling before the drilling fluid froze. Thus, these probes give data that are not strictly reflecting the tem-perature in the permafrost. For the old holes in Northern Norway it was not possible to use these probes, so they were logged to only 22 m with a thermistor-string that was read with a multimeter (Table 2).
Temperature is monitored in the air, snow cover, at the ground surface and/or in the upper layer of the ground (<2 m) to study the effect of meteorological and
micro-meteorological factors on the ground temperature. There are 52 such set-ups in Svalbard, including mainly pre-IPY sites that have been included into the Nordenski¨old Per-mafrost Observatory, and 46 sites established during the
IPY in Northern Norway (Table 1). Miniature temperature data-loggers of different types have been used, but primarily from the same manufacturers as for the borehole miniloggers (Tinytag, GeoPrecision M-Log, HOBO U22 and U23, UTL-1, with accuracies of 0.2 to 0.27◦C). The temperature record-ing interval is 1–2 h. Ground temperatures are obtained either on relatively snow-free sites to achieve a good relationship to air temperature, or below thick snow covers to obtain values on the Basal Temperature of the winter Snow cover (BTS) (Haeberli, 1973).
Ground temperature data are also being monitored by three high-schools in southern Norway through the TSP NOR-WAY education and outreach moduleTSP-fryseboksen; the TSP-freezer. The TSP-freezer is a box containing a frost
tube and a 1.0 m long thermistor string with three thermis-tors connected to a GeoPrecision miniature data-logger. The schools bought the box from TSP NORWAY and installed the frost tube and thermistor-string to monitor depth of sea-sonal frost in their schoolyards, or on nearby mountain tops where permafrost is expected. The Longyearbyen school borehole in Svalbard is also part of the education and out-reach module, and is also part of the Permafrost Health Outreach Program of the University of Alaska, Fairbanks
(http://www.uaf.edu/water/projects/permafrost/top.htm). Also the research project Permafrost and seasonal frost
in southern Norway: Understanding and modeling the
atmosphere-ground temperature(CRYOLINK) (Etzelm¨uller
et al., 2009) started during the IPY, however, focusing geo-graphically on southern Norway. CRYOLINK collects per-mafrost and seasonal frozen ground temperature data from altitudinal transects in the mountain areas Juvvass (6 bore-holes), Jetta (3 boreholes) and Tron (3 borebore-holes), to delin-eate the local altitudinal limit and thermal state of permafrost.
3 Data quality
The data in NORPERM are raw, except for the Campbell logger data which are automatically corrected by the logger according to the ice-bath calibration to achieve the 0.05◦C accuracy. Also, obvious erroneous recordings (spikes) are manually removed by the data provider or the administrator before the data series are published. It was chosen to publish the raw data along with the ice-bath calibration results in-stead of publishing corrected data as this is more transparent to the end users.
calibrations are available. In-borehole calibration by the use of two thermistorstrings, of which one was to be calibrated and the second was used as reference, was made for three sites in Northern Norway. All calibration data can be found in the individual borehole metadata fact sheets. Between the ice-bath calibrations, zero-curtain calibration provides a pos-sibility for evaluating data quality from the near-surface log-gers.
The administrator is responsible for the overall data qual-ity and to ensure that all TSP NORWAY data and other rele-vant data are included in NORPERM.
4 The design of NORPERM
On 26 February 2009 the NORPERM database was officially launched as the main data legacy of the TSP NORWAY IPY-project. Prior to this, all permafrost data were stored only locally by individual scientists. NORPERM fulfils the cri-teria set by the IPY data policy by providing open, free and full access to all temperature data acquired by the project and gradually also to other data on ground temperature in Norway.
The Geological Survey of Norway (NGU) is the manag-ing institution for geological data in Norway, and is there-fore the natural institution to host a Norwegian ground tem-perature database. NORPERM was developed as part of the larger NGU borehole database system. The database and its graphical user interface were designed in close collabo-ration between NGU IT-technicians and TSP NORWAY sci-entists, with a TSP NORWAY post doc scientist acting as database administrator during the development and first op-erational phase. The technical programming was made by IT-technicians at NGU, specialized on relational databases and online and map-based graphical user interfaces, respec-tively.
The design process started with identification of the data types to be included in the database; Temperature data se-ries acquired in the air, snow cover, near ground surface or boreholes by monitoring set-ups, but also temperature pro-files with depth acquired by occasional manual borehole log-ging (cf. Fig. 4). NGU has temperature logs from deep bore-holes (<1000 m) from projects on crustal heat generation and
heat flow (Pascal et al., 2008; Slagstad et al., 2009) that also should be included. These are, however, not from per-mafrost areas. The database should also hold metadata and photographs for detailed site description.
Important criteria had to be defined and a suitable database structure developed before the technical development com-menced. NORPERM should be easy to use by the diff er-ent scier-entists despite large amounts of data in different for-mats and being measured with different instruments, and it should have a map-based interface. Another criterion was that proper citation of the datasets when used by other sentists should be ensured. This was facilitated through a
ci-Figure 5.NORPERM data management structure. Data is entered and stored in an Oracle database (RDBMS) module. The GTN-P metadata export is also developed in Oracle. The data is georefer-enced and made available online through a map-based user inter-face based on WMS technology. Digital map services (layers) for the background map are available through Norway Digital.
tation template, following the IPYDIS policy on citation of IPY datasets. This template can be found under the
Informa-tion about the datatag in NORPERM. The design process
lasted two years, from the start of IPY in March 2007 until the launch at the end of the IPY in February 2009.
4.1 Technical design
The NGU database system is built on the Oracle Database re-lational database management system (RDBMS) and Oracle development tools (Oracle Forms, Oracle Reports, PL/SQL etc). The core of NORPERM, the relational database con-taining the temperature data, was therefore also developed in the same software environment (Fig. 5). Some techni-cal modules are common for the entire or parts of the NGU database system, such as login routines, part of the borehole metadata description and handling of photographs. Other modules, such as import of temperature data from diverse formats had to be developed. Oracle maintenance strategies are followed and technical maintenance including back-up every night is performed by the IT-section at NGU, securing all the data in an organized and professional way.
The Oracle interface for data import and maintenance is web-based and password-restricted, enabling external data management by the data providers. The administrator, who is a permafrost scientist, can sit outside NGU and create or delete NORPERM user profiles for data providers, and grant access privileges to/from the users through the NGU database system. The users can be given reading, writing or administration privileges depending on their different roles.
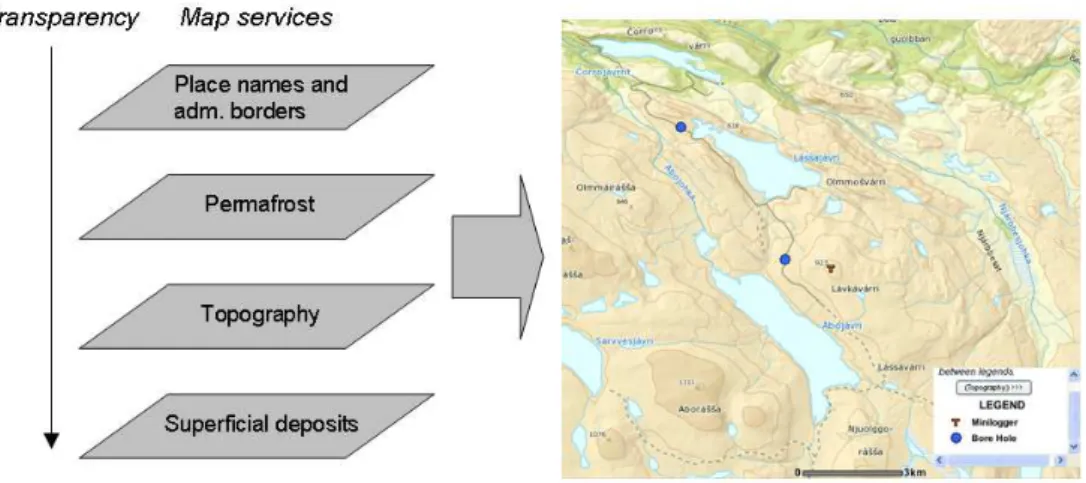
Figure 6. Compilation of different map layers from different vendors into a composite map. Transparency can be set by the user for the
individual map services. The permafrost Map service is the georeferenced data from the Oracle module. The map shows the Abojavri study area with topography and place names.
by the import routine. The export function, however, gives a standard text-file that can be read by most spread sheets.
To make the data available through a map-based pub-lic user interface, they are georeferenced in an ArcSDE geodatabase and made available on the internet using Web Map Service (WMS, www.isotc211.org) technology (Fig. 5). WMS makes it possible to combine geographic information (map services) from various sources in Norway, and share it between many users and applications. In practice, the map services from different service providers comprise the whole map, and are overlaid in an ordered succession on the screen (Fig. 6). Transparency can be set by the user for the individual map services to obtain the desired map view. Map services used in NORPERM are topography, or-thophotos and superficial deposits, the latter only for main-land Norway. These are shared through the public national co-operation on digital data, Norge Digital (Norway Digi-tal, www.norgedigitalt.no). Map service providers are The Norwegian Mapping Authority, the Norwegian Polar Insti-tute and NGU. The applications include standard facilities such as zooming and panoraming.
4.2 Structural design
The NORPERM database is structured into four levels at dif-ferent spatial scales (Fig. 7). At the uppermost level are the entire land areas of Norway and Svalbard, as the database shall be able to contain data from all parts of the entire ge-ographical area of the Norwegian Kingdom. This is repre-sented in the graphical user interface as the full extent of the map services. Mainly because of differences in available background maps, but also because of the distance between the two land areas, there are separate user interfaces for Nor-way and Svalbard (www.ngu/no/norperm). The second level is the permafrost observatories (Figs. 1, 2, 3) followed by
the study areas at the third level, and finally the individual measurement sites at the finest level of detail (Fig. 7).
The permafrost observatories are at the regional scale, with the Nordenski¨old Land Permafrost Observatory in Svalbard covering 5000 km2, and the North Scandinavian Permafrost
Observatory covering 75 000 km2 in Northern Norway. At
this scale the study areas are given in point format on the map (Fig. 7).
A study area represents a geographically limited area within an observatory where one or more measurement sites are clustered (Fig. 7). Spatially a study area is typically at the scale of a mountain or a valley. The study areas vary in geographical extent from, in the case of only one measure-ment site, the immediate surroundings of the site, to 30 km or more in length as for the Advent- and Longyeardalen study area in Svalbard with 13 boreholes and 42 miniature temper-ature data-loggers (Table 1). Metadata describing the study area, such as climate, large-scale geomorphology and geol-ogy, is given in fact sheets for each area (cf. Fig. 8). The fact sheet appears when clicking the study areas in the map. The metadata are complemented with overview photographs and sketch maps in standard JPEG-format.
Figure 7.Overview of the structure of NORPERM. The database is structured into four levels with decreasing spatial scale, represented by the entire land areas of Svalbard and Norway at the coarsest scale, the two permafrost observatories at the regional scale followed by the study areas and finally the measurement sites at the finest level of detail. The insert maps shows how this is displayed in the map, with to the upper right the entire Norwegian land area with study areas shown as point symbols, in the middle right the North Scandinavian Permafrost Observatory with permafrost areas also here shown as point symbols, and to the lower right the Nordnes study area with the measurement sites shown as point symbols.
measurement site has a fact sheet with metadata following the GTN-P standard (Burgess et al., 2000) along with in-formation on instrument type and calibration (Fig. 8). Pho-tographs showing site details are provided at this level. All the temperature data series from the respective measurement sites are available through links in the fact sheet. All data series must be homogenous, i.e. recorded with the same in-strument and have the same recording interval throughout. If one or both of these are changed, or if there is a significant period without data coverage, the data are stored as separate series. One measurement site may thus have several data se-ries, and there is a link for each of the data series. The fact sheet also gives a link to an automatically generated graphi-cal overview plot for each of the data series.
5 NORPERM metadata exports
Reporting of metadata and annual data summaries to the GTN-P, the international TSP metadatabase, is handled with an export routine of the relational database that automatically fills out the GTN-P metadata form on the administrator’s re-quest (Fig. 5) and stores it in digital format. The temperature at the depth of the zero annual amplitude or lower thermistor is automatically extracted and included in the GTN-P form. The form is sent by e-mail to the GTN-P office at the Geolog-ical Survey of Canada. Further, borehole metadata have been made available for the Svalbard Science ForumResearch in Svalbard metadatabase for cross-disciplinary IPY metadata
6 Possible future NORPERM developments
To increase the scientific value of NORPERM, we will work to include also all relevant permafrost temperature data from Norway and Svalbard collected before IPY. Much of such data is at the moment being imported into the database, but it does require an effort also in the post-IPY future to ensure that all relevant data is included.
In its present state, the graphical user interface of NOR-PERM has somewhat reduced functionality on search func-tions. At present it is possible to make geographical searches (place names, municipality and county) in the mainland Nor-way application. We hope to be able to develop search func-tions also on study areas, measurement site names and IDs and metadata describing the sites. A metadata search option would enable a search for all sites with a specific parameter value, e.g. boreholes in bedrock. A search option on tem-perature summaries at standard levels (annual temtem-perature in the air, at the ground surface and at a specified depth in the ground, in particular at the depth of the zero annual temper-ature amplitude) would also be feasible.
A possibility for improved visualization through introduc-ing 3D view has been discussed for the entire NGU database system, and NORPERM will follow this possible upgrade.
We have had increased Nordic permafrost collaboration during IPY, and particularly with the PYRN-TSP project col-lecting permafrost borehole temperatures in Finland, Nor-way and Sweden. Therefore it would be natural to ex-pand NORPERM to cover the entire Nordic area, thus fur-ther developing it to become a regional Nordic permafrost database, still to be abbreviated NORPERM. Such a Nordic Permafrost Database will provide a much better permafrost data overview and basis for collaboration than has ever ex-isted in the Nordic area. A Nordic coverage is already im-plemented in the relational database, but the limitation is the lack of suitable map services for the graphical user interface. A Nordic Permafrost Database would be the first regional permafrost database providing completely open and free ac-cess to all permafrost data from an entire region, and with access to near real-time data from selected boreholes.
Acknowledgements. Special thanks go to the Geological Survey of Norway for excellent cooperation on this challenge. Many thanks also to all our TSP NORWAY colleagues for inspiring discussions on the TSP data and the database structure. We have developed NORPERM especially for you and your future students and colleagues to ensure the legacy of all our permafrost data as collected at the end of the fourth International Polar Year in 2009, and thus hope you will enjoy using it in the future. We also thank the reviewers for their constructive comments that improved the manuscript.
Edited by: O. Eisen
References
Åhman, R.: Palsar i NordNorge, Meddelanden från Lunds Univer-sitets Geografiska Institution Avhandlingar LXXVIII, 1977 (in Swedish).
Brown, J., Nelson, F. E., and Hinkel, K. M.: The circumpolar active layer monitoring (CALM) program research design and initial results, Polar Geography, 3, 165–258, 2000.
Brown, J., Ferrians, O. J., Heginbottom, J. A., and Melnikov, E. S.: Circum-Arctic map of permafrost and ground-ice conditions, Boulder, CO, National Snow and Ice Data Center/World Data
Center for Glaciology, Digital Media, 1998, Revised: February 2001.
Brown, J. and Christiansen, H. H.: Report from the Interna-tional Permafrost Association, Permafrost Periglac., 17, 377– 379, 2006.
Burgess, M. M., Smith, S. L., Brown, J., Romanovsky, V., and Hinkel, K.: Global Terrestrial Network for Permafrost (GTNet-P): permafrost monitoring contributing to global climate obser-vations. Current Research, Geological Survey of Canada, 2000-E14, 8 pp., 2000.
Christiansen, H. H.: Thermal Regime of Ice-wedge Cracking in Ad-ventdalen, Svalbard, Permafrost Periglac., 16, 87–98, 2005. Christiansen, H. H., Etzelm¨uller, B., Isaksen, K. Juliussen, H.,
Far-brot, H., Humlum, O., Johansson, M., Ingeman-Nielsen, T., Kris-tensen, L., Hjort, J., Holmlund, P., Sannel, A. B. K., Sigsgaard, C., Åkerman, H. J., Foged, N., Blikra, L. H., Pernosky, M. A., and Ødegård, R.: The Thermal State of Permafrost in the Nordic area during IPY 2007–2009, Permafrost Periglac., 21, 156–181, 2010.
Etzelm¨uller, B., Berthling, I., and Sollid, J. L.: Aspects and Con-cepts on the Geomorphological Significance of Holocene Per-mafrost in Southern Norway, Geomorphology, 52, 87–104, 2003. Etzelm¨uller, B., Humlum, O., Isaksen, K., Schuler, T., Skaugen, T., Ødegård, R. S., Farbrot, H., and Hipp, T.: CRYOLINK – Permafrost and seasonal frost in Norway, European Geosciences Union, General Assembly, Abstract EGU2009-3589, 2009. Farbrot, H., Isaksen, K., and Etzelm¨uller, B.: Present and Past
Dis-tribution of Mountain Permafrost in Gaissane Mountains, North-ern Norway, in: Proceedings Volume 1, Ninth IntNorth-ernational Con-ference on Permafrost, University of Alaska Fairbanks, 29 June– 3 July 2008, edited by: Kane, D. L. and Hinkel, K. M., Institute of Northern Engineering, University of Alaska Fairbanks, 427– 432, 2008.
Gruber, S. and Haeberli, W.: Permafrost in steep bedrock slopes and its temperature-related destabilization following climate change, J. Geophys. Res., 112, F02S18, doi:10.1029/2006JF000547,
2007.
Haeberli, W.: Die Basis Temperatur der winterlichen Schneedecke als m¨oglicher Indikator f¨ur die Verbreitung von Permafrost, Zeitschrift f¨ur Gletscherkunde und Glazialgeologie, 9, 221–227, 1973.
Earth-Sci. Rev., 92, 117–171, 2009.
Heggem, E. S. F., Juliussen, H., and Etzelm¨uller, B.: Mountain per-mafrost in central-eastern Norway, Norsk Geogr. Tidsskr., 59, 94–108, 2005.
Humlum, O., Instanes, A., and Sollid, J. L.: Permafrost in Svalbard: a review of research history, climatic background and engineer-ing challenges, Polar Res., 22, 191–215, 2003.
Isaksen, K., Holmlund, P., Sollid, J. L., and Harris, C.: Three deep alpine permafrost boreholes in Svalbard and Scandinavia, Per-mafrost Periglac., 12, 13–25, 2001.
Isaksen, K., Hauck, C., Gudevang, E., Ødegård, R. S., and Sollid, J. L.: Mountain permafrost distribution in Dovrefjell and Jotun-heimen, southern Norway, based on BTS and DC resistivity to-mography data, Norsk Geogr. Tidsskr., 56, 122–136, 2002. Isaksen, K., Blikra, L. H., Eiken, T., and Sollid, J. L.: Mountain
permafrost and instability of rock slopes in western and northern Norway, Abstracts Volume, PACE21 Field Workshop, Longyear-byen, Svalbard, 8–13 September 2004, p. 32, 2004.
Isaksen, K., Sollid, J. L., Holmlund, P., and Harris, C.: Recent warming of mountain permafrost in Svalbard and Scandinavia, J. Geophys. Res.-Earth, 112, F02S04, doi:10.1029/2006JF000522,
2007.
Isaksen, K., Farbrot, H., Blikra, L. H., Johansen, B., Sollid, J. L., and Eiken, T.: Five-Year Ground Surface Temperature Mea-surements in Finnmark, Northern Norway, in: Proceedings of the Ninth International Conference on Permafrost, Fairbanks, Alaska, 789–794, 2008.
Jorgenson, M. T., Shur, Y. L., and Pullman, E. R.: Abrupt Increase in Permafrost Degardation in Arctic Alaska, Geophys. Res. Lett., 33, L02503, doi:10.1029/2005GL024960, 2006.
Juliussen, H. and Humlum, O.: Towards a TTOP ground temper-ature model for mountainous terrain in central-eastern Norway, Permafrost Periglac., 18(2), 161–184, 2007.
Juliussen, H. and Humlum, O.: Thermal regime of openwork block fields on the mountains Elgåhogna and Sølen, central-eastern Norway, Permafrost Periglac., 19, 1–18, 2008.
Juliussen, H., Johansson, M., Hjort, J., and Isaksen, K.: PYRN-TSP: Permafrost Young Researchers Network’s Contribution to the Thermal State of Permafrost Project in the Nordic countries, 33th International Geological Congress, Oslo, 6–14 Aug 2008, Abstract 2008 1345051, 2008.
Kristensen, L., Christiansen, H. H., and Caline, F.: Temperatures in coastal permafrost in the Svea area, Svalbard, in: Proceeedings of the Ninth International Conference on Permafrost, Fairbanks, Alaska, 1005–1010, 2008.
Lachenbruch, A. L., Cladouhos, T. T., and Saltus, R. W.: Permafrost temperature and the changing climate, Proceedings of the Fifth International Conference on Permafrost, Trondheim, Norway, 9– 17, 1988.
Nelson, F. E., Anisimov, O., and Shiklomanov, N. I.: Subsidence risk from thawing permafrost, Nature, 410, 889–890, 2001. Osterkamp, T. E. and Romanovsky, V. E.: Evidence for Warming
and Thawing of Discontinuous Permafrost in Alaska, Permafrost Periglac., 10, 17–37, 1999.
Osterkamp, T. E.: Characteristics of the recent warming of permafrost in Alaska, J. Geophys. Res.-Earth, 112, F02S02, doi:10.1029/2006JF000578, 2007.
Pascal, C., Barr´ere, C., Davidsen, B., Ebbing, J., Elvebakk, H., Gernigon, L., Olesen, O., Roberts, D., Siedlecka, A., Skilbrei, J. R., Slagstad, T., and Wissing, B.: HeatBar Report 2008, Base-ment Heat Generation and Heat Flow in the western Barents Sea – Importance for Hydrocarbon Systems, Geological Survey of Norway, Report no. 2008.072, 64 pp., 2008.
Pavlov, A. V.: Current Changes of Climate and Permafrost in the Arctic and Sub-Arctic of Russia, Permafrost Periglac., 5, 101– 110, 1994.
Schuur, E. A. G., Vogel, J. G., Crummer, K. G., Lee, H., Sickman, J. O., and Osterkamp, T. E.: The effect of permafrost thaw on
old carbon release and net carbon exchange from tundra, Nature, 459, 556–559, 2009.
Slagstad, T., Balling, N., Elvebakk, H., Midttømme, K., Olesen, O., Olsen, L., and Pascal, C.: Heat-flow measurements in Late Palaeoproterozoic to Permian geological provinces in south and central Norway and a new heat-flow map of Fennoscandia and the Norwegian-Greenland Sea, Tectonophysics, 473, 341–361, 2009.
Smith, S. L., Burgess, M. M., Riseborough, D., and Nixon, F. M.: Recent trends from Canadian permafrost thermal monitoring net-work sites, Permafrost Periglac., 16, 19–30, 2005.
Sollid, J. L., Isaksen, K., Eiken, T., and Ødegård, R. S.: The tran-sition zone of mountain permafrost on Dovrefjell, southern Nor-way, in: Proceedings (Vol. 2) of the Eight International Confer-ence on Permafrost, Zurich, Switzerland, 21–25 July, edited by: Phillips, M., Springmann, S. M., and Arenson, L. U., Swets & Zeitlinger, Lisse, 1085–1090, 2003.
van Everdingen, R. O.: Multi-language glossary of permafrost and related ground-ice terms. International Permafrost Association, University of Calgary, Calgary, 1998.